Grundlæggende statistik
| Institutionelle ejere | 47 total, 47 long only, 0 short only, 0 long/short - change of 9,30% MRQ |
| Gennemsnitlig porteføljeallokering | 0.0335 % - change of 0,44% MRQ |
| Institutionelle aktier (lange) | 837.687 (ex 13D/G) - change of 0,03MM shares 3,49% MRQ |
| Institutionel værdi (lang) | $ 22.348 USD ($1000) |
Institutionelt ejerskab og aktionærer
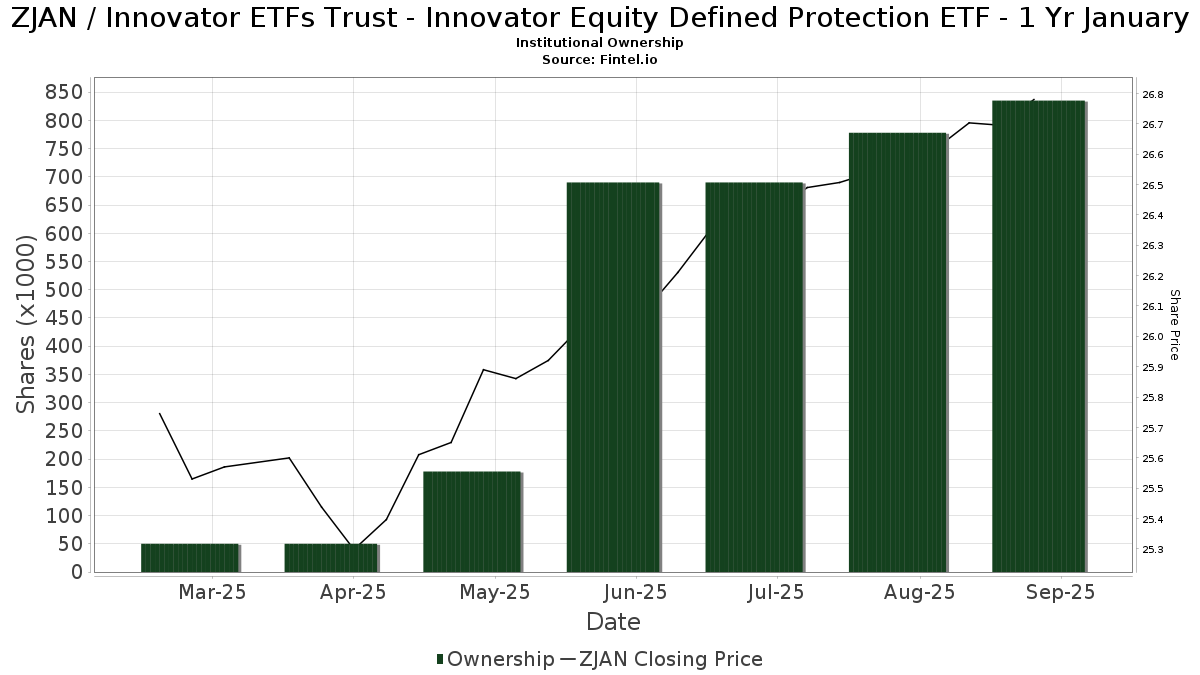
Innovator ETFs Trust - Innovator Equity Defined Protection ETF - 1 Yr January (US:ZJAN) har 47 institutionelle ejere og aktionærer, der har indsendt 13D/G- eller 13F-formularer til Securities Exchange Commission (SEC). Disse institutioner har i alt 837,687 aktier. Største aktionærer omfatter C2P Capital Advisory Group, LLC d.b.a. Prosperity Capital Advisors, Raymond James Financial Inc, Commonwealth Equity Services, Llc, Mutual Advisors, LLC, HighTower Advisors, LLC, Lineweaver Wealth Advisors, LLC, Cerity Partners LLC, Caliber Wealth Management, LLC / KS, Kfg Wealth Management, Llc, and Advisor Group Holdings, Inc. .
Innovator ETFs Trust - Innovator Equity Defined Protection ETF - 1 Yr January (BATS:ZJAN) institutionel ejerskabsstruktur viser aktuelle positioner i virksomheden efter institutioner og fonde, samt seneste ændringer i positionsstørrelse. Større aktionærer kan omfatte individuelle investorer, investeringsforeninger, hedgefonde eller institutioner. Skema 13D angiver, at investoren besidder (eller besidder) mere end 5 % af virksomheden og har til hensigt (eller har til hensigt at) aktivt at forfølge en ændring i forretningsstrategi. Skema 13G indikerer en passiv investering på over 5%.
The share price as of April 24, 2026 is 27,73 / share. Previously, on April 28, 2025, the share price was 25,53 / share. This represents an increase of 8,62% over that period.
Fondens stemningsscore
Fund Sentiment Score (fka Ownership Accumulation Score) finder de aktier, der bliver mest købt af fonde. Det er resultatet af en sofistikeret, multi-faktor kvantitativ model, der identificerer virksomheder med de højeste niveauer af institutionel akkumulering. Scoringsmodellen bruger en kombination af den samlede stigning i oplyste ejere, ændringerne i porteføljeallokeringer i disse ejere og andre målinger. Tallet går fra 0 til 100, hvor højere tal indikerer et højere niveau af akkumulering for sine jævnaldrende, og 50 er gennemsnittet.
Opdateringsfrekvens: Dagligt
Se Ownership Explorer, som giver en liste over højest rangerende virksomheder.
AI+ Ask Fintel’s AI assistant about Innovator ETFs Trust - Innovator Equity Defined Protection ETF - 1 Yr January.
Select a question to share a public post with an AI-crafted answer.
Thinking of good questions…
Institutionel Put/Call-forhold
Ud over at indberette standardaktie- og gældsudstedelser skal institutter med mere end 100 mill. aktiver under forvaltning også oplyse deres put- og call-optionsbeholdninger. Da salgsoptioner generelt indikerer negativ stemning, og købsoptioner indikerer positiv stemning, kan vi få en fornemmelse af den overordnede institutionelle stemning ved at plotte forholdet mellem put og kald. Diagrammet til højre viser det historiske put/call-forhold for dette instrument.
Brug af Put/Call Ratio som en indikator for investorernes stemning overvinder en af de vigtigste mangler ved at bruge totalt institutionelt ejerskab, som er, at en betydelig mængde af aktiver under forvaltning investeres passivt for at spore indekser. Passivt forvaltede fonde køber typisk ikke optioner, så indikatoren for put/call-forholdet følger mere nøje følelsen af aktivt forvaltede fonde.
13F og NPORT arkivering
Detaljer om 13F-arkivering er gratis. Detaljer om NP-ansøgninger kræver et premium-medlemskab. Grønne rækker angiver nye positioner. Røde rækker angiver lukkede positioner. Klik på linket ikon for at se den fulde transaktionshistorik.
Opgrader
for at låse premium-data op og eksportere til Excel ![]() .
.
| Fil dato | Kilde | Investor | Type | Gennemsnitlig pris (Øst) |
Aktier | Δ Aktier (%) |
Rapporteret Værdi ($1000) |
Δ Værdi (%) |
Port Alloc (%) |
|
|---|---|---|---|---|---|---|---|---|---|---|
| 2026-02-18 | 13F | GWM Advisors LLC | 9.921 | 0,00 | 271 | 1,88 | ||||
| 2025-11-13 | 13F | UBS Group AG | 0 | -100,00 | 0 | |||||
| 2026-02-04 | 13F | GGM Financials LLC | 774 | 0,00 | 21 | 5,00 | ||||
| 2026-04-08 | 13F | Wealth Enhancement Advisory Services, Llc | 0 | -100,00 | 0 | |||||
| 2026-04-07 | 13F | CoreCap Advisors, LLC | 9.386 | -3,52 | 256 | -4,14 | ||||
| 2026-04-22 | 13F | Clear Creek Financial Management, LLC | 9.587 | 261 | ||||||
| 2026-01-30 | 13F | Archer Investment Corp | 10.769 | -15,37 | 295 | -13,78 | ||||
| 2026-02-05 | 13F | IMG Wealth Management, Inc. | 680 | 19 | ||||||
| 2026-04-08 | 13F | Lineweaver Wealth Advisors, LLC | 41.103 | 72,27 | 1.120 | 71,78 | ||||
| 2026-04-09 | 13F | Kelly Financial Group Llc | 19.522 | 532 | ||||||
| 2026-02-17 | 13F | Citadel Advisors Llc | 0 | -100,00 | 0 | |||||
| 2026-02-06 | 13F | Integral Investment Advisors, Inc. | 7.850 | 0,00 | 215 | 1,90 | ||||
| 2026-04-20 | 13F | Kfg Wealth Management, Llc | 34.800 | 38,16 | 949 | 37,59 | ||||
| 2026-02-06 | 13F | HighTower Advisors, LLC | 41.753 | -3,44 | 1.142 | -1,72 | ||||
| 2026-04-15 | 13F | Cypress Wealth Services, LLC | 22.487 | 613 | ||||||
| 2026-01-26 | 13F | AE Wealth Management LLC | 17.272 | -1,77 | 473 | 0,00 | ||||
| 2026-01-29 | 13F | Comprehensive Financial Consultants Institutional, Inc. | 8.937 | 0,00 | 245 | 1,67 | ||||
| 2026-02-11 | 13F | Tradition Wealth Management, LLC | 18.323 | 0,00 | 501 | 1,83 | ||||
| 2026-04-09 | 13F | Central Valley Advisors, Llc | 24.159 | 4,32 | 659 | 3,95 | ||||
| 2026-04-17 | 13F | AdvisorNet Financial, Inc | 9.123 | -0,60 | 249 | -1,20 | ||||
| 2026-04-22 | 13F | Applied Capital LLC | 8.073 | 220 | ||||||
| 2026-02-02 | 13F | Truist Financial Corp | 9.773 | 267 | ||||||
| 2026-02-03 | 13F | Sequoia Financial Advisors, LLC | 9.726 | 0,00 | 266 | 1,92 | ||||
| 2026-04-22 | 13F | Cornerstone Wealth Group, LLC | 13.650 | 0,00 | 378 | 1,07 | ||||
| 2026-04-15 | 13F | Merit Financial Group, LLC | 8.478 | 231 | ||||||
| 2026-02-11 | 13F | Cerity Partners LLC | 38.801 | 0,00 | 1.062 | 1,82 | ||||
| 2026-04-09 | 13F | Elmwood Wealth Management, Inc. | 0 | -100,00 | 0 | |||||
| 2026-02-13 | 13F | Kestra Advisory Services, LLC | 0 | -100,00 | 0 | |||||
| 2026-02-13 | 13F | Barclays Plc | 0 | -100,00 | 0 | |||||
| 2026-02-13 | 13F | Centaurus Financial, Inc. | 0 | -100,00 | 0 | |||||
| 2026-02-12 | 13F | Commonwealth Equity Services, Llc | 47.769 | 9,28 | 1.307 | 130.500,00 | ||||
| 2026-02-17 | 13F | Captrust Financial Advisors | 11.677 | 0,00 | 319 | 1,92 | ||||
| 2026-02-17 | 13F | SageView Advisory Group, LLC | 15.976 | 7,26 | 437 | 9,25 | ||||
| 2026-02-09 | 13F | Keating Financial Advisory Services, Inc. | 1.500 | 41 | ||||||
| 2026-02-05 | 13F | Cambridge Investment Research Advisors, Inc. | 19.097 | -26,03 | 1 | |||||
| 2026-04-13 | 13F | Garrett Investment Advisors LLC | 10.175 | 277 | ||||||
| 2026-02-10 | 13F | Envestnet Asset Management Inc | 15.936 | 76,42 | 436 | 80,17 | ||||
| 2026-04-10 | 13F | Abound Wealth Management | 341 | 9 | ||||||
| 2026-04-13 | 13F | IFP Advisors, Inc | 2.358 | 0,00 | 64 | 0,00 | ||||
| 2026-02-17 | 13F | Cetera Investment Advisers | 24.281 | 31,04 | 664 | 33,60 | ||||
| 2026-04-13 | 13F | Gill Capital Partners, Llc | 1.706 | 47 | ||||||
| 2026-02-17 | 13F | Advisory Services Network, LLC | 8.238 | 94,38 | 225 | 99,12 | ||||
| 2026-04-09 | 13F | C2P Capital Advisory Group, LLC d.b.a. Prosperity Capital Advisors | 66.294 | 461,62 | 1.807 | 461,18 | ||||
| 2026-02-17 | 13F | Raymond James Financial Inc | 55.765 | 13,53 | 1.526 | 15,53 | ||||
| 2026-04-07 | 13F | Farther Finance Advisors, LLC | 18.794 | -2,95 | 513 | -3,21 | ||||
| 2026-02-17 | 13F | Susquehanna International Group, Llp | 0 | -100,00 | 0 | |||||
| 2026-04-02 | 13F | Noble Wealth Management PBC | 5.120 | -1,92 | 140 | -2,11 | ||||
| 2026-02-17 | 13F | Old Mission Capital Llc | 16.312 | -13,58 | 446 | -12,03 | ||||
| 2026-04-20 | 13F | Independent Wealth Network Inc. | 0 | -100,00 | 0 | |||||
| 2026-02-17 | 13F | Advisor Group Holdings, Inc. | 33.821 | 63,49 | 925 | 66,67 | ||||
| 2026-02-02 | 13F | Mutual Advisors, LLC | 44.992 | -14,51 | 1.231 | -13,38 | ||||
| 2026-02-03 | 13F | Vantage Financial Partners, LLC | 14.867 | -6,82 | 407 | -5,14 | ||||
| 2026-02-05 | 13F | Allworth Financial LP | 1.500 | 0,00 | 41 | 2,50 | ||||
| 2026-04-23 | 13F | Caliber Wealth Management, LLC / KS | 36.616 | 0,00 | 998 | -0,30 | ||||
| 2026-02-09 | 13F | Kingsview Wealth Management, LLC | 8.653 | 237 | ||||||
| 2026-02-09 | 13F | Harbour Investments, Inc. | 952 | 693,33 | 26 | 766,67 |