Grundlæggende statistik
| Institutionelle ejere | 90 total, 90 long only, 0 short only, 0 long/short - change of 8,43% MRQ |
| Gennemsnitlig porteføljeallokering | 0.0537 % - change of 5,80% MRQ |
| Institutionelle aktier (lange) | 1.058.409 (ex 13D/G) - change of 0,23MM shares 27,37% MRQ |
| Institutionel værdi (lang) | $ 42.665 USD ($1000) |
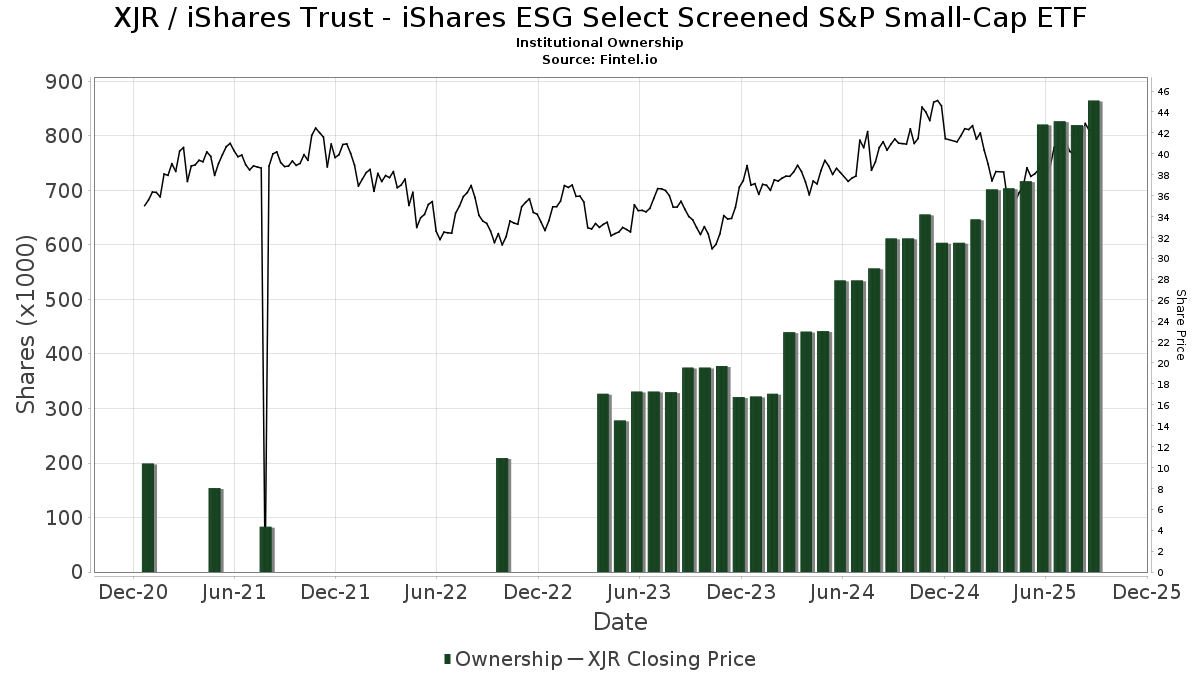
Institutionelt ejerskab og aktionærer
iShares Trust - iShares ESG Select Screened S&P Small-Cap ETF (US:XJR) har 90 institutionelle ejere og aktionærer, der har indsendt 13D/G- eller 13F-formularer til Securities Exchange Commission (SEC). Disse institutioner har i alt 1,058,409 aktier. Største aktionærer omfatter Keybank National Association/oh, Colony Group, LLC, Bailard, Inc., Thrivent Financial For Lutherans, Franklin Resources Inc, LPL Financial LLC, Invera Wealth Advisors, LLC, Highland Financial Advisors, LLC, Biltmore Family Office, LLC, and EP Wealth Advisors, Inc. .
iShares Trust - iShares ESG Select Screened S&P Small-Cap ETF (BATS:XJR) institutionel ejerskabsstruktur viser aktuelle positioner i virksomheden efter institutioner og fonde, samt seneste ændringer i positionsstørrelse. Større aktionærer kan omfatte individuelle investorer, investeringsforeninger, hedgefonde eller institutioner. Skema 13D angiver, at investoren besidder (eller besidder) mere end 5 % af virksomheden og har til hensigt (eller har til hensigt at) aktivt at forfølge en ændring i forretningsstrategi. Skema 13G indikerer en passiv investering på over 5%.
The share price as of April 24, 2026 is 48,15 / share. Previously, on April 28, 2025, the share price was 36,20 / share. This represents an increase of 33,02% over that period.
Fondens stemningsscore
Fund Sentiment Score (fka Ownership Accumulation Score) finder de aktier, der bliver mest købt af fonde. Det er resultatet af en sofistikeret, multi-faktor kvantitativ model, der identificerer virksomheder med de højeste niveauer af institutionel akkumulering. Scoringsmodellen bruger en kombination af den samlede stigning i oplyste ejere, ændringerne i porteføljeallokeringer i disse ejere og andre målinger. Tallet går fra 0 til 100, hvor højere tal indikerer et højere niveau af akkumulering for sine jævnaldrende, og 50 er gennemsnittet.
Opdateringsfrekvens: Dagligt
Se Ownership Explorer, som giver en liste over højest rangerende virksomheder.
AI+ Ask Fintel’s AI assistant about iShares Trust - iShares ESG Select Screened S&P Small-Cap ETF.
Select a question to share a public post with an AI-crafted answer.
Thinking of good questions…
Institutionel Put/Call-forhold
Ud over at indberette standardaktie- og gældsudstedelser skal institutter med mere end 100 mill. aktiver under forvaltning også oplyse deres put- og call-optionsbeholdninger. Da salgsoptioner generelt indikerer negativ stemning, og købsoptioner indikerer positiv stemning, kan vi få en fornemmelse af den overordnede institutionelle stemning ved at plotte forholdet mellem put og kald. Diagrammet til højre viser det historiske put/call-forhold for dette instrument.
Brug af Put/Call Ratio som en indikator for investorernes stemning overvinder en af de vigtigste mangler ved at bruge totalt institutionelt ejerskab, som er, at en betydelig mængde af aktiver under forvaltning investeres passivt for at spore indekser. Passivt forvaltede fonde køber typisk ikke optioner, så indikatoren for put/call-forholdet følger mere nøje følelsen af aktivt forvaltede fonde.
13F og NPORT arkivering
Detaljer om 13F-arkivering er gratis. Detaljer om NP-ansøgninger kræver et premium-medlemskab. Grønne rækker angiver nye positioner. Røde rækker angiver lukkede positioner. Klik på linket ikon for at se den fulde transaktionshistorik.
Opgrader
for at låse premium-data op og eksportere til Excel ![]() .
.
| Fil dato | Kilde | Investor | Type | Gennemsnitlig pris (Øst) |
Aktier | Δ Aktier (%) |
Rapporteret Værdi ($1000) |
Δ Værdi (%) |
Port Alloc (%) |
|
|---|---|---|---|---|---|---|---|---|---|---|
| 2026-02-11 | 13F | Atlantic Private Wealth, LLC | 16.123 | 0,06 | 687 | 0,15 | ||||
| 2026-02-12 | 13F | Commonwealth Equity Services, Llc | 4.863 | -1,68 | 207 | |||||
| 2026-02-17 | 13F | Cetera Investment Advisers | 10.637 | 2,64 | 453 | 2,49 | ||||
| 2026-02-13 | 13F | Colony Group, LLC | 92.153 | 3,06 | 3.924 | 3,10 | ||||
| 2026-04-24 | 13F | Charter Oak Capital Management, LLC | 6.853 | 5,87 | 298 | 8,36 | ||||
| 2026-04-24 | 13F | Keybank National Association/oh | 96.340 | 4.194 | ||||||
| 2026-02-06 | 13F | GPS Wealth Strategies Group, LLC | 0 | -100,00 | 0 | |||||
| 2026-04-08 | 13F | Cambridge Financial Group, LLC | 12.161 | 0,00 | 529 | 5,17 | ||||
| 2026-02-17 | 13F | SageView Advisory Group, LLC | 17.562 | 4,70 | 748 | 4,77 | ||||
| 2026-04-16 | 13F | Sprinkle Financial Consultants LLC | 7.888 | 0,00 | 343 | 2,39 | ||||
| 2026-04-17 | 13F | Hanson & Doremus Investment Management | 495 | 0,00 | 0 | |||||
| 2026-02-13 | 13F | Morgan Stanley | 294 | 0,00 | 13 | 0,00 | ||||
| 2026-04-24 | 13F | Key FInancial Inc | 610 | 0,00 | 27 | 4,00 | ||||
| 2026-02-13 | 13F | Kestra Advisory Services, LLC | 1.416 | 60 | ||||||
| 2026-04-21 | 13F | Armbruster Capital Management, Inc. | 7.356 | -0,07 | 320 | 2,24 | ||||
| 2026-02-12 | 13F | Triumph Capital Management | 123 | 0,00 | 5 | 0,00 | ||||
| 2026-01-26 | 13F | Whittier Trust Co | 144 | 0,00 | 6 | 0,00 | ||||
| 2026-02-13 | 13F | Balanced Rock Investment Advisor | 8.912 | 25,50 | 379 | 25,50 | ||||
| 2026-04-24 | 13F | UMA Financial Services, Inc. | 0 | -100,00 | 0 | |||||
| 2026-02-17 | 13F | Fmr Llc | 75 | -20,21 | 3 | -25,00 | ||||
| 2025-11-12 | 13F | Harbour Investments, Inc. | 0 | -100,00 | 0 | |||||
| 2026-04-24 | 13F | Medallion Wealth Advisors, LLC | 710 | 3,80 | 31 | 3,45 | ||||
| 2026-02-13 | 13F | MAI Capital Management | 10.224 | 58,91 | 435 | 59,34 | ||||
| 2026-02-10 | 13F | Ritter Daniher Financial Advisory LLC / DE | 837 | 0,00 | 36 | 0,00 | ||||
| 2026-02-11 | 13F | Cerity Partners LLC | 13.500 | 0,00 | 575 | 0,00 | ||||
| 2026-02-17 | 13F | Private Advisor Group, LLC | 8.055 | 0,39 | 343 | 0,29 | ||||
| 2026-02-04 | 13F | Bailard, Inc. | 68.842 | -2,70 | 2.931 | -2,66 | ||||
| 2026-02-12 | 13F | CIBC Private Wealth Group, LLC | 710 | 30 | ||||||
| 2026-02-13 | 13F | Mml Investors Services, Llc | 6.361 | 0,98 | 271 | 0,75 | ||||
| 2026-02-12 | 13F | Bradley Foster & Sargent Inc/ct | 0 | -100,00 | 0 | |||||
| 2026-02-13 | 13F | SRS Capital Advisors, Inc. | 257 | 11 | ||||||
| 2026-02-06 | 13F | Global Retirement Partners, LLC | 1.950 | -32,22 | 83 | -31,97 | ||||
| 2026-02-04 | 13F | Biltmore Family Office, LLC | 32.000 | 0,00 | 1.363 | 0,07 | ||||
| 2026-02-13 | 13F | Brown Advisory Inc | 4.827 | 206 | ||||||
| 2026-04-10 | 13F | Magnus Financial Group LLC | 15.258 | -1,52 | 664 | 0,76 | ||||
| 2026-01-26 | 13F | Asset Dedication, LLC | 10.756 | 0,00 | 458 | 0,00 | ||||
| 2026-01-29 | 13F | Dunhill Financial, LLC | 413 | 0,00 | 18 | 0,00 | ||||
| 2026-04-06 | 13F | Highline Wealth Partners Llc | 810 | 0,00 | 35 | 2,94 | ||||
| 2026-04-21 | 13F | Highland Financial Advisors, LLC | 51.192 | 10,98 | 2.229 | 13,44 | ||||
| 2026-02-02 | 13F | Robertson Stephens Wealth Management, LLC | 6.796 | 0,00 | 289 | 0,00 | ||||
| 2026-02-02 | 13F | Legacy Edge Advisors, LLC | 6.376 | 271 | ||||||
| 2026-02-10 | 13F | Meramec Financial Planners, LLC | 1.007 | 47 | ||||||
| 2026-02-02 | 13F | Headinvest, Llc | 12.555 | 15,93 | 535 | 16,09 | ||||
| 2026-02-05 | 13F | Armor Investment Advisors, LLC | 0 | -100,00 | 0 | |||||
| 2026-02-06 | 13F | Tortoise Investment Management, LLC | 0 | -100,00 | 0 | |||||
| 2026-02-10 | 13F | Cherry Tree Wealth Management, LLC | 1.770 | 0,00 | 75 | 0,00 | ||||
| 2026-04-22 | 13F | JNBA Financial Advisors | 26.949 | -2,60 | 1.173 | -0,42 | ||||
| 2026-02-09 | 13F | Smithfield Trust Co | 1.124 | 11,62 | 0 | |||||
| 2026-02-18 | 13F | GWM Advisors LLC | 20.208 | 0,34 | 860 | 0,35 | ||||
| 2026-02-17 | 13F | Bank Of America Corp /de/ | 1.130 | 21,77 | 48 | 23,08 | ||||
| 2026-01-20 | 13F | Stratos Wealth Partners, LTD. | 0 | -100,00 | 0 | |||||
| 2026-04-22 | 13F | Invera Wealth Advisors, LLC | 53.875 | 2.346 | ||||||
| 2026-02-10 | 13F | Envestnet Asset Management Inc | 0 | -100,00 | 0 | |||||
| 2026-04-23 | 13F | Tarbox Family Office, Inc. | 7.614 | 3,78 | 332 | 6,09 | ||||
| 2026-02-02 | 13F | Millstone Evans Group, LLC | 23 | 0,00 | 1 | |||||
| 2026-02-18 | 13F | EP Wealth Advisors, Inc. | 27.274 | 1.161 | ||||||
| 2026-04-08 | 13F | Birchbrook, Inc. | 11.879 | 63,51 | 517 | 67,31 | ||||
| 2026-04-13 | 13F | Massmutual Trust Co Fsb/adv | 15.169 | 660 | ||||||
| 2026-02-12 | 13F | Steward Partners Investment Advisory, Llc | 3.000 | 0,00 | 128 | 0,00 | ||||
| 2026-02-11 | 13F | LPL Financial LLC | 54.183 | -2,11 | 2.307 | -2,04 | ||||
| 2026-02-06 | 13F | Covestor Ltd | 89 | -1,11 | 0 | |||||
| 2026-02-10 | 13F | Godfrey Financial Associates, Inc. | 103 | 4 | ||||||
| 2026-02-19 | 13F | Birchwood Financial Partners, Inc. | 949 | 40 | ||||||
| 2026-02-05 | 13F | Thrivent Financial For Lutherans | 61.031 | 3 | ||||||
| 2026-04-22 | 13F | Spire Wealth Management | 39 | 0,00 | 2 | 0,00 | ||||
| 2025-11-14 | 13F | Wood Tarver Financial Group, LLC | 0 | -100,00 | 0 | |||||
| 2026-02-12 | 13F | Jane Street Group, Llc | 0 | -100,00 | 0 | |||||
| 2026-01-26 | 13F | PFG Investments, LLC | 6.258 | 0,38 | 266 | 0,38 | ||||
| 2026-02-13 | 13F | Gould Asset Management Llc /ca/ | 8.690 | 0,00 | 370 | 0,27 | ||||
| 2026-02-14 | 13F | Rockefeller Capital Management L.P. | 3.827 | -0,91 | 163 | -1,22 | ||||
| 2026-01-26 | 13F | Cwm, Llc | 492 | 0,41 | 0 | |||||
| 2026-02-10 | 13F | Savant Capital, LLC | 6.477 | -3,99 | 276 | -4,18 | ||||
| 2026-02-13 | 13F | 1 North Wealth Services Llc | 190 | 0,00 | 8 | 0,00 | ||||
| 2026-04-08 | 13F | Archer Investment Management, LLC | 0 | -100,00 | 0 | |||||
| 2026-02-17 | 13F | NorthRock Partners, LLC | 5.352 | 9,69 | 228 | 9,66 | ||||
| 2026-04-16 | 13F | Heck Capital Advisors, LLC | 6.624 | -2,69 | 288 | -0,35 | ||||
| 2026-02-17 | 13F | Creative Planning | 6.898 | -0,62 | 294 | -0,68 | ||||
| 2026-04-21 | 13F | GHP Investment Advisors, Inc. | 551 | 0,00 | 24 | 0,00 | ||||
| 2026-02-10 | 13F | Lido Advisors, LLC | 9.629 | 3,64 | 410 | 3,54 | ||||
| 2026-02-13 | 13F | Smartleaf Asset Management LLC | 146 | 6 | ||||||
| 2026-02-17 | 13F | Raymond James Financial Inc | 16.383 | -0,13 | 698 | -0,14 | ||||
| 2026-02-05 | 13F | Mission Wealth Management, Lp | 7.764 | -2,56 | 331 | -2,65 | ||||
| 2026-01-29 | 13F | D.a. Davidson & Co. | 13.300 | 5,25 | 566 | 5,40 | ||||
| 2026-02-13 | 13F | Mariner, LLC | 11.364 | 0,00 | 484 | 0,00 | ||||
| 2026-02-17 | 13F | Advisor Group Holdings, Inc. | 7.368 | 33,45 | 314 | 33,19 | ||||
| 2026-02-03 | 13F | McIlrath & Eck, LLC | 714 | 102,84 | 30 | 114,29 | ||||
| 2026-02-12 | 13F | Principal Securities, Inc. | 0 | -100,00 | 0 | |||||
| 2026-02-13 | 13F | Beta Wealth Group, Inc. | 14.882 | -0,22 | 634 | -0,16 | ||||
| 2026-01-29 | 13F | UBS Group AG | 85 | 4.150,00 | 4 | |||||
| 2026-04-07 | 13F | Farther Finance Advisors, LLC | 1.485 | 65 | ||||||
| 2026-04-20 | 13F | Ronald Blue Trust, Inc. | 768 | 17,25 | 33 | 22,22 | ||||
| 2026-02-11 | 13F | MCF Advisors LLC | 2.280 | 0,00 | 97 | 0,00 | ||||
| 2026-02-10 | 13F | Goldman Sachs Group Inc | 11.380 | 0,00 | 485 | 0,00 | ||||
| 2026-04-07 | 13F | Pathway Financial Advisors LLC | 12.245 | 0,00 | 538 | -0,37 | ||||
| 2026-02-11 | 13F | Franklin Resources Inc | 55.782 | 0,00 | 2.375 | 0,04 | ||||
| 2026-02-17 | 13F | Blair William & Co/il | 2.418 | 1,64 | 103 | 0,99 | ||||
| 2026-02-04 | 13F | Valeo Financial Advisors, LLC | 7.278 | 0,19 | 310 | 0,00 | ||||
| 2026-02-11 | 13F | Milestone Investment Advisors LLC | 2.170 | 0,00 | 92 | 0,00 | ||||
| 2026-02-17 | 13F | Royal Bank Of Canada | 86 | 0,00 | 4 | 0,00 | ||||
| 2026-02-06 | 13F | Addison Advisors LLC | 245 | 0,00 | 10 | 0,00 | ||||
| 2026-02-13 | 13F | Golden State Wealth Management, LLC | 1.004 | 43 | ||||||
| 2026-02-12 | 13F | Eley Financial Management, Inc | 10.424 | -0,20 | 444 | -0,23 |