Grundlæggende statistik
| Institutionelle ejere | 127 total, 127 long only, 0 short only, 0 long/short - change of -3,76% MRQ |
| Gennemsnitlig porteføljeallokering | 0.1079 % - change of -0,72% MRQ |
| Institutionelle aktier (lange) | 5.343.977 (ex 13D/G) - change of -0,18MM shares -3,22% MRQ |
| Institutionel værdi (lang) | $ 332.819 USD ($1000) |
Institutionelt ejerskab og aktionærer
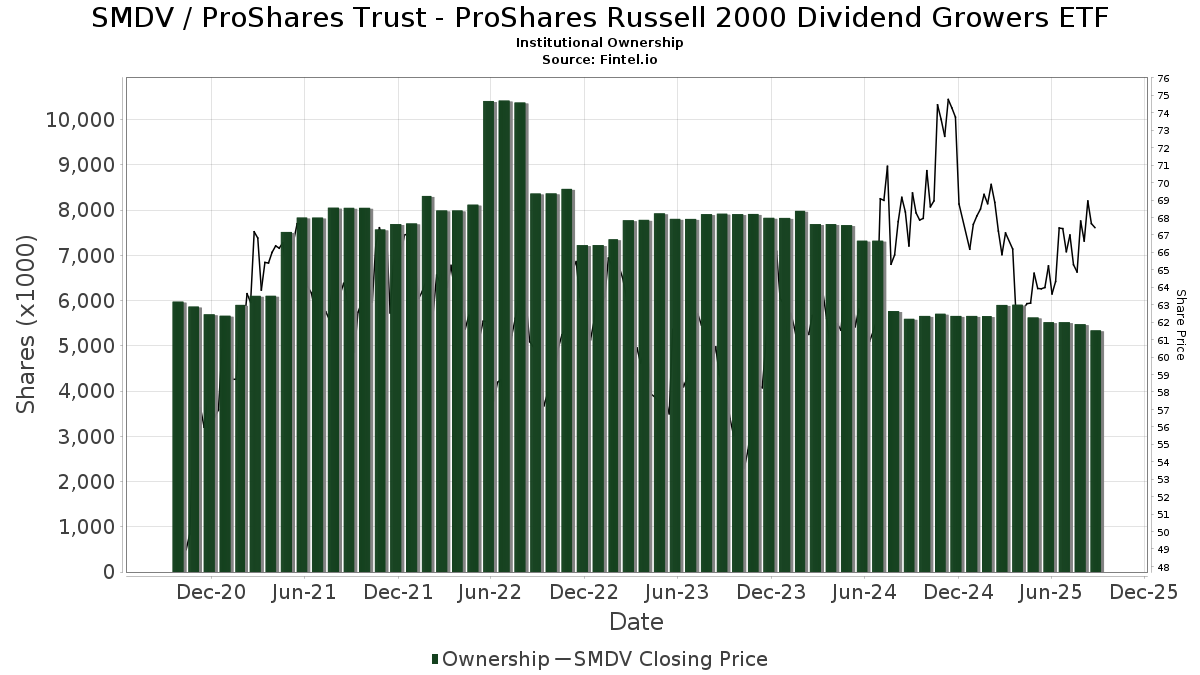
ProShares Trust - ProShares Russell 2000 Dividend Growers ETF (US:SMDV) har 127 institutionelle ejere og aktionærer, der har indsendt 13D/G- eller 13F-formularer til Securities Exchange Commission (SEC). Disse institutioner har i alt 5,343,977 aktier. Største aktionærer omfatter Morgan Stanley, Capital Investment Advisors, LLC, UBS Group AG, Wells Fargo & Company/mn, Raymond James Financial Inc, Bank Of America Corp /de/, LPL Financial LLC, Royal Bank Of Canada, Toth Financial Advisory Corp, and Wiley Bros.-aintree Capital, Llc .
ProShares Trust - ProShares Russell 2000 Dividend Growers ETF (BATS:SMDV) institutionel ejerskabsstruktur viser aktuelle positioner i virksomheden efter institutioner og fonde, samt seneste ændringer i positionsstørrelse. Større aktionærer kan omfatte individuelle investorer, investeringsforeninger, hedgefonde eller institutioner. Skema 13D angiver, at investoren besidder (eller besidder) mere end 5 % af virksomheden og har til hensigt (eller har til hensigt at) aktivt at forfølge en ændring i forretningsstrategi. Skema 13G indikerer en passiv investering på over 5%.
The share price as of September 15, 2025 is 67,48 / share. Previously, on September 16, 2024, the share price was 69,09 / share. This represents a decline of 2,33% over that period.
Fondens stemningsscore
Fund Sentiment Score (fka Ownership Accumulation Score) finder de aktier, der bliver mest købt af fonde. Det er resultatet af en sofistikeret, multi-faktor kvantitativ model, der identificerer virksomheder med de højeste niveauer af institutionel akkumulering. Scoringsmodellen bruger en kombination af den samlede stigning i oplyste ejere, ændringerne i porteføljeallokeringer i disse ejere og andre målinger. Tallet går fra 0 til 100, hvor højere tal indikerer et højere niveau af akkumulering for sine jævnaldrende, og 50 er gennemsnittet.
Opdateringsfrekvens: Dagligt
Se Ownership Explorer, som giver en liste over højest rangerende virksomheder.
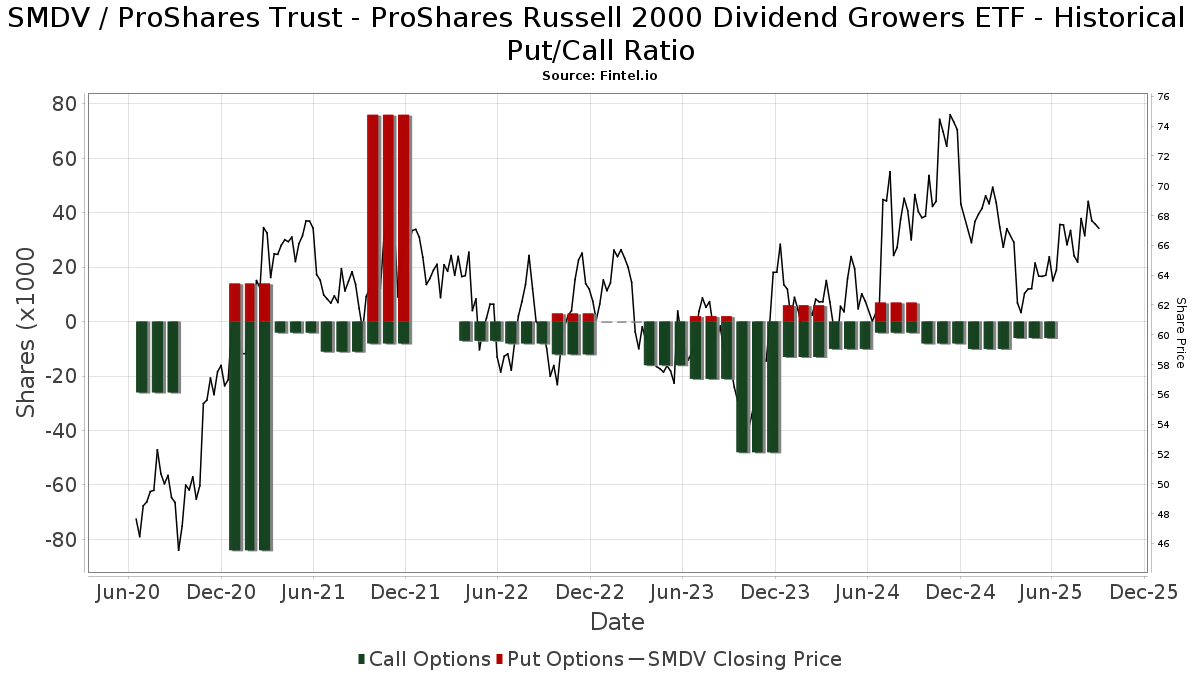
Institutionel Put/Call-forhold
Ud over at indberette standardaktie- og gældsudstedelser skal institutter med mere end 100 mill. aktiver under forvaltning også oplyse deres put- og call-optionsbeholdninger. Da salgsoptioner generelt indikerer negativ stemning, og købsoptioner indikerer positiv stemning, kan vi få en fornemmelse af den overordnede institutionelle stemning ved at plotte forholdet mellem put og kald. Diagrammet til højre viser det historiske put/call-forhold for dette instrument.
Brug af Put/Call Ratio som en indikator for investorernes stemning overvinder en af de vigtigste mangler ved at bruge totalt institutionelt ejerskab, som er, at en betydelig mængde af aktiver under forvaltning investeres passivt for at spore indekser. Passivt forvaltede fonde køber typisk ikke optioner, så indikatoren for put/call-forholdet følger mere nøje følelsen af aktivt forvaltede fonde.
13F og NPORT arkivering
Detaljer om 13F-arkivering er gratis. Detaljer om NP-ansøgninger kræver et premium-medlemskab. Grønne rækker angiver nye positioner. Røde rækker angiver lukkede positioner. Klik på linket ikon for at se den fulde transaktionshistorik.
Opgrader
for at låse premium-data op og eksportere til Excel ![]() .
.
| Fil dato | Kilde | Investor | Type | Gennemsnitlig pris (Øst) |
Aktier | Δ Aktier (%) |
Rapporteret Værdi ($1000) |
Δ Værdi (%) |
Port Alloc (%) |
|
|---|---|---|---|---|---|---|---|---|---|---|
| 2025-08-12 | 13F | Howe & Rusling Inc | 2.721 | 7,72 | 177 | 7,27 | ||||
| 2025-08-13 | 13F | Baird Financial Group, Inc. | 125.218 | 0,34 | 8.147 | -0,48 | ||||
| 2025-08-14 | 13F | Susquehanna International Group, Llp | 9.206 | 122,80 | 599 | 120,66 | ||||
| 2025-08-14 | 13F | Susquehanna International Group, Llp | Call | 6.700 | 8,06 | 436 | 7,14 | |||
| 2025-08-14 | 13F | Lazard Asset Management Llc | 1.250 | 0,00 | 0 | |||||
| 2025-05-06 | 13F | WT Wealth Management | 0 | -100,00 | 0 | |||||
| 2025-08-14 | 13F | Moneta Group Investment Advisors Llc | 3.227 | 0,00 | 210 | -0,95 | ||||
| 2025-07-22 | 13F | DAVENPORT & Co LLC | 3.826 | 0,00 | 249 | -0,80 | ||||
| 2025-08-14 | 13F | Harvest Investment Services, LLC | 14.383 | 2,51 | 936 | 1,63 | ||||
| 2025-08-12 | 13F | Jacobi Capital Management LLC | 28.411 | -0,78 | 1.848 | -1,60 | ||||
| 2025-08-18 | 13F | Geneos Wealth Management Inc. | 7.955 | 11,52 | 518 | 10,71 | ||||
| 2025-07-31 | 13F | Cambridge Investment Research Advisors, Inc. | 54.029 | -3,54 | 4 | 0,00 | ||||
| 2025-08-14 | 13F | GWM Advisors LLC | 5.415 | 8,02 | 352 | 7,32 | ||||
| 2025-05-12 | 13F | Benjamin Edwards Inc | 0 | -100,00 | 0 | |||||
| 2025-07-25 | 13F | Cwm, Llc | 154 | 0,00 | 0 | |||||
| 2025-08-12 | 13F | J.w. Cole Advisors, Inc. | 6.843 | 6,79 | 445 | 5,95 | ||||
| 2025-08-11 | 13F | HighTower Advisors, LLC | 5.121 | 3,41 | 333 | 2,78 | ||||
| 2025-08-12 | 13F | MAI Capital Management | 2.297 | -2,38 | 149 | -3,25 | ||||
| 2025-08-13 | 13F | Beacon Pointe Advisors, LLC | 10.011 | 0,00 | 651 | -0,76 | ||||
| 2025-07-10 | 13F | Wealth Enhancement Advisory Services, Llc | 5.786 | -2,84 | 392 | 0,51 | ||||
| 2025-08-14 | 13F | Citadel Advisors Llc | 9.850 | -35,24 | 641 | -35,81 | ||||
| 2025-05-06 | 13F | Pinnacle Associates Ltd | 0 | -100,00 | 0 | |||||
| 2025-08-11 | 13F | Citigroup Inc | 3.266 | -8,72 | 212 | -9,40 | ||||
| 2025-07-22 | 13F | Legacy Trust | 0 | -100,00 | 0 | |||||
| 2025-07-25 | 13F | Lion Street Advisors, LLC | 3.132 | 0,10 | 204 | -0,98 | ||||
| 2025-08-12 | 13F | Park Square Financial Group, LLC | 44 | 0,00 | 3 | 0,00 | ||||
| 2025-08-11 | 13F | Aptus Capital Advisors, LLC | 218 | 0,46 | 14 | 0,00 | ||||
| 2025-08-11 | 13F | Western Wealth Management, LLC | 4.185 | 0,29 | 272 | -0,37 | ||||
| 2025-07-10 | 13F | CWC Advisors, LLC. | 3.250 | 0,00 | 211 | -0,94 | ||||
| 2025-04-10 | 13F | Hennion & Walsh Asset Management, Inc. | 0 | -100,00 | 0 | -100,00 | ||||
| 2025-08-14 | 13F | Acorn Wealth Advisors, LLC | 5.099 | 1,39 | 332 | 0,61 | ||||
| 2025-08-06 | 13F | Round Rock Advisors, LLC | 4.275 | -0,02 | 278 | -0,71 | ||||
| 2025-08-06 | 13F | Wedbush Securities Inc | 14.370 | -3,34 | 1 | |||||
| 2025-08-11 | 13F | CFS Investment Advisory Services, LLC | 7.529 | 26,86 | 0 | |||||
| 2025-07-25 | 13F | Landmark Wealth Management, LLC | 47.835 | -0,12 | 3 | 0,00 | ||||
| 2025-07-09 | 13F | Dynamic Advisor Solutions LLC | 7.840 | 1,62 | 510 | 0,79 | ||||
| 2025-08-04 | 13F | Assetmark, Inc | 33 | 17,86 | 2 | 100,00 | ||||
| 2025-08-04 | 13F | Arkadios Wealth Advisors | 3.976 | -2,38 | 259 | -3,37 | ||||
| 2025-08-07 | 13F | Palisade Asset Management, LLC | 0 | -100,00 | 0 | |||||
| 2025-07-01 | 13F | Harbor Investment Advisory, Llc | 2.780 | 0,00 | 181 | -1,10 | ||||
| 2025-07-29 | 13F | Private Trust Co Na | 89 | 0,00 | 6 | 0,00 | ||||
| 2025-07-16 | 13F | Essex Financial Services, Inc. | 23.562 | -6,58 | 1.533 | -7,38 | ||||
| 2025-07-14 | 13F | Toth Financial Advisory Corp | 191.474 | -1,42 | 12.457 | -2,22 | ||||
| 2025-08-12 | 13F | Steward Partners Investment Advisory, Llc | 790 | 0,00 | 51 | 0,00 | ||||
| 2025-07-21 | 13F | Empirical Financial Services, LLC d.b.a. Empirical Wealth Management | 0 | -100,00 | 0 | |||||
| 2025-08-14 | 13F | Mercer Global Advisors Inc /adv | 13.807 | -3,07 | 898 | -3,85 | ||||
| 2025-08-14 | 13F | Raymond James Financial Inc | 293.006 | -3,04 | 19.063 | -3,82 | ||||
| 2025-08-08 | 13F | United Asset Strategies, Inc. | 16.220 | -6,63 | 1.055 | -7,37 | ||||
| 2025-07-25 | 13F | Total Clarity Wealth Management, Inc. | 6.640 | -1,98 | 432 | -5,90 | ||||
| 2025-05-15 | 13F | Citadel Advisors Llc | Put | 0 | -100,00 | 0 | -100,00 | |||
| 2025-07-10 | 13F | Oliver Lagore Vanvalin Investment Group | 0 | -100,00 | 0 | |||||
| 2025-07-11 | 13F | Caldwell Securities, Inc | 2.646 | 30,22 | 172 | 29,32 | ||||
| 2025-08-14 | 13F | Stifel Financial Corp | 47.410 | 1,07 | 3.085 | 0,26 | ||||
| 2025-07-24 | 13F | Blair William & Co/il | 5.946 | 0,00 | 387 | -0,77 | ||||
| 2025-08-08 | 13F | Cetera Investment Advisers | 87.490 | -2,03 | 5.692 | -2,82 | ||||
| 2025-07-07 | 13F | Wesbanco Bank Inc | 3.833 | -29,45 | 249 | -30,06 | ||||
| 2025-07-21 | 13F | Ameritas Advisory Services, LLC | 444 | 29 | ||||||
| 2025-08-14 | 13F | Warren Averett Asset Management, LLC | 3.662 | 0,00 | 238 | -0,83 | ||||
| 2025-08-13 | 13F | Northwestern Mutual Wealth Management Co | 15.449 | -33,06 | 1.005 | -33,58 | ||||
| 2025-05-09 | 13F | Pathway Financial Advisers, LLC | 0 | -100,00 | 0 | |||||
| 2025-07-24 | 13F | Us Bancorp \de\ | 1.000 | 150,00 | 65 | 150,00 | ||||
| 2025-07-22 | 13F | Kraematon Investment Advisors, Inc | 5.222 | -2,72 | 340 | -3,69 | ||||
| 2025-08-04 | 13F | Northwest Financial Advisors | 10.695 | -11,10 | 696 | -11,91 | ||||
| 2025-08-19 | 13F | National Asset Management, Inc. | 4.819 | -8,00 | 314 | -11,58 | ||||
| 2025-08-04 | 13F | L.m. Kohn & Company | 9.789 | 13,63 | 637 | 12,57 | ||||
| 2025-08-13 | 13F | Jones Financial Companies Lllp | 11.760 | 34,72 | 768 | 34,27 | ||||
| 2025-05-08 | 13F | Endeavor Private Wealth, Inc. | 0 | -100,00 | 0 | |||||
| 2025-08-14 | 13F | Ameriprise Financial Inc | 44.356 | 72,82 | 2.886 | 71,42 | ||||
| 2025-07-15 | 13F | Bay Capital Advisors, LLC | 4.400 | 0,00 | 286 | -0,69 | ||||
| 2025-08-14 | 13F | Two Sigma Investments, Lp | 29.900 | -5,97 | 1.945 | -6,71 | ||||
| 2025-08-12 | 13F | MWA Asset Management | 4.081 | -26,88 | 265 | -27,60 | ||||
| 2025-08-04 | 13F | Pensionmark Financial Group, Llc | 7.952 | 0,00 | 517 | -0,77 | ||||
| 2025-07-28 | 13F | BRYN MAWR TRUST Co | 368 | -33,57 | 24 | -36,11 | ||||
| 2025-08-12 | 13F | Franklin Resources Inc | 735 | 48 | ||||||
| 2025-07-30 | 13F | Parcion Private Wealth LLC | 24.893 | 0,00 | 1.620 | -0,80 | ||||
| 2025-07-18 | 13F | Trilogy Capital Inc. | 0 | -100,00 | 0 | |||||
| 2025-08-14 | 13F | UBS Group AG | 377.984 | -15,42 | 24.592 | -16,10 | ||||
| 2025-07-23 | 13F | Trueblood Wealth Management, LLC | 15.481 | 0,00 | 1.007 | -0,79 | ||||
| 2025-08-12 | 13F | Proequities, Inc. | 0 | 0 | ||||||
| 2025-08-14 | 13F | CoreCap Advisors, LLC | 75 | -10,71 | 5 | -20,00 | ||||
| 2025-08-07 | 13F | Addison Advisors LLC | 50 | 0,00 | 3 | 0,00 | ||||
| 2025-08-14 | 13F | Royal Capital Wealth Management, LLC | 12.423 | 0,11 | 808 | -0,62 | ||||
| 2025-08-14 | 13F | Comerica Bank | 9.671 | -0,51 | 629 | -1,26 | ||||
| 2025-08-05 | 13F | Key FInancial Inc | 549 | 0,00 | 36 | -2,78 | ||||
| 2025-08-11 | 13F | Nations Financial Group Inc, /ia/ /adv | 15.189 | -1,43 | 988 | -2,18 | ||||
| 2025-07-30 | 13F | FNY Investment Advisers, LLC | 200 | 0 | ||||||
| 2025-08-13 | 13F | Smith, Moore & Co. | 55.164 | 3,31 | 3.589 | 2,46 | ||||
| 2025-08-12 | 13F | Nemes Rush Group LLC | 0 | -100,00 | 0 | |||||
| 2025-08-07 | 13F | Cascade Financial Partners, LLC | 11.693 | 0,00 | 761 | -0,78 | ||||
| 2025-07-18 | 13F | PFG Investments, LLC | 17.259 | -26,11 | 1.123 | -26,76 | ||||
| 2025-08-11 | 13F | Principal Securities, Inc. | 481 | 54,17 | 31 | 47,62 | ||||
| 2025-08-14 | 13F | Jane Street Group, Llc | 4.196 | 273 | ||||||
| 2025-07-08 | 13F | Arlington Trust Co LLC | 140.033 | -3,24 | 9.111 | -4,02 | ||||
| 2025-08-13 | 13F | Colonial Trust Co / SC | 43 | 0,00 | 3 | 0,00 | ||||
| 2025-07-28 | 13F | Harbour Investments, Inc. | 2.243 | 2.143,00 | 146 | 2.316,67 | ||||
| 2025-08-14 | 13F | Citadel Advisors Llc | Call | 0 | -100,00 | 0 | ||||
| 2025-07-14 | 13F | Lewis Asset Management, LLC | 6.835 | -15,01 | 445 | -15,75 | ||||
| 2025-07-24 | 13F | Capital Advisors, Ltd. LLC | 4.943 | 8,26 | 0 | |||||
| 2025-05-05 | 13F | IFP Advisors, Inc | 0 | -100,00 | 0 | |||||
| 2025-08-14 | 13F | Royal Bank Of Canada | 198.490 | -10,73 | 12.914 | -11,44 | ||||
| 2025-08-14 | 13F | Qube Research & Technologies Ltd | 257 | -55,84 | 17 | -57,89 | ||||
| 2025-08-14 | 13F | Wells Fargo & Company/mn | 348.652 | -17,15 | 22.683 | -17,82 | ||||
| 2025-08-15 | 13F | Tower Research Capital LLC (TRC) | 1.319 | -85,17 | 86 | -85,42 | ||||
| 2025-08-14 | 13F | Financial Advisory Service, Inc. | 712 | -54,24 | 46 | -54,90 | ||||
| 2025-08-06 | 13F | Paladin Advisory Group, LLC | 101 | 0,00 | 7 | 0,00 | ||||
| 2025-08-11 | 13F | United Advisor Group, LLC | 48.451 | -0,18 | 3.152 | -0,97 | ||||
| 2025-05-13 | 13F | Bank Of Montreal /can/ | 0 | -100,00 | 0 | |||||
| 2025-07-30 | 13F/A | KPP Advisory Services LLC | 3.682 | -0,46 | 240 | -1,24 | ||||
| 2025-08-05 | 13F | GPS Wealth Strategies Group, LLC | 2.201 | 0,05 | 143 | -0,69 | ||||
| 2025-08-11 | 13F | Synergy Investment Management, LLC | 0 | -100,00 | 0 | |||||
| 2025-08-11 | 13F | Annis Gardner Whiting Capital Advisors, LLC | 344 | 23 | ||||||
| 2025-08-08 | 13F | Avantax Advisory Services, Inc. | 4.402 | 3,58 | 286 | 2,88 | ||||
| 2025-08-15 | 13F | Morgan Stanley | 1.090.179 | -3,83 | 70.927 | -4,61 | ||||
| 2025-05-14 | 13F | Huntington National Bank | 12 | |||||||
| 2025-08-01 | 13F | Envestnet Asset Management Inc | 72.998 | 33,06 | 4.749 | 31,99 | ||||
| 2025-07-09 | 13F | Key Client Fiduciary Advisors, LLC | 5.917 | 0,00 | 385 | -1,03 | ||||
| 2025-09-04 | 13F/A | Advisor Group Holdings, Inc. | 33.543 | -4,15 | 2.185 | -4,92 | ||||
| 2025-07-08 | 13F | Atlas Brown,Inc. | 5.817 | -0,70 | 378 | -1,56 | ||||
| 2025-08-04 | 13F | Spire Wealth Management | 107 | 0,94 | 7 | 0,00 | ||||
| 2025-05-13 | 13F | Capstone Wealth Management Group LLC | 0 | -100,00 | 0 | |||||
| 2025-07-17 | 13F/A | Capital Investment Advisors, LLC | 419.959 | 0,41 | 27.323 | -0,40 | ||||
| 2025-07-17 | 13F | Janney Montgomery Scott LLC | 3.592 | 1,41 | 0 | |||||
| 2025-08-12 | 13F | CIBC Private Wealth Group, LLC | 272 | 0,00 | 18 | 6,25 | ||||
| 2025-08-07 | 13F | New England Private Wealth Advisors LLC | 30.078 | 1.964 | ||||||
| 2025-07-08 | 13F | Nbc Securities, Inc. | 100 | 0,00 | 0 | |||||
| 2025-08-19 | 13F | Anchor Investment Management, LLC | 1.520 | -8,82 | 99 | -10,09 | ||||
| 2025-07-18 | 13F | Truist Financial Corp | 116.781 | 1,65 | 7.598 | 0,82 | ||||
| 2025-08-14 | 13F | Wiley Bros.-aintree Capital, Llc | 156.160 | 28,41 | 10.161 | 27,51 | ||||
| 2025-08-14 | 13F | IHT Wealth Management, LLC | 3.464 | 0,12 | 225 | -0,44 | ||||
| 2025-08-11 | 13F | Private Advisor Group, LLC | 8.488 | 7,63 | 552 | 6,77 | ||||
| 2025-05-15 | 13F | Two Sigma Securities, Llc | 0 | -100,00 | 0 | -100,00 | ||||
| 2025-08-14 | 13F | Fmr Llc | 1.878 | -13,26 | 122 | -13,48 | ||||
| 2025-08-12 | 13F | Global Retirement Partners, LLC | 245 | 60,13 | 16 | 50,00 | ||||
| 2025-07-17 | 13F | Jackson, Grant Investment Advisers, Inc. | 3.455 | 0,06 | 225 | -0,88 | ||||
| 2025-04-16 | 13F | Crowley Wealth Management, Inc. | 0 | -100,00 | 0 | |||||
| 2025-08-04 | 13F | Integrity Alliance, Llc. | 0 | -100,00 | 0 | |||||
| 2025-08-04 | 13F | Creative Financial Designs Inc /adv | 8.347 | 0,01 | 543 | -0,73 | ||||
| 2025-04-08 | 13F | Parallel Advisors, LLC | 0 | -100,00 | 0 | |||||
| 2025-07-23 | 13F | Ameliora Wealth Management Ltd. | 500 | 0,00 | 33 | 0,00 | ||||
| 2025-08-12 | 13F | LPL Financial LLC | 274.509 | 4,29 | 17.860 | 3,45 | ||||
| 2025-08-08 | 13F | Pnc Financial Services Group, Inc. | 573 | -9,62 | 37 | -9,76 | ||||
| 2025-08-14 | 13F | Heritage Wealth Management, Inc. | 3.972 | -10,18 | 258 | -11,03 | ||||
| 2025-08-15 | 13F | Equitable Holdings, Inc. | 19.246 | -0,67 | 1.252 | -1,42 | ||||
| 2025-04-28 | 13F | Mainstream Capital Management LLC | 0 | -100,00 | 0 | |||||
| 2025-08-11 | 13F | HHM Wealth Advisors, LLC | 0 | -100,00 | 0 | |||||
| 2025-07-28 | 13F | ForthRight Wealth Management, LLC | 85.395 | 24,56 | 5.556 | 23,55 | ||||
| 2025-07-29 | 13F | Creekside Partners | 5.485 | -1,83 | 357 | -2,73 | ||||
| 2025-08-06 | 13F | Commonwealth Equity Services, Llc | 94.117 | 0,38 | 6 | 0,00 | ||||
| 2025-08-14 | 13F | Bank Of America Corp /de/ | 279.956 | -1,02 | 18.214 | -1,83 | ||||
| 2025-07-17 | 13F | Park Place Capital Corp | 29 | 0,00 | 2 | 0,00 | ||||
| 2025-08-12 | 13F | Jpmorgan Chase & Co | 2.724 | -66,31 | 177 | -66,60 | ||||
| 2025-08-14 | 13F | Goldman Sachs Group Inc | 35.312 | 58,64 | 2.297 | 57,44 | ||||
| 2025-08-11 | 13F | Wbi Investments, Inc. | 16.584 | 1,74 | 1.079 | 0,84 | ||||
| 2025-04-25 | 13F | Koshinski Asset Management, Inc. | 0 | -100,00 | 0 | |||||
| 2025-08-01 | 13F | Belvedere Trading LLC | Call | 0 | -100,00 | 0 | ||||
| 2025-08-01 | 13F | Anson Capital, Inc. | 3.579 | 4,56 | 233 | 3,57 |