Grundlæggende statistik
| Institutionelle ejere | 92 total, 92 long only, 0 short only, 0 long/short - change of 1,10% MRQ |
| Gennemsnitlig porteføljeallokering | 0.1423 % - change of 44,36% MRQ |
| Institutionelle aktier (lange) | 12.335.193 (ex 13D/G) - change of 0,80MM shares 6,91% MRQ |
| Institutionel værdi (lang) | $ 190.639 USD ($1000) |
Institutionelt ejerskab og aktionærer
VanEck ETF Trust - VanEck Short Muni ETF (US:SMB) har 92 institutionelle ejere og aktionærer, der har indsendt 13D/G- eller 13F-formularer til Securities Exchange Commission (SEC). Disse institutioner har i alt 12,335,193 aktier. Største aktionærer omfatter Bank Of America Corp /de/, Allworth Financial LP, M Holdings Securities, Inc., Wells Fargo & Company/mn, LPL Financial LLC, Morgan Stanley, Jpmorgan Chase & Co, Miracle Mile Advisors, LLC, Dohj, Llc, and Ameriprise Financial Inc .
VanEck ETF Trust - VanEck Short Muni ETF (BATS:SMB) institutionel ejerskabsstruktur viser aktuelle positioner i virksomheden efter institutioner og fonde, samt seneste ændringer i positionsstørrelse. Større aktionærer kan omfatte individuelle investorer, investeringsforeninger, hedgefonde eller institutioner. Skema 13D angiver, at investoren besidder (eller besidder) mere end 5 % af virksomheden og har til hensigt (eller har til hensigt at) aktivt at forfølge en ændring i forretningsstrategi. Skema 13G indikerer en passiv investering på over 5%.
The share price as of September 8, 2025 is 17,40 / share. Previously, on September 9, 2024, the share price was 17,25 / share. This represents an increase of 0,84% over that period.

Fondens stemningsscore
Fund Sentiment Score (fka Ownership Accumulation Score) finder de aktier, der bliver mest købt af fonde. Det er resultatet af en sofistikeret, multi-faktor kvantitativ model, der identificerer virksomheder med de højeste niveauer af institutionel akkumulering. Scoringsmodellen bruger en kombination af den samlede stigning i oplyste ejere, ændringerne i porteføljeallokeringer i disse ejere og andre målinger. Tallet går fra 0 til 100, hvor højere tal indikerer et højere niveau af akkumulering for sine jævnaldrende, og 50 er gennemsnittet.
Opdateringsfrekvens: Dagligt
Se Ownership Explorer, som giver en liste over højest rangerende virksomheder.
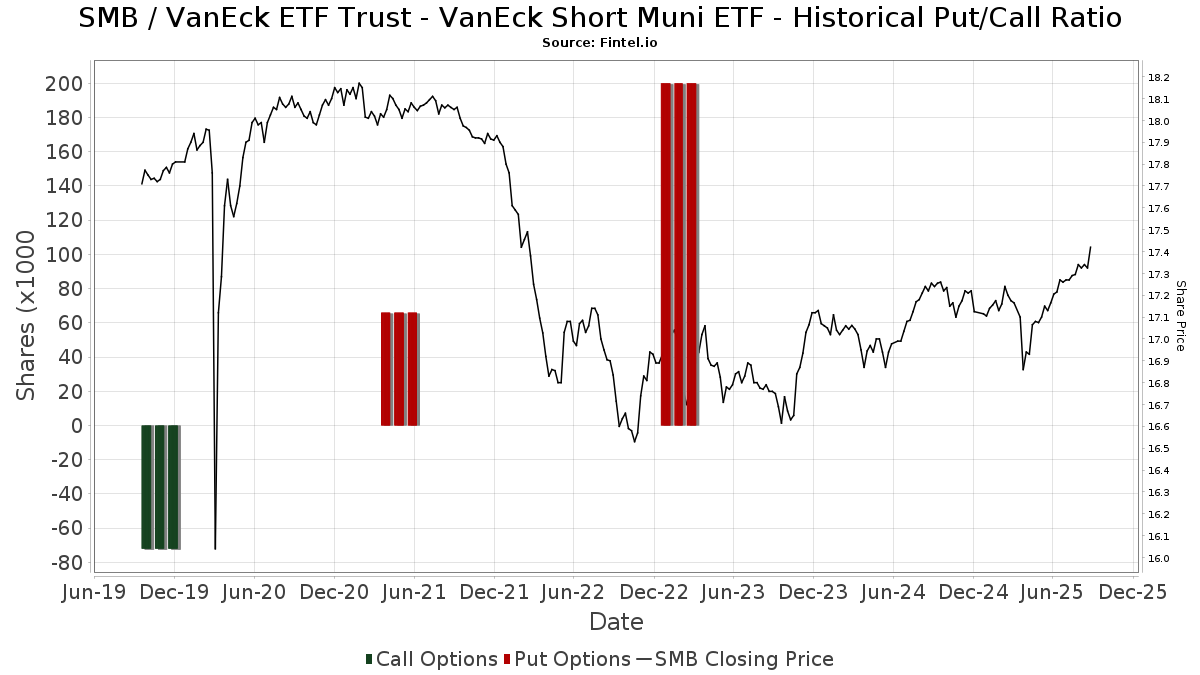
Institutionel Put/Call-forhold
Ud over at indberette standardaktie- og gældsudstedelser skal institutter med mere end 100 mill. aktiver under forvaltning også oplyse deres put- og call-optionsbeholdninger. Da salgsoptioner generelt indikerer negativ stemning, og købsoptioner indikerer positiv stemning, kan vi få en fornemmelse af den overordnede institutionelle stemning ved at plotte forholdet mellem put og kald. Diagrammet til højre viser det historiske put/call-forhold for dette instrument.
Brug af Put/Call Ratio som en indikator for investorernes stemning overvinder en af de vigtigste mangler ved at bruge totalt institutionelt ejerskab, som er, at en betydelig mængde af aktiver under forvaltning investeres passivt for at spore indekser. Passivt forvaltede fonde køber typisk ikke optioner, så indikatoren for put/call-forholdet følger mere nøje følelsen af aktivt forvaltede fonde.
13F og NPORT arkivering
Detaljer om 13F-arkivering er gratis. Detaljer om NP-ansøgninger kræver et premium-medlemskab. Grønne rækker angiver nye positioner. Røde rækker angiver lukkede positioner. Klik på linket ikon for at se den fulde transaktionshistorik.
Opgrader
for at låse premium-data op og eksportere til Excel ![]() .
.
| Fil dato | Kilde | Investor | Type | Gennemsnitlig pris (Øst) |
Aktier | Δ Aktier (%) |
Rapporteret Værdi ($1000) |
Δ Værdi (%) |
Port Alloc (%) |
|
|---|---|---|---|---|---|---|---|---|---|---|
| 2025-08-13 | 13F | EverSource Wealth Advisors, LLC | 12.070 | 18,57 | 208 | 19,54 | ||||
| 2025-08-13 | 13F | Jones Financial Companies Lllp | 26.210 | 21,95 | 452 | 22,55 | ||||
| 2025-08-12 | 13F | Jpmorgan Chase & Co | 512.454 | 15,52 | 8.845 | 16,35 | ||||
| 2025-08-14 | 13F | CoreCap Advisors, LLC | 2 | 0,00 | 0 | |||||
| 2025-08-11 | 13F | One Capital Management, LLC | 25.710 | 0,00 | 444 | 0,68 | ||||
| 2025-07-07 | 13F | Capital Asset Advisory Services LLC | 19.800 | 0,00 | 341 | 0,89 | ||||
| 2025-08-11 | 13F | Aptus Capital Advisors, LLC | 3.073 | 0,00 | 53 | 1,92 | ||||
| 2025-08-14 | 13F | Financial Advisory Service, Inc. | 39.836 | -1,40 | 688 | -0,72 | ||||
| 2025-07-25 | 13F | Cwm, Llc | 4.384 | 0,00 | 0 | |||||
| 2025-08-12 | 13F | Titleist Asset Management, Llc | 14.525 | 0,00 | 251 | 0,81 | ||||
| 2025-08-12 | 13F | MAI Capital Management | 5 | 0,00 | 0 | |||||
| 2025-08-08 | 13F | Cetera Investment Advisers | 40.724 | 10,16 | 703 | 10,90 | ||||
| 2025-07-09 | 13F | Brand Asset Management Group, Inc. | 0 | -100,00 | 0 | |||||
| 2025-08-13 | 13F | Northwestern Mutual Wealth Management Co | 0 | -100,00 | 0 | |||||
| 2025-07-09 | 13F | Massmutual Trust Co Fsb/adv | 323 | 0,00 | 6 | 0,00 | ||||
| 2025-07-28 | 13F | Harbour Investments, Inc. | 5.112 | 0,41 | 88 | 1,15 | ||||
| 2025-08-13 | 13F | Boston Family Office Llc | 13.896 | 0,00 | 0 | |||||
| 2025-08-14 | 13F | Stifel Financial Corp | 340.161 | 42,29 | 5.871 | 43,33 | ||||
| 2025-08-14 | 13F | Integrated Wealth Concepts LLC | 136.927 | 17,55 | 2.363 | 18,45 | ||||
| 2025-07-22 | 13F | Miracle Mile Advisors, LLC | 406.418 | 7.015 | ||||||
| 2025-08-04 | 13F | Arkadios Wealth Advisors | 34.500 | 10,58 | 595 | 11,42 | ||||
| 2025-08-15 | 13F | Morgan Stanley | 519.043 | 5,71 | 8.959 | 6,48 | ||||
| 2025-07-07 | 13F | Versant Capital Management, Inc | 5.435 | -1,47 | 94 | -1,06 | ||||
| 2025-08-14 | 13F | Mml Investors Services, Llc | 93.124 | -3,43 | 2 | 0,00 | ||||
| 2025-04-15 | 13F | Wealthcare Advisory Partners LLC | 0 | -100,00 | 0 | -100,00 | ||||
| 2025-08-14 | 13F | UBS Group AG | 308.200 | -6,70 | 5.320 | -6,02 | ||||
| 2025-07-29 | 13F | Private Trust Co Na | 42.009 | -9,06 | 725 | -8,34 | ||||
| 2025-09-04 | 13F/A | Advisor Group Holdings, Inc. | 162.393 | 10,48 | 2.803 | 11,23 | ||||
| 2025-07-18 | 13F | PFG Investments, LLC | 15.160 | -9,18 | 262 | -8,74 | ||||
| 2025-07-21 | 13F | Ascent Group, LLC | 49.004 | 82,27 | 846 | 83,70 | ||||
| 2025-08-13 | 13F | Transce3nd, LLC | 10.731 | 0,00 | 185 | 1,09 | ||||
| 2025-08-14 | 13F | Raymond James Financial Inc | 76.689 | 8,04 | 1.324 | 8,80 | ||||
| 2025-08-14 | 13F | Wells Fargo & Company/mn | 562.567 | 3,55 | 9.710 | 4,30 | ||||
| 2025-07-07 | 13F | Nova Wealth Management, Inc. | 296 | 0,00 | 5 | 0,00 | ||||
| 2025-07-17 | 13F | Clean Yield Group | 2.216 | 0,00 | 38 | 2,70 | ||||
| 2025-08-08 | 13F | Condor Capital Management | 215.199 | 0,32 | 3.714 | 1,06 | ||||
| 2025-08-12 | 13F | Proequities, Inc. | 0 | 0 | ||||||
| 2025-04-09 | 13F | St Germain D J Co Inc | 0 | -100,00 | 0 | |||||
| 2025-08-14 | 13F | Bank Of America Corp /de/ | 1.880.725 | -8,99 | 32.461 | -8,32 | ||||
| 2025-07-08 | 13F | Juncture Wealth Strategies, Llc | 31.962 | 3,48 | 552 | 4,16 | ||||
| 2025-08-11 | 13F | Principal Securities, Inc. | 3.847 | 34,32 | 66 | 37,50 | ||||
| 2025-07-17 | 13F | Janney Capital Management LLC | 143.426 | -1,00 | 2 | 0,00 | ||||
| 2025-07-30 | 13F | Eqis Capital Management, Inc. | 48.922 | -4,34 | 844 | -3,65 | ||||
| 2025-08-14 | 13F | Ancora Advisors, LLC | 3.580 | -2,72 | 62 | -3,17 | ||||
| 2025-08-12 | 13F | Ameritas Investment Partners, Inc. | 41.687 | -10,21 | 720 | -9,56 | ||||
| 2025-08-08 | 13F | Emerald Investment Partners, Llc | 15.813 | 0,00 | 273 | 0,74 | ||||
| 2025-08-18 | 13F | Geneos Wealth Management Inc. | 386 | 52,57 | 7 | 50,00 | ||||
| 2025-08-05 | 13F | Cherry Tree Wealth Management, LLC | 10.628 | -14,79 | 183 | -14,08 | ||||
| 2025-08-07 | 13F | Allworth Financial LP | 1.867.063 | 5,42 | 32.226 | 7,03 | ||||
| 2025-08-11 | 13F | Diversified Portfolios, Inc. | 28.114 | -69,78 | 485 | -69,57 | ||||
| 2025-07-23 | 13F | Prime Capital Investment Advisors, LLC | 27.444 | 0,66 | 474 | 1,28 | ||||
| 2025-07-17 | 13F | Kavar Capital Partners Group, Llc | 12.500 | 216 | ||||||
| 2025-08-14 | 13F | Jane Street Group, Llc | 28.745 | -47,60 | 496 | -47,18 | ||||
| 2025-07-30 | 13F | Evermay Wealth Management Llc | 9.472 | 0,00 | 163 | 0,62 | ||||
| 2025-05-12 | 13F | Providence First Trust Co | 0 | -100,00 | 0 | |||||
| 2025-08-12 | 13F | Global Retirement Partners, LLC | 2.385 | 0,00 | 41 | 2,50 | ||||
| 2025-07-24 | 13F | Us Bancorp \de\ | 686 | 12 | ||||||
| 2025-07-23 | 13F | Detalus Advisors, LLC | 25.646 | 15,62 | 443 | 16,32 | ||||
| 2025-04-17 | 13F | Vicus Capital | 0 | -100,00 | 0 | |||||
| 2025-08-11 | 13F | HighTower Advisors, LLC | 0 | -100,00 | 0 | |||||
| 2025-08-12 | 13F | LPL Financial LLC | 558.498 | 10,78 | 9.640 | 11,59 | ||||
| 2025-08-06 | 13F | AE Wealth Management LLC | 544 | -3,72 | 9 | 0,00 | ||||
| 2025-07-23 | 13F | Dohj, Llc | 389.766 | 6,99 | 6.599 | 5,70 | ||||
| 2025-08-15 | 13F | Equitable Holdings, Inc. | 21.624 | 373 | ||||||
| 2025-07-10 | 13F | IMPACTfolio, LLC | 156.672 | 3,35 | 2.704 | 4,12 | ||||
| 2025-08-06 | 13F | Hallmark Capital Management Inc | 2.407 | 0,00 | 42 | 0,00 | ||||
| 2025-07-18 | 13F | Bartlett & Co. Wealth Management Llc | 47.588 | -13,42 | 821 | -12,75 | ||||
| 2025-08-11 | 13F | Private Advisor Group, LLC | 67.896 | 9,06 | 1.172 | 9,85 | ||||
| 2025-07-29 | 13F | Liberty Square Wealth Partners Llc | 32.509 | 0,00 | 561 | 0,72 | ||||
| 2025-08-01 | 13F | Envestnet Asset Management Inc | 53.089 | -44,95 | 916 | -44,55 | ||||
| 2025-08-14 | 13F | Royal Bank Of Canada | 12.750 | 0,00 | 220 | 0,92 | ||||
| 2025-08-19 | 13F | Anchor Investment Management, LLC | 2.000 | 35 | ||||||
| 2025-07-24 | 13F | IFP Advisors, Inc | 8.000 | 0,00 | 138 | 0,73 | ||||
| 2025-08-05 | 13F | Westside Investment Management, Inc. | 67.462 | 0,69 | 1.164 | 1,39 | ||||
| 2025-07-30 | 13F | Rehmann Capital Advisory Group | 18.398 | -70,54 | 318 | -70,37 | ||||
| 2025-08-04 | 13F | Flagship Harbor Advisors, Llc | 11.132 | 0,01 | 192 | 1,05 | ||||
| 2025-08-14 | 13F | Sei Investments Co | 264.144 | 18,22 | 4.559 | 19,10 | ||||
| 2025-07-22 | 13F | Merit Financial Group, LLC | 36.323 | -7,61 | 627 | -6,98 | ||||
| 2025-08-06 | 13F | Commonwealth Equity Services, Llc | 22.028 | -24,39 | 0 | |||||
| 2025-08-13 | 13F | Willis Johnson & Associates, Inc. | 212.711 | -8,87 | 3.671 | -8,20 | ||||
| 2025-08-14 | 13F | Ameriprise Financial Inc | 378.708 | -8,53 | 6.537 | -7,87 | ||||
| 2025-07-08 | 13F | Gradient Investments LLC | 90.573 | 1.563 | ||||||
| 2025-07-11 | 13F | Farther Finance Advisors, LLC | 0 | -100,00 | 0 | |||||
| 2025-08-13 | 13F | M Holdings Securities, Inc. | 675.266 | 10,15 | 12 | 10,00 | ||||
| 2025-07-10 | 13F | Wealth Enhancement Advisory Services, Llc | 27.362 | -4,73 | 473 | -4,07 | ||||
| 2025-08-13 | 13F | Cerity Partners LLC | 228.882 | 16,16 | 3.950 | 17,00 | ||||
| 2025-07-14 | 13F | MY Wealth Management Inc. | 253.241 | 4.371 | ||||||
| 2025-07-28 | 13F | Axxcess Wealth Management, Llc | 19.800 | 0,00 | 342 | 0,59 | ||||
| 2025-08-13 | 13F | Flow Traders U.s. Llc | 0 | -100,00 | 0 | |||||
| 2025-07-17 | 13F | Keystone Global Partners, LLC | 3.354 | -77,67 | 58 | -77,82 | ||||
| 2025-07-23 | 13F | Fluent Financial, LLC | 17.065 | 0,21 | 295 | 1,03 | ||||
| 2025-08-05 | 13F | Prosperity Consulting Group, LLC | 167.231 | -4,94 | 2.886 | -4,25 | ||||
| 2025-08-19 | 13F | Newbridge Financial Services Group, Inc. | 333 | 0,00 | 6 | 0,00 | ||||
| 2025-08-14 | 13F | Susquehanna International Group, Llp | 10.726 | 185 | ||||||
| 2025-08-11 | 13F | WPG Advisers, LLC | 38 | 0,00 | 1 | |||||
| 2025-07-25 | 13F | PrairieView Partners, LLC | 329.136 | 12,32 | 6 | 0,00 | ||||
| 2025-08-08 | 13F | Pnc Financial Services Group, Inc. | 253 | -50,10 | 4 | -50,00 | ||||
| 2025-08-05 | 13F | Strategic Financial Concepts, LLC | 0 | -100,00 | 0 | |||||
| 2025-07-22 | 13F | Berger Financial Group, Inc | 11.048 | 0,00 | 191 | 0,53 | ||||
| 2025-08-14 | 13F | Fmr Llc | 31 | -93,97 | 1 | -100,00 | ||||
| 2025-08-14 | 13F | Comerica Bank | 43.927 | 0,00 | 758 | 0,80 | ||||
| 2025-04-21 | 13F | Nelson, Van Denburg & Campbell Wealth Management Group, LLC | 0 | -100,00 | 0 | |||||
| 2025-08-06 | 13F | Golden State Wealth Management, LLC | 7.547 | -0,58 | 130 | 0,00 | ||||
| 2025-05-09 | 13F | Leisure Capital Management | 0 | -100,00 | 0 | |||||
| 2025-08-14 | 13F | MidWestOne Financial Group, Inc. | 203.904 | 19,39 | 3.519 | 20,27 | ||||
| 2025-05-09 | 13F | Atria Wealth Solutions, Inc. | 0 | -100,00 | 0 |