SEER - Seer, Inc. Aktie - Aktiekurs, institutionelt ejerskab, aktionærer (NasdaqGS)

Seer, Inc.
US ˙ NasdaqGS ˙ US81578P1066

Grundlæggende statistik
Institutionelle ejere 80 total, 80 long only, 0 short only, 0 long/short - change of -21,57% MRQ
Gennemsnitlig porteføljeallokering 0.2063 % - change of -54,24% MRQ
Deler fremragende shares (source: Capital IQ)
Institutionelle aktier (lange) 24.462.111 - 43,36% (ex 13D/G) - change of -2,53MM shares -9,37% MRQ
Institutionel værdi (lang) $ 40.446 USD ($1000)
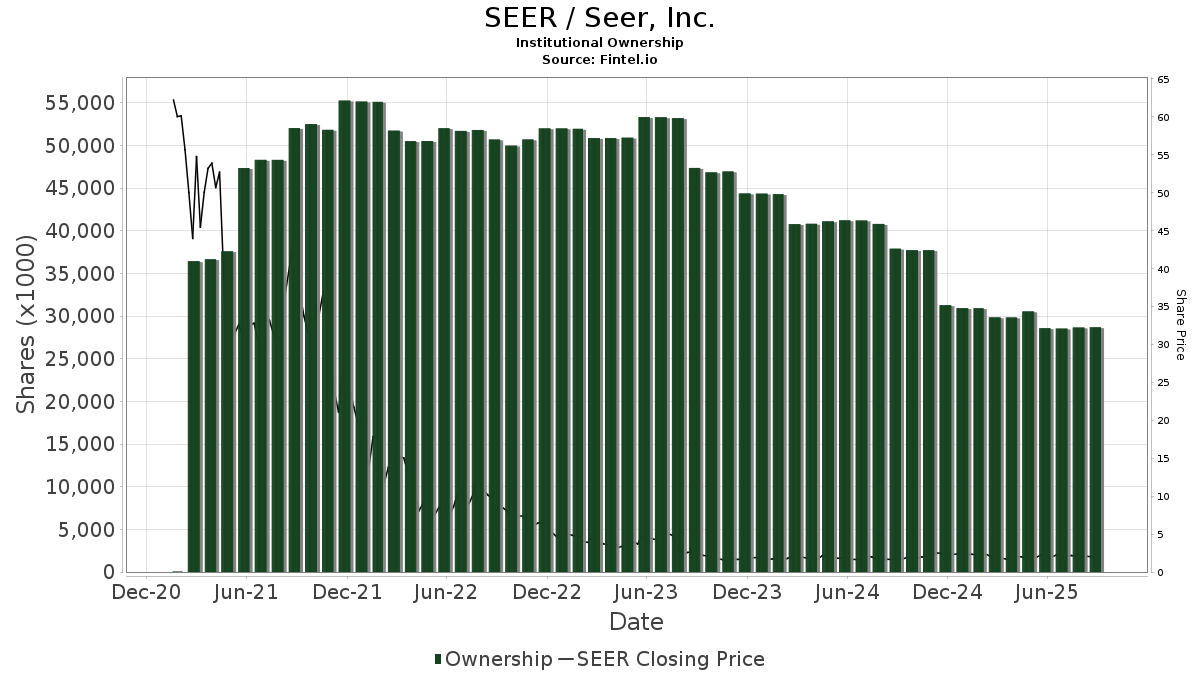
Institutionelt ejerskab og aktionærer

Seer, Inc. (US:SEER) har 80 institutionelle ejere og aktionærer, der har indsendt 13D/G- eller 13F-formularer til Securities Exchange Commission (SEC). Disse institutioner har i alt 24,462,111 aktier. Største aktionærer omfatter Softbank Group Corp, Siren, L.L.C., Vanguard Group Inc, Acadian Asset Management Llc, BlackRock, Inc., Renaissance Technologies Llc, Nano Cap New Millennium Growth Fund L P, AJU IB Investment Co., Ltd., Fmr Llc, and Bridgeway Capital Management Inc .

Seer, Inc. (NasdaqGS:SEER) institutionel ejerskabsstruktur viser aktuelle positioner i virksomheden efter institutioner og fonde, samt seneste ændringer i positionsstørrelse. Større aktionærer kan omfatte individuelle investorer, investeringsforeninger, hedgefonde eller institutioner. Skema 13D angiver, at investoren besidder (eller besidder) mere end 5 % af virksomheden og har til hensigt (eller har til hensigt at) aktivt at forfølge en ændring i forretningsstrategi. Skema 13G indikerer en passiv investering på over 5%.

The share price as of March 16, 2026 is 1,79 / share. Previously, on March 17, 2025, the share price was 1,94 / share. This represents a decline of 7,73% over that period.

SEER / Seer, Inc. Institutional Ownership
Fondens stemningsscore

Fund Sentiment Score (fka Ownership Accumulation Score) finder de aktier, der bliver mest købt af fonde. Det er resultatet af en sofistikeret, multi-faktor kvantitativ model, der identificerer virksomheder med de højeste niveauer af institutionel akkumulering. Scoringsmodellen bruger en kombination af den samlede stigning i oplyste ejere, ændringerne i porteføljeallokeringer i disse ejere og andre målinger. Tallet går fra 0 til 100, hvor højere tal indikerer et højere niveau af akkumulering for sine jævnaldrende, og 50 er gennemsnittet.

Opdateringsfrekvens: Dagligt

Se Ownership Explorer, som giver en liste over højest rangerende virksomheder.

AI+ Ask Fintel’s AI assistant about Seer, Inc..

Select a question to share a public post with an AI-crafted answer.

Thinking of good questions…
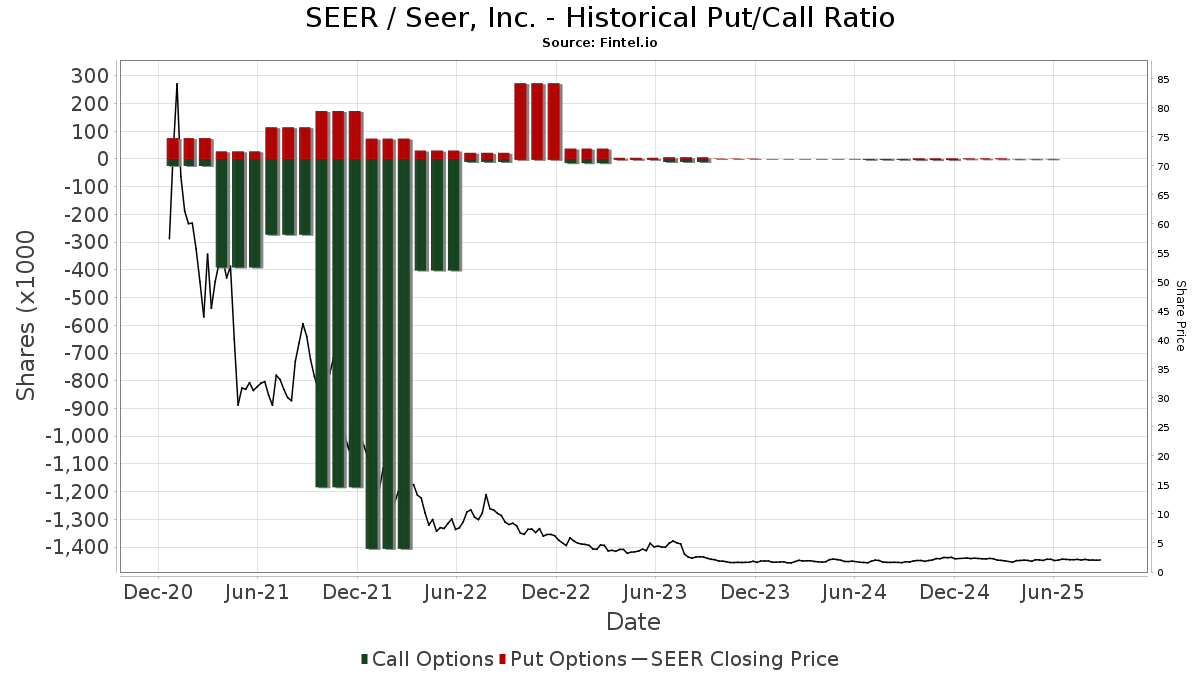
Institutionel Put/Call-forhold

Ud over at indberette standardaktie- og gældsudstedelser skal institutter med mere end 100 mill. aktiver under forvaltning også oplyse deres put- og call-optionsbeholdninger. Da salgsoptioner generelt indikerer negativ stemning, og købsoptioner indikerer positiv stemning, kan vi få en fornemmelse af den overordnede institutionelle stemning ved at plotte forholdet mellem put og kald. Diagrammet til højre viser det historiske put/call-forhold for dette instrument.

Brug af Put/Call Ratio som en indikator for investorernes stemning overvinder en af de vigtigste mangler ved at bruge totalt institutionelt ejerskab, som er, at en betydelig mængde af aktiver under forvaltning investeres passivt for at spore indekser. Passivt forvaltede fonde køber typisk ikke optioner, så indikatoren for put/call-forholdet følger mere nøje følelsen af aktivt forvaltede fonde.

SEER / Seer, Inc. Historical Put/Call Ratio
13D/G-arkivering

Vi præsenterer 13D/G ansøgninger separat fra 13F ansøgninger på grund af den forskellige behandling af SEC. 13D/G-ansøgninger kan indgives af grupper af investorer (med én ledende), hvorimod 13F-ansøgninger ikke kan. Dette resulterer i situationer, hvor en investor kan indsende en 13D/G, der rapporterer én værdi for de samlede aktier (der repræsenterer alle de aktier, der ejes af investorgruppen), men derefter indsender en 13F, der rapporterer en anden værdi for de samlede aktier (der udelukkende repræsenterer deres egne) ejendomsret). Det betyder, at aktieejerskab af 13D/G-arkiver og 13F-arkiveringer ofte ikke er direkte sammenlignelige, så vi præsenterer dem separat.

Bemærk: Fra den 16. maj 2021 viser vi ikke længere ejere, der ikke har indsendt en 13D/G inden for det seneste år. Tidligere viste vi den fulde historie af 13D/G-arkiver. Generelt skal enheder, der er forpligtet til at indgive 13D/G-ansøgninger, indgive mindst årligt, før de indsender en afsluttende ansøgning. Dog forlader fonde nogle gange positioner uden at indsende en afsluttende ansøgning (dvs. de afvikler), så visning af den fulde historie resulterede nogle gange i forvirring om det nuværende ejerskab. For at undgå forvirring viser vi nu kun 'aktuelle' ejere - det vil sige - ejere, der har anmeldt inden for det seneste år.

Upgrade to unlock premium data.

Fil dato Form Investor Forrige
Aktier
Seneste
Aktier
Δ Aktier
(Procent)
Ejendomsret
(Procent)
Δ Ejerskab
(Procent)
2026-03-02 13D/A Radoff Family Foundation 2,100,000 2,610,232 24.30 4.60 24.32
2025-08-13 13G/A Radoff Bradley Louis 4,255,000 1,399,422 -67.11 2.60 -65.79
13F og NPORT arkivering

Detaljer om 13F-arkivering er gratis. Detaljer om NP-ansøgninger kræver et premium-medlemskab. Grønne rækker angiver nye positioner. Røde rækker angiver lukkede positioner. Klik på linket ikon for at se den fulde transaktionshistorik.

Opgrader for at låse premium-data op og eksportere til Excel .

Fil dato Kilde Investor Type Gennemsnitlig pris
(Øst)
Aktier Δ Aktier
(%)
Rapporteret
Værdi
($1000)
Δ Værdi
(%)
Port Alloc
(%)
2026-02-13 13F Citigroup Inc 0 -100,00 0
2026-02-19 13F Invesco Ltd. 26.151 -67,27 48 -72,83
2026-02-10 13F Acadian Asset Management Llc 2.041.198 -4,83 4 -25,00
2025-09-25 NP DFFVX - U.S. Targeted Value Portfolio - Institutional Class This fund is a listed as child fund of Dimensional Fund Advisors Lp and if that institution has disclosed ownership in this security, then these positions will not be double counted when calculating total shares and total value 6.524 -90,79 14 -96,37
2026-02-17 13F D. E. Shaw & Co., Inc. 408.557 -30,93 748 -41,78
2026-02-12 13F Renaissance Technologies Llc 1.051.400 -5,30 1.924 -20,13
2025-09-26 NP USMIX - Extended Market Index Fund 3.154 0,41 7 0,00
2025-09-29 NP PRFZ - Invesco FTSE RAFI US 1500 Small-Mid ETF This fund is a listed as child fund of Invesco Ltd. and if that institution has disclosed ownership in this security, then these positions will not be double counted when calculating total shares and total value 129.845 -28,01 275 -23,18
2026-02-13 13F Siren, L.L.C. 4.000.000 0,00 7.320 -15,67
2025-10-08 13F/A New York State Common Retirement Fund 0 -100,00 0
2026-02-13 13F Charles Schwab Investment Management Inc 0 -100,00 0 -100,00
2026-02-19 13F CI Private Wealth, LLC 63.200 116
2026-02-03 13F Sequoia Financial Advisors, LLC 16.600 0,00 30 -16,67
2026-02-11 13F 1888 Investments, LLC 359.143 0,00 657 -15,66
2026-02-13 13F Barclays Plc 60.717 684,96 111 593,75
2026-02-17 13F Citadel Advisors Llc 11.625 -29,22 21 -40,00
2026-01-29 13F UBS Group AG 43.818 -45,42 80 -54,02
2026-02-02 13F Cornerstone Planning Group LLC 447 1.390,00 1 -100,00
2026-02-17 13F Northern Trust Corp 108.082 11,25 198 -6,19
2026-02-10 13F Goldman Sachs Group Inc 211.053 12,98 386 -4,69
2025-11-14 13F Graham Capital Management, L.P. 0 -100,00 0
2025-09-25 NP Dfa Investment Dimensions Group Inc - Va U.s. Targeted Value Portfolio This fund is a listed as child fund of Dimensional Fund Advisors Lp and if that institution has disclosed ownership in this security, then these positions will not be double counted when calculating total shares and total value 10.650 0,00 23 4,76
2025-09-25 NP DFSCX - U.s. Micro Cap Portfolio - Institutional Class This fund is a listed as child fund of Dimensional Fund Advisors Lp and if that institution has disclosed ownership in this security, then these positions will not be double counted when calculating total shares and total value 37.826 115,56 80 -9,09
2025-11-14 13F Occudo Quantitative Strategies Lp 0 -100,00 0
2026-01-15 13F Nisa Investment Advisors, Llc 23 0,00 0
2026-02-13 13F Squarepoint Ops LLC 60.884 -33,75 111 -44,22
2026-02-13 13F Pathstone Holdings, LLC 28.205 0,00 52 -16,39
2026-02-17 13F Bank Of America Corp /de/ 57.574 -2,07 105 -17,32
2026-02-17 13F Fmr Llc 703.886 -0,04 1.288 -15,71
2026-02-12 13F Jane Street Group, Llc 43.222 -6,41 79 -21,00
2025-11-14 13F Point72 (DIFC) Ltd 0 -100,00 0
2025-09-24 NP SWTSX - Schwab Total Stock Market Index Fund This fund is a listed as child fund of Charles Schwab Investment Management Inc and if that institution has disclosed ownership in this security, then these positions will not be double counted when calculating total shares and total value 17.867 0,00 38 5,71
2026-02-13 13F Jacobs Levy Equity Management, Inc 39.016 -65,34 71 -70,90
2026-02-17 13F Quadrature Capital Ltd 55.308 101
2026-02-11 13F Jpmorgan Chase & Co 134 0,00 0
2026-02-13 13F Morgan Stanley 171.368 -10,03 314 -24,21
2025-09-26 NP FOCPX - Fidelity OTC Portfolio This fund is a listed as child fund of Fmr Llc and if that institution has disclosed ownership in this security, then these positions will not be double counted when calculating total shares and total value 582.504 -0,04 1.235 6,47
2026-02-06 13F Nano Cap New Millennium Growth Fund L P 825.000 1.510
2026-02-12 13F Hrt Financial Lp 0 -100,00 0
2026-02-17 13F XTX Topco Ltd 0 -100,00 0
2025-09-26 NP FOKFX - Fidelity OTC K6 Portfolio This fund is a listed as child fund of Fmr Llc and if that institution has disclosed ownership in this security, then these positions will not be double counted when calculating total shares and total value 39.323 -1,20 83 5,06
2026-02-17 13F Advisor Group Holdings, Inc. 3.135 -2,34 6 -16,67
2026-02-17 13F Royal Bank Of Canada 71.800 -72,18 131 -76,61
2025-11-14 13F Virtu Financial LLC 0 -100,00 0
2025-11-14 13F Cubist Systematic Strategies, LLC 0 -100,00 0
2026-01-30 13F Torren Management, LLC 4.322 8
2026-02-17 13F Rangeley Capital, LLC 20.000 0,00 37 -16,28
2025-09-25 NP DFSTX - U.s. Small Cap Portfolio - Institutional Class This fund is a listed as child fund of Dimensional Fund Advisors Lp and if that institution has disclosed ownership in this security, then these positions will not be double counted when calculating total shares and total value 9.759 62,70 21 -33,33
2026-02-03 13F SBI Securities Co., Ltd. 2.395 -25,81 4 -42,86
2026-01-26 13F AE Wealth Management LLC 32.513 59
2026-01-28 13F Peapod Lane Capital LLC 438.612 0,73 803 -15,04
2026-02-10 13F Connor, Clark & Lunn Investment Management Ltd. 10.645 19
2026-01-21 13F Palumbo Wealth Management LLC 67.647 -47,55 124 -55,91
2026-02-17 13F Qube Research & Technologies Ltd 15.486 0,77 28 -15,15
2025-11-14 13F LMR Partners LLP 0 -100,00 0 -100,00
2025-09-25 NP DXUV - Dimensional US Vector Equity ETF 6.516 14
2026-02-13 13F Marshall Wace, Llp 46.701 85
2026-02-17 13F Two Sigma Advisers, Lp 462.100 -3,51 846 -18,67
2026-01-16 13F FNY Investment Advisers, LLC 8.500 0,00 0
2026-02-12 13F BlackRock, Inc. 1.827.134 -1,46 3.344 -16,90
2026-02-13 13F American Century Companies Inc 75.169 0,00 138 -15,95
2026-02-17 13F Softbank Group Corp 5.135.383 0,00 9.398 -15,67
2025-09-25 NP DFAT - Dimensional U.S. Targeted Value ETF 2.544 5
2026-02-14 13F Berkshire Asset Management Llc/pa 0 -100,00 0
2026-02-12 13F Dimensional Fund Advisors Lp 235.485 2,75 431 -13,48
2025-09-29 NP KCXIX - Knights of Columbus U.S. All Cap Index Fund I Shares 191 3,80 0
2026-02-17 13F Russell Investments Group, Ltd. 2.050 0,00 4 -25,00
2026-01-23 13F Farther Finance Advisors, LLC 36 0,00 0
2026-02-10 13F Bnp Paribas Arbitrage, Sa 662 -90,42 1 -92,86
2025-09-25 NP DFAS - Dimensional U.S. Small Cap ETF 5.831 0,00 12 0,00
2026-02-17 13F Price T Rowe Associates Inc /md/ 39.855 0,00 0
2026-02-17 13F Prelude Capital Management, Llc 44.052 -8,10 81 -23,08
2026-03-06 13F Hsbc Holdings Plc 114.348 -3,08 210 -18,60
2026-02-17 13F Tang Capital Management Llc 0 -100,00 0
2026-02-17 13F Tower Research Capital LLC (TRC) 1.831 3
2026-02-09 13F Geode Capital Management, Llc 473.040 -0,02 866 -15,69
2026-02-17 13F Point72 Asset Management, L.P. 30.231 55
2026-02-17 13F Susquehanna International Group, Llp 93.876 -23,95 172 -35,96
2026-02-17 13F Two Sigma Investments, Lp 252.647 -13,57 462 -27,13
2025-09-25 NP DFSU - Dimensional US Sustainability Core 1 ETF 11.353 24
2026-02-10 13F NINE MASTS CAPITAL Ltd 10.751 20
2026-02-10 13F AJU IB Investment Co., Ltd. 816.375 0,00 1.494 -17,24
2026-02-13 13F State Street Corp 152.082 -3,73 278 -18,71
2026-01-29 13F Vanguard Group Inc 2.187.413 -1,53 4.003 -16,97
2026-02-17 13F Millennium Management Llc 116.497 -48,24 213 -56,35
2026-02-11 13F T3 Companies, LLC 132.000 242
2026-02-11 13F Simplex Trading, Llc Call 1.000 0,00 2
2026-02-13 13F National Bank Of Canada /fi/ 0 -100,00 0
2026-02-12 13F Edgewood Management Llc 100.000 0,00 183 -15,67
2026-02-06 13F Gsa Capital Partners Llp 261.364 5,96 0
2026-02-17 13F Bridgeway Capital Management Inc 609.443 -17,36 1.115 -30,31
2026-02-17 13F Shay Capital LLC 150.331 104,33 275 72,96
Fintel data has been cited in the following publications:
Daily Mail Fox Business Business Insider Wall Street Journal The Washington Post Bloomberg Financial Times Globe and Mail
NASDAQ.com Reuters The Guardian Associated Press FactCheck.org Snopes Politifact
Federal Register The Intercept Forbes Fortune Magazine TheStreet Time Magazine Canadian Broadcasting Corporation International Business Times
Cambridge University Press Investopedia MarketWatch NY Daily News Entrepreneur Newsweek Barron's El Economista