Grundlæggende statistik
| Institutionelle ejere | 95 total, 95 long only, 0 short only, 0 long/short - change of -12,61% MRQ |
| Gennemsnitlig porteføljeallokering | 0.0287 % - change of -7,36% MRQ |
| Institutionelle aktier (lange) | 856.963 (ex 13D/G) - change of -0,12MM shares -12,25% MRQ |
| Institutionel værdi (lang) | $ 37.691 USD ($1000) |
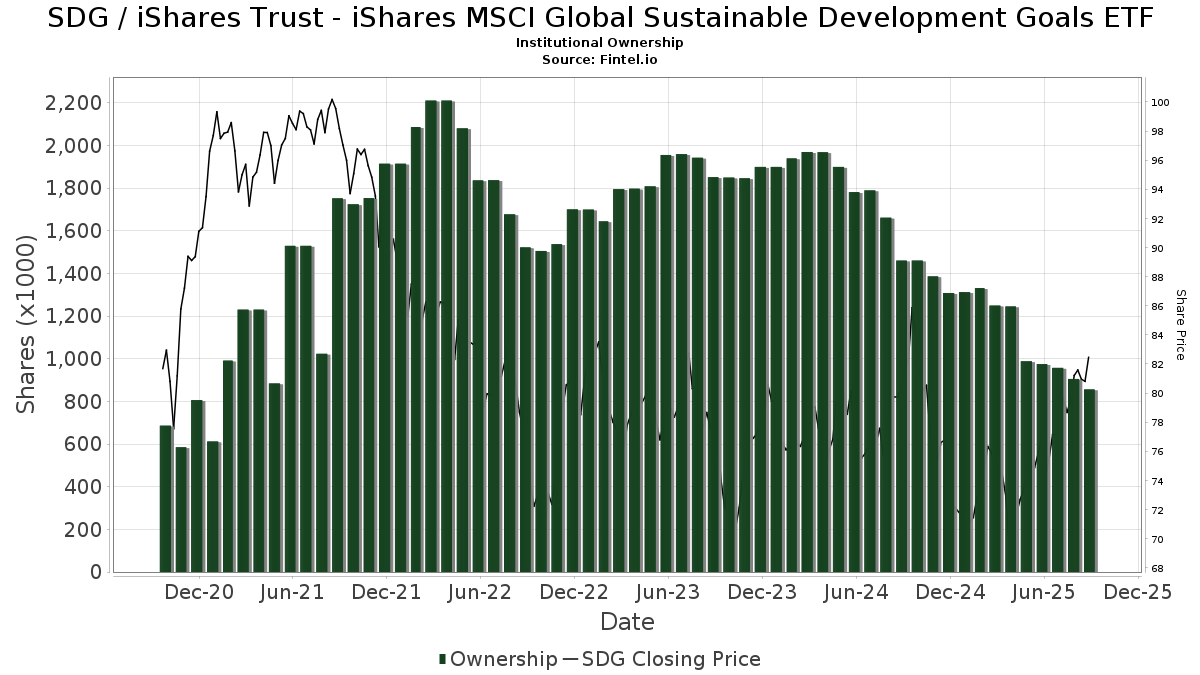
Institutionelt ejerskab og aktionærer
iShares Trust - iShares MSCI Global Sustainable Development Goals ETF (US:SDG) har 95 institutionelle ejere og aktionærer, der har indsendt 13D/G- eller 13F-formularer til Securities Exchange Commission (SEC). Disse institutioner har i alt 856,963 aktier. Største aktionærer omfatter Cwm, Llc, Flow Traders U.s. Llc, Bank Of America Corp /de/, UBS Group AG, LPL Financial LLC, Dynamic Advisor Solutions LLC, Royal Bank Of Canada, Wealth Enhancement Advisory Services, Llc, Foster Dykema Cabot & Partners, Llc, and Morgan Stanley .
iShares Trust - iShares MSCI Global Sustainable Development Goals ETF (NasdaqGM:SDG) institutionel ejerskabsstruktur viser aktuelle positioner i virksomheden efter institutioner og fonde, samt seneste ændringer i positionsstørrelse. Større aktionærer kan omfatte individuelle investorer, investeringsforeninger, hedgefonde eller institutioner. Skema 13D angiver, at investoren besidder (eller besidder) mere end 5 % af virksomheden og har til hensigt (eller har til hensigt at) aktivt at forfølge en ændring i forretningsstrategi. Skema 13G indikerer en passiv investering på over 5%.
The share price as of September 12, 2025 is 82,59 / share. Previously, on September 16, 2024, the share price was 81,63 / share. This represents an increase of 1,18% over that period.
Fondens stemningsscore
Fund Sentiment Score (fka Ownership Accumulation Score) finder de aktier, der bliver mest købt af fonde. Det er resultatet af en sofistikeret, multi-faktor kvantitativ model, der identificerer virksomheder med de højeste niveauer af institutionel akkumulering. Scoringsmodellen bruger en kombination af den samlede stigning i oplyste ejere, ændringerne i porteføljeallokeringer i disse ejere og andre målinger. Tallet går fra 0 til 100, hvor højere tal indikerer et højere niveau af akkumulering for sine jævnaldrende, og 50 er gennemsnittet.
Opdateringsfrekvens: Dagligt
Se Ownership Explorer, som giver en liste over højest rangerende virksomheder.
Institutionel Put/Call-forhold
Ud over at indberette standardaktie- og gældsudstedelser skal institutter med mere end 100 mill. aktiver under forvaltning også oplyse deres put- og call-optionsbeholdninger. Da salgsoptioner generelt indikerer negativ stemning, og købsoptioner indikerer positiv stemning, kan vi få en fornemmelse af den overordnede institutionelle stemning ved at plotte forholdet mellem put og kald. Diagrammet til højre viser det historiske put/call-forhold for dette instrument.
Brug af Put/Call Ratio som en indikator for investorernes stemning overvinder en af de vigtigste mangler ved at bruge totalt institutionelt ejerskab, som er, at en betydelig mængde af aktiver under forvaltning investeres passivt for at spore indekser. Passivt forvaltede fonde køber typisk ikke optioner, så indikatoren for put/call-forholdet følger mere nøje følelsen af aktivt forvaltede fonde.
13F og NPORT arkivering
Detaljer om 13F-arkivering er gratis. Detaljer om NP-ansøgninger kræver et premium-medlemskab. Grønne rækker angiver nye positioner. Røde rækker angiver lukkede positioner. Klik på linket ikon for at se den fulde transaktionshistorik.
Opgrader
for at låse premium-data op og eksportere til Excel ![]() .
.
| Fil dato | Kilde | Investor | Type | Gennemsnitlig pris (Øst) |
Aktier | Δ Aktier (%) |
Rapporteret Værdi ($1000) |
Δ Værdi (%) |
Port Alloc (%) |
|
|---|---|---|---|---|---|---|---|---|---|---|
| 2025-08-18 | 13F | Front Row Advisors LLC | 150 | 0,00 | 11 | 10,00 | ||||
| 2025-08-12 | 13F | Proequities, Inc. | 0 | 0 | ||||||
| 2025-08-12 | 13F | LPL Financial LLC | 26.953 | -6,05 | 2.045 | -1,54 | ||||
| 2025-08-08 | 13F | Cetera Investment Advisers | 8.069 | 5,37 | 612 | 10,47 | ||||
| 2025-08-14 | 13F | Integrated Wealth Concepts LLC | 2.996 | -6,23 | 227 | -1,73 | ||||
| 2025-08-06 | 13F | Modera Wealth Management, LLC | 11.500 | 25,00 | 872 | 31,13 | ||||
| 2025-08-14 | 13F | Sunbelt Securities, Inc. | 55 | 0,00 | 4 | 0,00 | ||||
| 2025-07-17 | 13F | Wolff Wiese Magana Llc | 8 | 1 | ||||||
| 2025-08-06 | 13F | First Horizon Advisors, Inc. | 3.236 | 0,00 | 245 | 4,70 | ||||
| 2025-08-08 | 13F | Kingsview Wealth Management, LLC | 3.040 | -23,64 | 231 | -20,14 | ||||
| 2025-04-21 | 13F | Nelson, Van Denburg & Campbell Wealth Management Group, LLC | 0 | -100,00 | 0 | |||||
| 2025-08-14 | 13F | GWM Advisors LLC | 6.637 | -42,12 | 503 | -39,40 | ||||
| 2025-05-15 | 13F | Rise Advisors, LLC | 0 | -100,00 | 0 | -100,00 | ||||
| 2025-08-14 | 13F | UBS Group AG | 33.123 | 39,85 | 2.513 | 46,56 | ||||
| 2025-07-29 | 13F | JTC Employer Solutions Trusteee Ltd | 508 | 0,00 | 0 | |||||
| 2025-08-11 | 13F | Hexagon Capital Partners LLC | 0 | -100,00 | 0 | |||||
| 2025-08-14 | 13F | Citadel Advisors Llc | 0 | -100,00 | 0 | -100,00 | ||||
| 2025-08-07 | 13F | Brio Consultants, LLC | 7.278 | 9,71 | 552 | 15,00 | ||||
| 2025-08-15 | 13F | Kestra Advisory Services, LLC | 0 | -100,00 | 0 | |||||
| 2025-07-18 | 13F | Warren Street Wealth Advisors, LLC | 4.071 | 1,07 | 309 | 5,84 | ||||
| 2025-08-01 | 13F | Centerpoint Advisors, LLC | 112 | 10,89 | 0 | |||||
| 2025-07-15 | 13F | Eaton Financial Holdings Company, LLC | 3.541 | 1,08 | 269 | 5,93 | ||||
| 2025-07-16 | 13F | Perigon Wealth Management, LLC | 6.682 | -3,50 | 507 | 1,00 | ||||
| 2025-07-28 | 13F | Harbour Investments, Inc. | 10 | -96,03 | 1 | -100,00 | ||||
| 2025-08-11 | 13F | Aptus Capital Advisors, LLC | 118 | 0,00 | 9 | 0,00 | ||||
| 2025-08-07 | 13F | Allworth Financial LP | 4.887 | 0,00 | 371 | 5,11 | ||||
| 2025-07-15 | 13F | Highland Financial Advisors, LLC | 0 | -100,00 | 0 | |||||
| 2025-07-22 | 13F | Mascoma Wealth Management LLC | 0 | -100,00 | 0 | |||||
| 2025-07-31 | 13F | Richards, Merrill & Peterson, Inc. | 0 | -100,00 | 0 | |||||
| 2025-08-07 | 13F | Weil Company, Inc. | 8.624 | -3,13 | 654 | 1,55 | ||||
| 2025-08-05 | 13F | Cherry Tree Wealth Management, LLC | 148 | 0,00 | 11 | 10,00 | ||||
| 2025-08-06 | 13F | Commonwealth Equity Services, Llc | 8.918 | -10,92 | 1 | |||||
| 2025-07-31 | 13F | Brinker Capital Investments, LLC | 0 | -100,00 | 0 | |||||
| 2025-08-01 | 13F | First Command Advisory Services, Inc. | 0 | 0 | ||||||
| 2025-08-14 | 13F | Federation des caisses Desjardins du Quebec | 39 | -91,68 | 3 | -93,94 | ||||
| 2025-08-08 | 13F | Tanglewood Legacy Advisors, LLC | 950 | 0,00 | 72 | 5,88 | ||||
| 2025-08-14 | 13F | Colony Group, LLC | 13.054 | 78,87 | 990 | 87,50 | ||||
| 2025-04-24 | 13F | Wingate Wealth Advisors, Inc. | 0 | -100,00 | 0 | |||||
| 2025-07-11 | 13F | Farther Finance Advisors, LLC | 4.301 | -1,04 | 326 | 3,49 | ||||
| 2025-08-12 | 13F | Steward Partners Investment Advisory, Llc | 413 | 3,25 | 31 | 10,71 | ||||
| 2025-07-11 | 13F | Bond & Devick Financial Network, Inc. | 3.153 | 0,00 | 239 | 4,82 | ||||
| 2025-08-14 | 13F | Raymond James Financial Inc | 2.527 | -20,26 | 192 | -16,59 | ||||
| 2025-08-28 | 13F/A | Tolleson Wealth Management, Inc. | 8.980 | 0,00 | 681 | 4,77 | ||||
| 2025-07-24 | 13F | Financial Connections Group, Inc. | 100 | 0,00 | 0 | |||||
| 2025-08-05 | 13F | Harel Insurance Investments & Financial Services Ltd. | 14.842 | 41,47 | 1 | |||||
| 2025-08-12 | 13F | Coldstream Capital Management Inc | 0 | -100,00 | 0 | |||||
| 2025-08-15 | 13F | Morgan Stanley | 15.696 | 18,95 | 1.191 | 24,61 | ||||
| 2025-07-31 | 13F | Wealthfront Advisers Llc | 0 | -100,00 | 0 | |||||
| 2025-08-13 | 13F | KilterHowling LLC | 4.401 | 1,06 | 334 | 4,72 | ||||
| 2025-07-25 | 13F | LRI Investments, LLC | 74 | 0,00 | 6 | 0,00 | ||||
| 2025-07-31 | 13F | Money Design Co.,Ltd. | 13.435 | -0,24 | 1 | |||||
| 2025-08-14 | 13F | Evergreen Wealth Solutions, LLC | 7.425 | -0,34 | 563 | 4,45 | ||||
| 2025-07-31 | 13F | Oppenheimer Asset Management Inc. | 3.989 | -0,57 | 303 | 4,14 | ||||
| 2025-07-31 | 13F | CVA Family Office, LLC | 653 | 4,48 | 50 | 8,89 | ||||
| 2025-07-25 | 13F | Concord Wealth Partners | 32 | -79,49 | 2 | -81,82 | ||||
| 2025-08-14 | 13F | Jane Street Group, Llc | 7.364 | -60,18 | 559 | -58,30 | ||||
| 2025-07-31 | 13F | Cambridge Investment Research Advisors, Inc. | 3.948 | -10,76 | 0 | |||||
| 2025-08-13 | 13F | Capital Analysts, Inc. | 259 | 0,00 | 0 | |||||
| 2025-08-05 | 13F | Bank Of Montreal /can/ | 835 | 0,00 | 63 | 5,00 | ||||
| 2025-07-10 | 13F | Wealth Enhancement Advisory Services, Llc | 23.519 | -11,94 | 1.821 | -5,79 | ||||
| 2025-07-09 | 13F | Dynamic Advisor Solutions LLC | 26.612 | -15,46 | 2.019 | -11,41 | ||||
| 2025-08-08 | 13F | Larson Financial Group LLC | 6.834 | 14,51 | 518 | 19,91 | ||||
| 2025-08-11 | 13F | Birchbrook, Inc. | 806 | -1,59 | 61 | 3,39 | ||||
| 2025-08-13 | 13F | Townsquare Capital Llc | 0 | -100,00 | 0 | |||||
| 2025-08-05 | 13F | Huntington National Bank | 0 | |||||||
| 2025-08-18 | 13F/A | National Bank Of Canada /fi/ | 124 | 9,73 | 9 | 12,50 | ||||
| 2025-08-07 | 13F/A | Joseph Group Capital Management | 126 | 0,00 | 10 | 0,00 | ||||
| 2025-08-14 | 13F | Hurley Capital, LLC | 87 | 0,00 | 7 | 0,00 | ||||
| 2025-08-01 | 13F | Rossby Financial, LCC | 175 | 0,00 | 13 | 8,33 | ||||
| 2025-07-29 | 13F | Aspiriant, Llc | 10.180 | -67,86 | 772 | -66,33 | ||||
| 2025-08-12 | 13F | MAI Capital Management | 0 | -100,00 | 0 | |||||
| 2025-08-13 | 13F | Flow Traders U.s. Llc | 78.764 | -1,25 | 6 | 0,00 | ||||
| 2025-07-25 | 13F | Cwm, Llc | 233.752 | -0,19 | 18 | 6,25 | ||||
| 2025-07-22 | 13F | 4Thought Financial Group Inc. | 153 | 98,70 | 12 | 120,00 | ||||
| 2025-07-08 | 13F | Granite Bay Wealth Management, LLC | 3.000 | -9,09 | 0 | |||||
| 2025-07-15 | 13F | Regatta Capital Group, Llc | 7.863 | -3,80 | 596 | 0,85 | ||||
| 2025-07-16 | 13F | ORG Partners LLC | 169 | 0,00 | 13 | 0,00 | ||||
| 2025-04-23 | 13F | Spire Wealth Management | 0 | -100,00 | 0 | |||||
| 2025-08-06 | 13F | Nvwm, Llc | 60 | 0,00 | 5 | 0,00 | ||||
| 2025-04-22 | 13F/A | NorthRock Partners, LLC | 0 | -100,00 | 0 | -100,00 | ||||
| 2025-07-09 | 13F | Berkshire Bank | 13.136 | -2,56 | 996 | 2,15 | ||||
| 2025-07-17 | 13F | Halbert Hargrove Global Advisors, Llc | 7.319 | -0,29 | 555 | 4,52 | ||||
| 2025-08-11 | 13F | Citigroup Inc | 8.738 | 0,26 | 663 | 5,08 | ||||
| 2025-07-23 | 13F | Vontobel Holding Ltd. | 8.156 | 0,00 | 619 | 4,75 | ||||
| 2025-08-08 | 13F | Pnc Financial Services Group, Inc. | 6.288 | -1,01 | 477 | 3,92 | ||||
| 2025-08-14 | 13F | Wells Fargo & Company/mn | 0 | 0 | ||||||
| 2025-09-04 | 13F/A | Advisor Group Holdings, Inc. | 3.728 | -32,82 | 282 | -29,68 | ||||
| 2025-07-31 | 13F | WFA Asset Management Corp | 1.055 | -85,43 | 79 | -86,14 | ||||
| 2025-08-14 | 13F | Royal Bank Of Canada | 26.442 | -20,08 | 2.006 | -16,24 | ||||
| 2025-08-13 | 13F | Northwestern Mutual Wealth Management Co | 1.242 | 0,49 | 94 | 5,62 | ||||
| 2025-08-12 | 13F | Tradition Wealth Management, LLC | 4.735 | -0,50 | 359 | 4,36 | ||||
| 2025-08-14 | 13F | Mariner, LLC | 5.045 | -40,76 | 383 | -37,99 | ||||
| 2025-08-14 | 13F | Financial Advisory Service, Inc. | 16 | 0,00 | 1 | 0,00 | ||||
| 2025-08-18 | 13F | Geneos Wealth Management Inc. | 25 | 0,00 | 2 | 0,00 | ||||
| 2025-08-04 | 13F | Assetmark, Inc | 1.313 | -5,88 | 100 | -1,00 | ||||
| 2025-05-15 | 13F | Tower Research Capital LLC (TRC) | 0 | -100,00 | 0 | |||||
| 2025-08-12 | 13F | Foster Dykema Cabot & Partners, Llc | 21.677 | -0,02 | 1.644 | 4,78 | ||||
| 2025-04-23 | 13F | Security National Bank | 0 | -100,00 | 0 | |||||
| 2025-08-05 | 13F | Claro Advisors LLC | 5.771 | -11,01 | 438 | -6,82 | ||||
| 2025-08-08 | 13F | Gts Securities Llc | 3.314 | -46,47 | 251 | -43,97 | ||||
| 2025-07-21 | 13F | Ameriflex Group, Inc. | 183 | 1,10 | 14 | 0,00 | ||||
| 2025-04-15 | 13F | Leonard Rickey Investment Advisors P.L.L.C. | 0 | -100,00 | 0 | |||||
| 2025-07-17 | 13F | Janney Montgomery Scott LLC | 2.713 | 0 | ||||||
| 2025-07-24 | 13F | Us Bancorp \de\ | 5.000 | 0,00 | 379 | 4,99 | ||||
| 2025-07-30 | 13F | Financial Perspectives, Inc | 640 | 1,11 | 49 | 6,67 | ||||
| 2025-08-07 | 13F | LFA - Lugano Financial Advisors SA | 1.810 | 0,00 | 137 | 4,58 | ||||
| 2025-08-11 | 13F | Plum Street Advisors, LLC | 5.159 | -7,48 | 391 | -2,98 | ||||
| 2025-08-12 | 13F | Global Retirement Partners, LLC | 0 | -100,00 | 0 | |||||
| 2025-08-13 | 13F | Congress Wealth Management LLC / DE / | 7.575 | 16,11 | 575 | 21,61 | ||||
| 2025-08-01 | 13F | Envestnet Asset Management Inc | 8.153 | -4,30 | 618 | 0,32 | ||||
| 2025-07-16 | 13F | Paragon Capital Management Ltd | 0 | -100,00 | 0 | |||||
| 2025-08-05 | 13F | Mission Wealth Management, Lp | 0 | -100,00 | 0 | -100,00 | ||||
| 2025-05-13 | 13F | Rathbone Brothers plc | 0 | -100,00 | 0 | |||||
| 2025-08-14 | 13F | Susquehanna International Group, Llp | 0 | -100,00 | 0 | |||||
| 2025-07-18 | 13F | PFG Investments, LLC | 2.700 | -5,33 | 205 | -0,97 | ||||
| 2025-08-05 | 13F | Dunhill Financial, LLC | 762 | -3,30 | 58 | 0,00 | ||||
| 2025-08-12 | 13F | O'shaughnessy Asset Management, Llc | 1 | 0,00 | 0 | |||||
| 2025-08-06 | 13F | AE Wealth Management LLC | 408 | 1,75 | 31 | 3,45 | ||||
| 2025-07-21 | 13F | Ameritas Advisory Services, LLC | 641 | -84,40 | 49 | -83,84 | ||||
| 2025-08-08 | 13F | Creative Planning | 5.866 | 14,32 | 445 | 19,68 | ||||
| 2025-05-14 | 13F | Hsbc Holdings Plc | 0 | -100,00 | 0 | |||||
| 2025-08-14 | 13F | C M Bidwell & Associates Ltd | 266 | 0,00 | 20 | 5,26 | ||||
| 2025-08-14 | 13F | Bank Of America Corp /de/ | 56.782 | 14,05 | 4.307 | 19,54 | ||||
| 2025-05-16 | 13F | Signature Estate & Investment Advisors Llc | 0 | -100,00 | 0 | |||||
| 2025-08-14 | 13F | Fmr Llc | 0 | -100,00 | 0 | |||||
| 2025-08-13 | 13F | Jones Financial Companies Lllp | 946 | 117,47 | 71 | 129,03 | ||||
| 2025-04-28 | 13F | Fedenia Advisers LLC | 0 | -100,00 | 0 |
Other Listings
| MX:SDG |