Grundlæggende statistik
| Institutionelle ejere | 117 total, 117 long only, 0 short only, 0 long/short - change of 2,59% MRQ |
| Gennemsnitlig porteføljeallokering | 0.0753 % - change of -35,58% MRQ |
| Institutionelle aktier (lange) | 5.915.486 (ex 13D/G) - change of -0,46MM shares -7,21% MRQ |
| Institutionel værdi (lang) | $ 162.812 USD ($1000) |
Institutionelt ejerskab og aktionærer
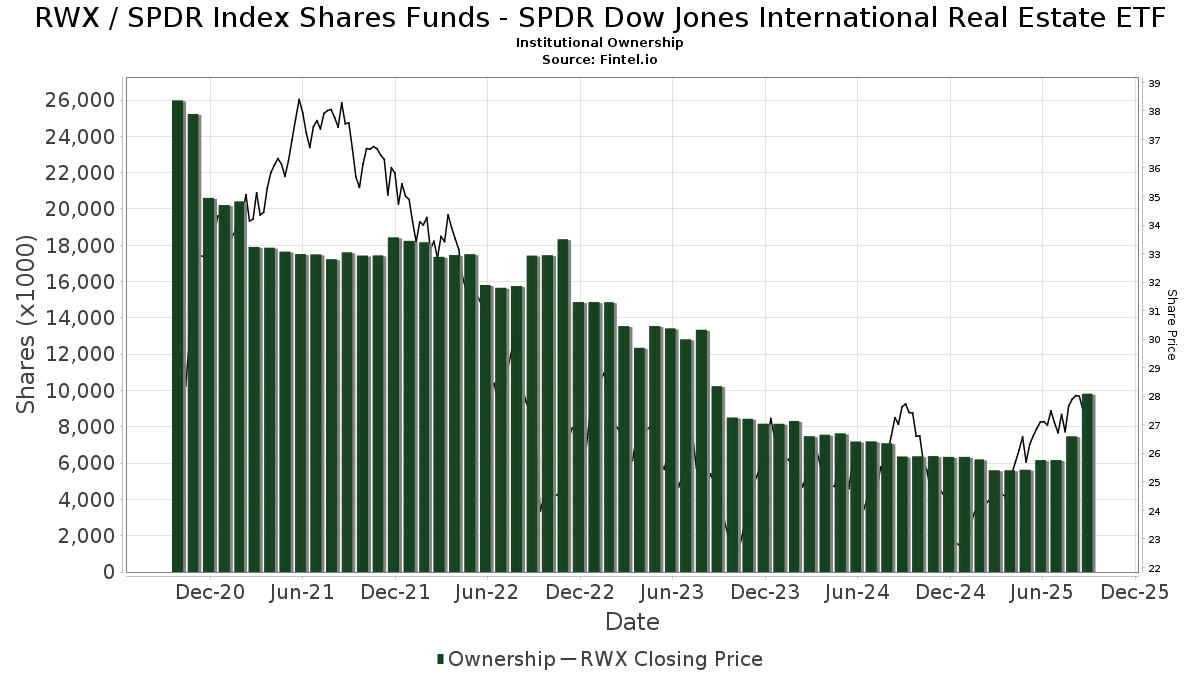
SPDR Index Shares Funds - State Street SPDR Dow Jones International Real Estate ETF (US:RWX) har 117 institutionelle ejere og aktionærer, der har indsendt 13D/G- eller 13F-formularer til Securities Exchange Commission (SEC). Disse institutioner har i alt 5,915,486 aktier. Største aktionærer omfatter Osborne Partners Capital Management, Llc, Morgan Stanley, State Street Corp, Northern Trust Corp, Baker Avenue Asset Management, LP, Wells Fargo & Company/mn, Jane Street Group, Llc, Awm Capital, Llc, Idaho Trust Bank, and Risk Paradigm Group, LLC .
SPDR Index Shares Funds - State Street SPDR Dow Jones International Real Estate ETF (ARCA:RWX) institutionel ejerskabsstruktur viser aktuelle positioner i virksomheden efter institutioner og fonde, samt seneste ændringer i positionsstørrelse. Større aktionærer kan omfatte individuelle investorer, investeringsforeninger, hedgefonde eller institutioner. Skema 13D angiver, at investoren besidder (eller besidder) mere end 5 % af virksomheden og har til hensigt (eller har til hensigt at) aktivt at forfølge en ændring i forretningsstrategi. Skema 13G indikerer en passiv investering på over 5%.
The share price as of April 24, 2026 is 28,24 / share. Previously, on April 28, 2025, the share price was 26,06 / share. This represents an increase of 8,37% over that period.
Fondens stemningsscore
Fund Sentiment Score (fka Ownership Accumulation Score) finder de aktier, der bliver mest købt af fonde. Det er resultatet af en sofistikeret, multi-faktor kvantitativ model, der identificerer virksomheder med de højeste niveauer af institutionel akkumulering. Scoringsmodellen bruger en kombination af den samlede stigning i oplyste ejere, ændringerne i porteføljeallokeringer i disse ejere og andre målinger. Tallet går fra 0 til 100, hvor højere tal indikerer et højere niveau af akkumulering for sine jævnaldrende, og 50 er gennemsnittet.
Opdateringsfrekvens: Dagligt
Se Ownership Explorer, som giver en liste over højest rangerende virksomheder.
AI+ Ask Fintel’s AI assistant about SPDR Index Shares Funds - State Street SPDR Dow Jones International Real Estate ETF.
Select a question to share a public post with an AI-crafted answer.
Thinking of good questions…
Institutionel Put/Call-forhold
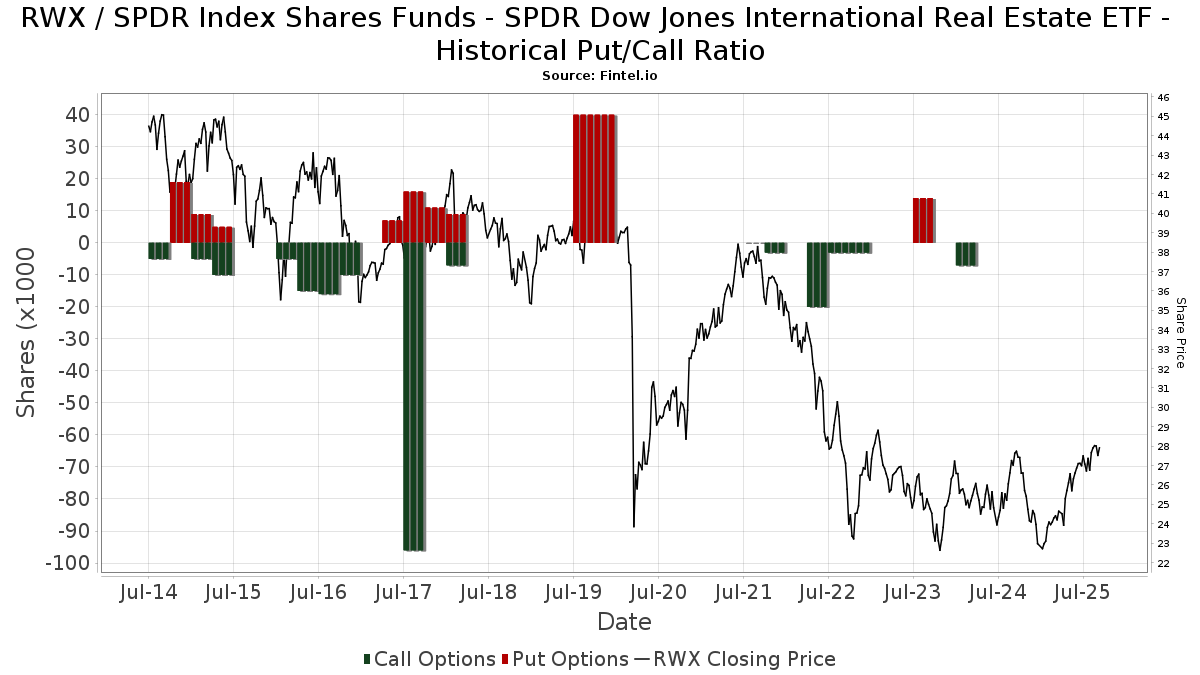
Ud over at indberette standardaktie- og gældsudstedelser skal institutter med mere end 100 mill. aktiver under forvaltning også oplyse deres put- og call-optionsbeholdninger. Da salgsoptioner generelt indikerer negativ stemning, og købsoptioner indikerer positiv stemning, kan vi få en fornemmelse af den overordnede institutionelle stemning ved at plotte forholdet mellem put og kald. Diagrammet til højre viser det historiske put/call-forhold for dette instrument.
Brug af Put/Call Ratio som en indikator for investorernes stemning overvinder en af de vigtigste mangler ved at bruge totalt institutionelt ejerskab, som er, at en betydelig mængde af aktiver under forvaltning investeres passivt for at spore indekser. Passivt forvaltede fonde køber typisk ikke optioner, så indikatoren for put/call-forholdet følger mere nøje følelsen af aktivt forvaltede fonde.
13F og NPORT arkivering
Detaljer om 13F-arkivering er gratis. Detaljer om NP-ansøgninger kræver et premium-medlemskab. Grønne rækker angiver nye positioner. Røde rækker angiver lukkede positioner. Klik på linket ikon for at se den fulde transaktionshistorik.
Opgrader
for at låse premium-data op og eksportere til Excel ![]() .
.
| Fil dato | Kilde | Investor | Type | Gennemsnitlig pris (Øst) |
Aktier | Δ Aktier (%) |
Rapporteret Værdi ($1000) |
Δ Værdi (%) |
Port Alloc (%) |
|
|---|---|---|---|---|---|---|---|---|---|---|
| 2025-11-06 | 13F | Savvy Advisors, Inc. | 0 | -100,00 | 0 | -100,00 | ||||
| 2026-04-14 | 13F | Moisand Fitzgerald Tamayo, LLC | 311 | 0,65 | 8 | 0,00 | ||||
| 2026-02-13 | 13F | Pacific Center for Financial Services | 47 | 0,00 | 1 | 0,00 | ||||
| 2026-02-17 | 13F | Private Advisor Group, LLC | 11.041 | -16,63 | 309 | -16,03 | ||||
| 2026-04-22 | 13F | Smallwood Wealth Investment Management, LLC | 134 | 0,00 | 4 | 0,00 | ||||
| 2026-02-10 | 13F | Evolution Wealth Management Inc. | 342 | 242,00 | 10 | 350,00 | ||||
| 2025-10-30 | 13F | DiMeo Schneider & Associates, L.L.C. | 0 | -100,00 | 0 | -100,00 | ||||
| 2026-02-03 | 13F | Ballentine Partners, LLC | 60.710 | -32,79 | 1.700 | -32,36 | ||||
| 2026-02-17 | 13F | Cape Investment Advisory, Inc. | 198 | 6 | ||||||
| 2025-11-13 | 13F | GeoWealth Management, LLC | 0 | -100,00 | 0 | |||||
| 2025-11-12 | 13F | Harbour Investments, Inc. | 0 | -100,00 | 0 | -100,00 | ||||
| 2026-01-20 | 13F | Aspiriant, Llc | 11.657 | 0,00 | 326 | 0,62 | ||||
| 2026-02-06 | 13F | EverSource Wealth Advisors, LLC | 525 | 0,00 | 15 | 0,00 | ||||
| 2026-02-13 | 13F | SRS Capital Advisors, Inc. | 33 | 1 | ||||||
| 2026-04-09 | 13F | Aletheian Wealth Advisors LLC | 25.546 | -17,12 | 680 | -20,65 | ||||
| 2025-12-02 | 13F | IFP Advisors, Inc | 0 | -100,00 | 0 | -100,00 | ||||
| 2026-01-29 | 13F | Camelot Portfolios, LLC | 546 | 15 | ||||||
| 2026-01-26 | 13F | AE Wealth Management LLC | 53 | -33,75 | 1 | -50,00 | ||||
| 2026-02-13 | 13F | Umb Bank N A/mo | 424 | 12 | ||||||
| 2026-02-17 | 13F | Consultiva Wealth Management, Corp. | 450 | 0,00 | 13 | 0,00 | ||||
| 2026-02-17 | 13F | Blair William & Co/il | 434 | -40,47 | 12 | -40,00 | ||||
| 2025-11-06 | 13F | Ameritas Advisory Services, LLC | 0 | -100,00 | 0 | -100,00 | ||||
| 2026-02-13 | 13F | Wells Fargo & Company/mn | 281.584 | -2,34 | 7.884 | -1,67 | ||||
| 2026-02-10 | 13F | Private Wealth Asset Management, LLC | 219 | 0,00 | 6 | 0,00 | ||||
| 2026-04-22 | 13F | Pinnacle Bancorp, Inc. | 1.000 | 0,00 | 27 | -7,14 | ||||
| 2026-04-23 | 13F | Kohmann Bosshard Financial Services, LLC | 1.009 | 0,00 | 27 | -7,14 | ||||
| 2026-04-08 | 13F | Wealth Enhancement Advisory Services, Llc | 10.926 | -53,50 | 295 | -55,66 | ||||
| 2026-01-27 | 13F | Osborne Partners Capital Management, Llc | 1.148.055 | -1,62 | 32.146 | -0,95 | ||||
| 2026-01-30 | 13F | Jackson Hole Capital Partners, LLC | 200 | 0,50 | 6 | 0,00 | ||||
| 2025-10-29 | 13F | Aspire Private Capital, LLC | 42.411 | 0,00 | 1.162 | 0,00 | ||||
| 2026-02-12 | 13F | Schoolcraft Capital LLC | 92.116 | 3,67 | 2.579 | 4,41 | ||||
| 2026-04-22 | 13F | Motco | 242 | 0,00 | 6 | 0,00 | ||||
| 2026-02-12 | 13F | Gould Capital, LLC | 0 | -100,00 | 0 | |||||
| 2026-04-03 | 13F | Investors Research Corp | 17.903 | -5,96 | 477 | -10,69 | ||||
| 2026-01-23 | 13F | Halbert Hargrove Global Advisors, Llc | 0 | -100,00 | 0 | -100,00 | ||||
| 2026-02-11 | 13F | Parallel Advisors, LLC | 11.760 | 329 | ||||||
| 2025-11-14 | 13F | Cetera Investment Advisers | 0 | -100,00 | 0 | |||||
| 2026-02-13 | 13F | National Bank Of Canada /fi/ | 0 | -100,00 | 0 | -100,00 | ||||
| 2025-11-12 | 13F | Transce3nd, LLC | 0 | -100,00 | 0 | -100,00 | ||||
| 2026-02-13 | 13F | Barclays Plc | 600 | 17 | ||||||
| 2026-04-24 | 13F | Innova Wealth Partners | 20.654 | -75,64 | 550 | -76,86 | ||||
| 2026-01-22 | 13F | Richardson Financial Services Inc. | 2.349 | -1,30 | 66 | -1,52 | ||||
| 2026-04-20 | 13F | MBM Wealth Consultants, LLC | 707 | 19 | ||||||
| 2025-11-12 | 13F | NewSquare Capital LLC | 0 | -100,00 | 0 | -100,00 | ||||
| 2026-02-06 | 13F | Cullen/frost Bankers, Inc. | 617 | 0,00 | 17 | 0,00 | ||||
| 2025-11-14 | 13F | CI Private Wealth, LLC | 0 | -100,00 | 0 | -100,00 | ||||
| 2026-02-13 | 13F/A | New England Private Wealth Advisors LLC | 24.219 | 0,97 | 678 | 1,65 | ||||
| 2026-04-16 | 13F | Lexington Hill Partners, LLC | 12.436 | 0,70 | 331 | -4,06 | ||||
| 2026-04-23 | 13F | Farmers & Merchants Investments Inc | 539 | 0,00 | 14 | -6,67 | ||||
| 2026-02-13 | 13F | Citigroup Inc | 2.391 | -5,94 | 67 | -5,71 | ||||
| 2026-01-26 | 13F | Cwm, Llc | 0 | -100,00 | 0 | |||||
| 2026-02-05 | 13F | Florin Court Capital LLP | 0 | -100,00 | 0 | |||||
| 2026-04-07 | 13F | CoreCap Advisors, LLC | 0 | -100,00 | 0 | |||||
| 2026-04-07 | 13F | Eastern Bank | 5.000 | 0,00 | 133 | -5,00 | ||||
| 2026-02-17 | 13F | Mercer Global Advisors Inc /adv | 16.116 | 22,04 | 451 | 22,89 | ||||
| 2026-02-10 | 13F | Savant Capital, LLC | 21.674 | -9,82 | 607 | -9,28 | ||||
| 2026-02-17 | 13F | Royal Bank Of Canada | 19.341 | -7,78 | 542 | -7,19 | ||||
| 2026-02-20 | 13F | Sunbelt Securities, Inc. | 115 | 0,00 | 3 | 0,00 | ||||
| 2026-02-12 | 13F | CIBC Private Wealth Group, LLC | 1.140 | 41,61 | 32 | 40,91 | ||||
| 2025-11-13 | 13F | Change Path, LLC | 0 | -100,00 | 0 | |||||
| 2026-02-06 | 13F | Copia Wealth Management | 23 | 0,00 | 1 | |||||
| 2025-11-13 | 13F | Novus Advisors, Llc | 0 | -100,00 | 0 | -100,00 | ||||
| 2025-11-14 | 13F | Goldman Sachs Group Inc | 0 | -100,00 | 0 | |||||
| 2026-02-12 | 13F | RPg Family Wealth Advisory, LLC | 86.882 | -1,21 | 2.433 | -0,53 | ||||
| 2026-04-07 | 13F | Farther Finance Advisors, LLC | 142 | -9,55 | 4 | -25,00 | ||||
| 2026-02-13 | 13F | Morgan Stanley | 827.651 | -0,67 | 23.174 | 0,01 | ||||
| 2026-02-17 | 13F | Tower Research Capital LLC (TRC) | 6 | -40,00 | 0 | |||||
| 2026-02-17 | 13F | Fmr Llc | 4 | 0,00 | 0 | |||||
| 2025-11-07 | 13F | HighTower Advisors, LLC | 0 | -100,00 | 0 | -100,00 | ||||
| 2026-04-21 | 13F | Merkkuri Wealth Advisors LLC | 0 | 0 | ||||||
| 2026-02-10 | 13F/A | Northwestern Mutual Wealth Management Co | 6.962 | -4,21 | 195 | -3,96 | ||||
| 2026-01-23 | 13F | Assetmark, Inc | 90.366 | 0,02 | 2.530 | 0,72 | ||||
| 2025-11-13 | 13F | Richard W. Paul & Associates, LLC | 0 | -100,00 | 0 | |||||
| 2026-02-17 | 13F | D. E. Shaw & Co., Inc. | 7.893 | 0,00 | 221 | 0,91 | ||||
| 2026-04-13 | 13F | Creative Financial Designs Inc /adv | 59 | -4,84 | 2 | 0,00 | ||||
| 2026-02-09 | 13F | Frazier Financial Advisors, LLC | 22 | 0,00 | 1 | |||||
| 2026-01-29 | 13F | Comerica Bank | 12.436 | -1,21 | 348 | -0,57 | ||||
| 2026-01-21 | 13F | Raleigh Capital Management Inc. | 1 | 0,00 | 0 | |||||
| 2026-02-17 | 13F | Ameriprise Financial Inc | 10.184 | 10,05 | 285 | 10,89 | ||||
| 2026-02-17 | 13F | Risk Paradigm Group, LLC | 93.257 | 2.611 | ||||||
| 2026-02-17 | 13F | Advisor Group Holdings, Inc. | 3.173 | -90,89 | 89 | -90,92 | ||||
| 2026-02-18 | 13F | GWM Advisors LLC | 4 | -97,67 | 0 | -100,00 | ||||
| 2026-02-13 | 13F | Kestra Advisory Services, LLC | 0 | -100,00 | 0 | |||||
| 2026-02-05 | 13F | Mission Wealth Management, Lp | 17.083 | -7,09 | 478 | -6,46 | ||||
| 2026-01-20 | 13F | Maryland Capital Advisors Inc. | 14.837 | -0,98 | 415 | -0,24 | ||||
| 2026-02-02 | 13F | Mutual Advisors, LLC | 32.900 | -1,50 | 921 | -2,64 | ||||
| 2025-11-14 | 13F | Logan Stone Capital, LLC | 0 | -100,00 | 0 | -100,00 | ||||
| 2026-04-20 | 13F | Hilton Head Capital Partners, LLC | 19 | 0,00 | 1 | |||||
| 2026-01-12 | 13F | Salem Investment Counselors Inc | 0 | -100,00 | 0 | |||||
| 2026-01-23 | 13F | Westside Investment Management, Inc. | 12 | 0,00 | 0 | |||||
| 2026-02-11 | 13F | LPL Financial LLC | 23.676 | -65,20 | 663 | -65,01 | ||||
| 2026-02-05 | 13F | Idaho Trust Bank | 106.954 | -4,91 | 2.995 | -4,22 | ||||
| 2026-02-03 | 13F | SBI Securities Co., Ltd. | 7.278 | 1,07 | 204 | 1,50 | ||||
| 2026-01-16 | 13F | Empirical Financial Services, LLC d.b.a. Empirical Wealth Management | 7.914 | 0,01 | 222 | 0,45 | ||||
| 2026-01-28 | 13F | Salomon & Ludwin, LLC | 27 | 0,00 | 1 | |||||
| 2026-02-13 | 13F | State Street Corp | 774.013 | 0,00 | 21.672 | 0,68 | ||||
| 2026-02-11 | 13F | Jpmorgan Chase & Co | 3.227 | -8,79 | 90 | -8,16 | ||||
| 2026-01-26 | 13F | Private Trust Co Na | 632 | 0,00 | 18 | 0,00 | ||||
| 2026-01-29 | 13F | Quest 10 Wealth Builders, Inc. | 60 | 0,00 | 2 | 0,00 | ||||
| 2025-11-05 | 13F | Envestnet Asset Management Inc | 0 | -100,00 | 0 | |||||
| 2025-10-30 | 13F | Envestnet Portfolio Solutions, Inc. | 0 | -100,00 | 0 | -100,00 | ||||
| 2025-10-30 | 13F | Covestor Ltd | 0 | -100,00 | 0 | |||||
| 2026-02-13 | 13F | Pin Oak Investment Advisors Inc | 47 | 0,00 | 0 | -100,00 | ||||
| 2026-02-13 | 13F | Colony Group, LLC | 14.369 | 9,81 | 402 | 10,74 | ||||
| 2026-02-06 | 13F | Global Retirement Partners, LLC | 26 | -92,61 | 1 | -100,00 | ||||
| 2026-02-12 | 13F | Beacon Capital Management, Inc. | 395 | -0,25 | 11 | 0,00 | ||||
| 2026-02-17 | 13F | Old Mission Capital Llc | 0 | -100,00 | 0 | |||||
| 2026-01-29 | 13F | Quent Capital, LLC | 175 | 0,00 | 5 | 0,00 | ||||
| 2026-01-30 | 13F | Us Bancorp \de\ | 6.834 | -5,74 | 191 | -4,98 | ||||
| 2025-11-12 | 13F | Bellwether Advisors, LLC | 0 | -100,00 | 0 | -100,00 | ||||
| 2026-04-13 | 13F | Mather Group, Llc. | 157 | 4 | ||||||
| 2026-01-29 | 13F | Sanctuary Advisors, LLC | 11.912 | 0,00 | 334 | 0,60 | ||||
| 2026-02-10 | 13F | Baker Avenue Asset Management, LP | 379.759 | 8,31 | 10.633 | 9,05 | ||||
| 2026-04-22 | 13F | Spire Wealth Management | 8.639 | -15,81 | 230 | -20,21 | ||||
| 2026-02-13 | 13F | Bank Of Nova Scotia | 7.155 | 201 | ||||||
| 2026-02-17 | 13F | Advisory Services Network, LLC | 0 | -100,00 | 0 | -100,00 | ||||
| 2026-01-28 | 13F | Geneos Wealth Management Inc. | 897 | 0,00 | 25 | 4,17 | ||||
| 2026-02-17 | 13F | Jones Financial Companies Lllp | 396 | -19,35 | 11 | -15,38 | ||||
| 2025-11-12 | 13F | Cambridge Investment Research Advisors, Inc. | 0 | -100,00 | 0 | |||||
| 2026-01-21 | 13F | Capital Investment Advisory Services, LLC | 528 | 0,00 | 15 | 0,00 | ||||
| 2026-02-02 | 13F | Fifth Third Bancorp | 2.119 | 0,00 | 59 | 1,72 | ||||
| 2026-01-26 | 13F | Valmark Advisers, Inc. | 11.631 | -23,39 | 326 | -22,99 | ||||
| 2026-02-11 | 13F | Franklin Resources Inc | 184 | 0,00 | 5 | 0,00 | ||||
| 2025-11-14 | 13F | Raymond James Financial Inc | 0 | -100,00 | 0 | |||||
| 2026-02-17 | 13F | Fairview Capital Investment Management, Llc | 11.660 | -38,18 | 326 | -37,79 | ||||
| 2026-02-17 | 13F | Awm Capital, Llc | 133.847 | -3,66 | 3.748 | -3,00 | ||||
| 2026-04-23 | 13F | Bridge Generations Wealth Management Llc | 0 | -100,00 | 0 | |||||
| 2026-02-17 | 13F | Bank Of America Corp /de/ | 88.365 | 21,23 | 2.474 | 22,05 | ||||
| 2026-02-12 | 13F | Jane Street Group, Llc | 188.460 | 83,06 | 5.277 | 84,28 | ||||
| 2026-02-17 | 13F | Qube Research & Technologies Ltd | 427 | -23,20 | 12 | -26,67 | ||||
| 2026-02-11 | 13F | O'shaughnessy Asset Management, Llc | 32 | -49,21 | 1 | -100,00 | ||||
| 2025-11-12 | 13F | Principal Securities, Inc. | 0 | -100,00 | 0 | -100,00 | ||||
| 2026-01-29 | 13F | UBS Group AG | 90.011 | 6,97 | 2.520 | 7,69 | ||||
| 2026-02-23 | 13F | Virtu Financial LLC | 17.347 | 0 | ||||||
| 2025-11-05 | 13F | Smartleaf Asset Management LLC | 0 | -100,00 | 0 | -100,00 | ||||
| 2026-01-22 | 13F | Bear Mountain Capital, Inc. | 4.833 | 2,09 | 139 | 4,55 | ||||
| 2026-02-12 | 13F | Front Row Advisors LLC | 142 | 0,00 | 4 | 0,00 | ||||
| 2026-02-06 | 13F | Pnc Financial Services Group, Inc. | 1.990 | 0,00 | 56 | 0,00 | ||||
| 2026-04-22 | 13F | Horizon Bancorp Inc /in/ | 208 | 0,00 | 0 | |||||
| 2026-01-30 | 13F/A | M&t Bank Corp | 70.990 | -7,57 | 1.988 | -6,89 | ||||
| 2026-02-17 | 13F | Northern Trust Corp | 653.699 | 4,70 | 18.304 | 5,42 | ||||
| 2026-02-02 | 13F | Breakwater Investment Management | 477 | 0,00 | 13 | 0,00 | ||||
| 2026-02-12 | 13F | Federation des caisses Desjardins du Quebec | 115 | 0,00 | 3 | 0,00 | ||||
| 2026-02-14 | 13F | Rockefeller Capital Management L.P. | 30.753 | 8,80 | 861 | 9,54 | ||||
| 2026-02-05 | 13F | Allworth Financial LP | 115 | -64,29 | 3 | -62,50 | ||||
| 2026-02-13 | 13F | Flow Traders U.s. Llc | 70.336 | 34,96 | 2 | 0,00 | ||||
| 2026-04-16 | 13F | Upper Left Wealth Management, LLC | 38.205 | -3,68 | 1.017 | -8,38 | ||||
| 2026-02-13 | 13F | MAI Capital Management | 109 | 0,00 | 3 | 0,00 | ||||
| 2026-04-15 | 13F | City Holding Co | 955 | 31,72 | 25 | 25,00 | ||||
| 2025-11-12 | 13F | Steward Partners Investment Advisory, Llc | 0 | -100,00 | 0 | |||||
| 2025-11-14 | 13F | Citadel Advisors Llc | 0 | -100,00 | 0 | |||||
| 2026-02-03 | 13F | Strategic Wealth Advisors LLC | 3.324 | 0 | ||||||
| 2026-02-17 | 13F | Susquehanna International Group, Llp | 60.143 | 34,15 | 1.684 | 35,15 | ||||
| 2026-02-12 | 13F | Hollencrest Capital Management | 26 | 0,00 | 1 | |||||
| 2026-02-12 | 13F | Bank Of Montreal /can/ | 28.223 | 18,35 | 790 | 19,16 | ||||
| 2026-02-12 | 13F | Triumph Capital Management | 0 | -100,00 | 0 | -100,00 |