Grundlæggende statistik
| Institutionelle ejere | 107 total, 107 long only, 0 short only, 0 long/short - change of -0,93% MRQ |
| Gennemsnitlig porteføljeallokering | 0.1703 % - change of -5,26% MRQ |
| Institutionelle aktier (lange) | 2.102.381 (ex 13D/G) - change of -0,01MM shares -0,32% MRQ |
| Institutionel værdi (lang) | $ 158.279 USD ($1000) |
Institutionelt ejerskab og aktionærer
Invesco Exchange-Traded Fund Trust - Invesco S&P 500 Equal Weight Financials ETF (US:RSPF) har 107 institutionelle ejere og aktionærer, der har indsendt 13D/G- eller 13F-formularer til Securities Exchange Commission (SEC). Disse institutioner har i alt 2,102,381 aktier. Største aktionærer omfatter Bank Of America Corp /de/, GWM Advisors LLC, UBS Group AG, Joseph Group Capital Management, Wealth Enhancement Advisory Services, Llc, LPL Financial LLC, Joseph P. Lucia & Associates, LLC, Ballast, Inc., Davis Investment Partners, LLC, and Cetera Investment Advisers .
Invesco Exchange-Traded Fund Trust - Invesco S&P 500 Equal Weight Financials ETF (ARCA:RSPF) institutionel ejerskabsstruktur viser aktuelle positioner i virksomheden efter institutioner og fonde, samt seneste ændringer i positionsstørrelse. Større aktionærer kan omfatte individuelle investorer, investeringsforeninger, hedgefonde eller institutioner. Skema 13D angiver, at investoren besidder (eller besidder) mere end 5 % af virksomheden og har til hensigt (eller har til hensigt at) aktivt at forfølge en ændring i forretningsstrategi. Skema 13G indikerer en passiv investering på over 5%.
The share price as of September 12, 2025 is 78,34 / share. Previously, on September 16, 2024, the share price was 68,43 / share. This represents an increase of 14,48% over that period.

Fondens stemningsscore
Fund Sentiment Score (fka Ownership Accumulation Score) finder de aktier, der bliver mest købt af fonde. Det er resultatet af en sofistikeret, multi-faktor kvantitativ model, der identificerer virksomheder med de højeste niveauer af institutionel akkumulering. Scoringsmodellen bruger en kombination af den samlede stigning i oplyste ejere, ændringerne i porteføljeallokeringer i disse ejere og andre målinger. Tallet går fra 0 til 100, hvor højere tal indikerer et højere niveau af akkumulering for sine jævnaldrende, og 50 er gennemsnittet.
Opdateringsfrekvens: Dagligt
Se Ownership Explorer, som giver en liste over højest rangerende virksomheder.
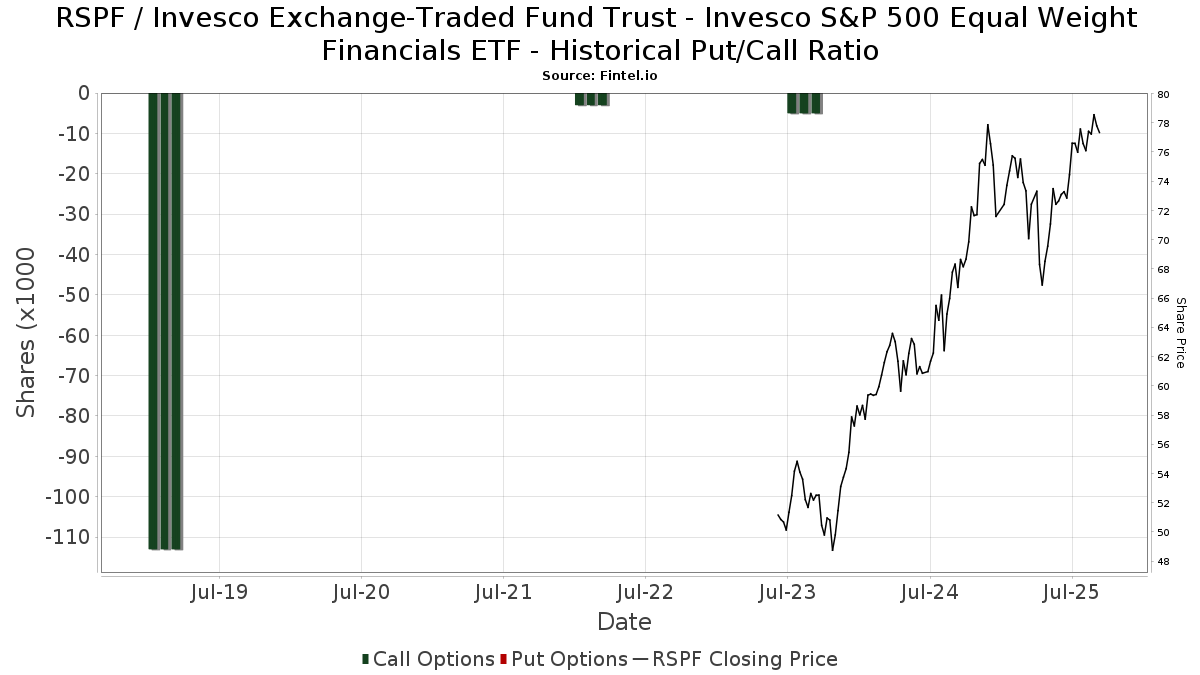
Institutionel Put/Call-forhold
Ud over at indberette standardaktie- og gældsudstedelser skal institutter med mere end 100 mill. aktiver under forvaltning også oplyse deres put- og call-optionsbeholdninger. Da salgsoptioner generelt indikerer negativ stemning, og købsoptioner indikerer positiv stemning, kan vi få en fornemmelse af den overordnede institutionelle stemning ved at plotte forholdet mellem put og kald. Diagrammet til højre viser det historiske put/call-forhold for dette instrument.
Brug af Put/Call Ratio som en indikator for investorernes stemning overvinder en af de vigtigste mangler ved at bruge totalt institutionelt ejerskab, som er, at en betydelig mængde af aktiver under forvaltning investeres passivt for at spore indekser. Passivt forvaltede fonde køber typisk ikke optioner, så indikatoren for put/call-forholdet følger mere nøje følelsen af aktivt forvaltede fonde.
13F og NPORT arkivering
Detaljer om 13F-arkivering er gratis. Detaljer om NP-ansøgninger kræver et premium-medlemskab. Grønne rækker angiver nye positioner. Røde rækker angiver lukkede positioner. Klik på linket ikon for at se den fulde transaktionshistorik.
Opgrader
for at låse premium-data op og eksportere til Excel ![]() .
.
| Fil dato | Kilde | Investor | Type | Gennemsnitlig pris (Øst) |
Aktier | Δ Aktier (%) |
Rapporteret Værdi ($1000) |
Δ Værdi (%) |
Port Alloc (%) |
|
|---|---|---|---|---|---|---|---|---|---|---|
| 2025-07-16 | 13F | Arkansas Financial Group, Inc. | 37.396 | -0,91 | 2.858 | 14,74 | ||||
| 2025-08-08 | 13F | Comprehensive Financial Planning, Inc./PA | 108 | 0,00 | 8 | 14,29 | ||||
| 2025-07-30 | 13F | Pacific Sun Financial Corp | 12.140 | 0,41 | 924 | 5,48 | ||||
| 2025-08-11 | 13F | HighTower Advisors, LLC | 20.250 | 4,42 | 1.541 | 9,60 | ||||
| 2025-08-11 | 13F | Aptus Capital Advisors, LLC | 1.200 | 91 | ||||||
| 2025-08-05 | 13F | Sebold Capital Management, Inc. | 5.873 | 0,07 | 447 | 4,94 | ||||
| 2025-07-16 | 13F | ORG Partners LLC | 654 | 0,46 | 50 | 6,38 | ||||
| 2025-07-10 | 13F | Wealth Enhancement Advisory Services, Llc | 93.885 | 3,95 | 7.287 | 11,25 | ||||
| 2025-08-18 | 13F | Geneos Wealth Management Inc. | 6.658 | 2,94 | 507 | 7,89 | ||||
| 2025-08-04 | 13F | Arkadios Wealth Advisors | 17.657 | 1.344 | ||||||
| 2025-08-12 | 13F | Allen Capital Group, LLC | 52.825 | -2,64 | 4.021 | 2,16 | ||||
| 2025-08-14 | 13F | Comerica Bank | 270 | 0,00 | 21 | 5,26 | ||||
| 2025-07-24 | 13F | Blair William & Co/il | 2.350 | 0,00 | 179 | 4,71 | ||||
| 2025-07-25 | 13F | Midwest Capital Advisors, LLC | 200 | 0,00 | 15 | 7,14 | ||||
| 2025-08-12 | 13F | LPL Financial LLC | 92.116 | 1,58 | 7.011 | 6,61 | ||||
| 2025-08-11 | 13F | Private Advisor Group, LLC | 23.859 | -34,62 | 1.816 | -31,41 | ||||
| 2025-08-05 | 13F | Scarborough Advisors, LLC | 10 | 1 | ||||||
| 2025-08-14 | 13F | Qube Research & Technologies Ltd | 45 | 0,00 | 3 | 0,00 | ||||
| 2025-07-23 | 13F | Friedenthal Financial | 8.272 | -1,50 | 630 | 3,28 | ||||
| 2025-08-14 | 13F | Ausdal Financial Partners, Inc. | 21.807 | 0,34 | 1.660 | 5,27 | ||||
| 2025-08-14 | 13F | Goldman Sachs Group Inc | 24.340 | 9,14 | 1.853 | 14,53 | ||||
| 2025-08-15 | 13F | CI Private Wealth, LLC | 6.716 | 0,00 | 511 | 4,93 | ||||
| 2025-07-24 | 13F | Stonebridge Financial Group, LLC | 0 | -100,00 | 0 | |||||
| 2025-08-12 | 13F | MAI Capital Management | 11.340 | 11,58 | 863 | 17,10 | ||||
| 2025-05-15 | 13F | Glenmede Trust Co Na | 368 | 0,00 | 27 | 0,00 | ||||
| 2025-08-14 | 13F | UBS Group AG | 105.298 | 74,61 | 8.015 | 83,26 | ||||
| 2025-08-08 | 13F | Financial Gravity Companies, Inc. | 85 | -15,00 | 6 | -14,29 | ||||
| 2025-08-06 | 13F | AE Wealth Management LLC | 645 | 0,31 | 49 | 6,52 | ||||
| 2025-08-14 | 13F | Sunbelt Securities, Inc. | 17.324 | 0,75 | 1.254 | 0,48 | ||||
| 2025-08-06 | 13F | Commonwealth Equity Services, Llc | 13.099 | -1,32 | 1 | |||||
| 2025-08-08 | 13F | Pnc Financial Services Group, Inc. | 49 | 0,00 | 4 | 0,00 | ||||
| 2025-07-11 | 13F | SILVER OAK SECURITIES, Inc | 7.746 | 5,17 | 590 | 11,76 | ||||
| 2025-08-11 | 13F | Citigroup Inc | 871 | 66 | ||||||
| 2025-08-12 | 13F | One Charles Private Wealth Services, LLC | 4.290 | -1,31 | 327 | 3,49 | ||||
| 2025-08-14 | 13F | Integrated Wealth Concepts LLC | 3.207 | 0,38 | 244 | 5,63 | ||||
| 2025-07-22 | 13F | Berger Financial Group, Inc | 6.688 | 0,00 | 509 | 4,95 | ||||
| 2025-08-11 | 13F | Tidemark, LLC | 366 | 0,55 | 28 | 3,85 | ||||
| 2025-08-12 | 13F | Proequities, Inc. | 0 | 0 | ||||||
| 2025-08-14 | 13F | Guardian Wealth Management, Inc. | 0 | -100,00 | 0 | |||||
| 2025-08-12 | 13F | AlphaCore Capital LLC | 1.148 | 35,38 | 87 | 42,62 | ||||
| 2025-07-21 | 13F | Ameritas Advisory Services, LLC | 132 | 10 | ||||||
| 2025-08-14 | 13F | Cardiff Park Advisors, Llc | 200 | 0,00 | 15 | 7,14 | ||||
| 2025-07-08 | 13F | Davis Investment Partners, LLC | 74.235 | -2,22 | 5.688 | 10,49 | ||||
| 2025-07-25 | 13F | We Are One Seven, LLC | 5.408 | -1,26 | 412 | 3,53 | ||||
| 2025-08-18 | 13F/A | National Bank Of Canada /fi/ | 19.444 | 42,33 | 1.477 | 48,79 | ||||
| 2025-08-14 | 13F | Wells Fargo & Company/mn | 40.399 | -4,76 | 3.075 | -0,07 | ||||
| 2025-07-25 | 13F | NorthRock Partners, LLC | 20 | 0,00 | 2 | 0,00 | ||||
| 2025-08-14 | 13F | GWM Advisors LLC | 142.532 | 5,00 | 10.849 | 10,19 | ||||
| 2025-07-29 | 13F | Empirical Asset Management, LLC | 7.598 | -1,38 | 578 | 3,58 | ||||
| 2025-08-14 | 13F | Bank Of America Corp /de/ | 254.979 | -0,90 | 19.407 | 4,00 | ||||
| 2025-07-22 | 13F | Yoder Wealth Management, Inc. | 42.176 | 6,36 | 3.210 | 11,61 | ||||
| 2025-07-28 | 13F | ForthRight Wealth Management, LLC | 0 | -100,00 | 0 | |||||
| 2025-07-31 | 13F | CVA Family Office, LLC | 150 | 0,00 | 11 | 10,00 | ||||
| 2025-08-15 | 13F | Morgan Stanley | 62.298 | -1,44 | 4.742 | 3,42 | ||||
| 2025-08-13 | 13F | Northwestern Mutual Wealth Management Co | 243 | 0,00 | 18 | 5,88 | ||||
| 2025-08-08 | 13F | IMA Wealth, Inc. | 3.985 | 0,00 | 303 | 4,84 | ||||
| 2025-08-11 | 13F | Principal Securities, Inc. | 1.889 | -19,31 | 144 | -15,38 | ||||
| 2025-08-08 | 13F | Cetera Investment Advisers | 69.733 | -3,49 | 5.308 | 1,28 | ||||
| 2025-08-12 | 13F | Mcdonald Partners Llc | 3.575 | 0,00 | 272 | 5,02 | ||||
| 2025-08-08 | 13F | Creative Planning | 9.632 | 11,92 | 733 | 17,47 | ||||
| 2025-07-22 | 13F | Wealthcare Advisory Partners LLC | 4.317 | -11,52 | 329 | -7,08 | ||||
| 2025-07-29 | 13F | Dumont & Blake Investment Advisors Llc | 12.639 | -0,74 | 962 | 4,12 | ||||
| 2025-08-14 | 13F | Federation des caisses Desjardins du Quebec | 332 | 0,00 | 25 | 4,17 | ||||
| 2025-08-25 | 13F/A | Promus Capital, LLC | 2.028 | 0,00 | 154 | 4,76 | ||||
| 2025-07-31 | 13F | Cambridge Investment Research Advisors, Inc. | 5.657 | -17,17 | 0 | |||||
| 2025-07-11 | 13F | Farther Finance Advisors, LLC | 53.623 | 4,05 | 4.081 | 9,26 | ||||
| 2025-08-08 | 13F | Hartland & Co., LLC | 5.473 | -1,17 | 417 | 3,74 | ||||
| 2025-08-14 | 13F | Susquehanna International Group, Llp | 4.545 | 42,34 | 346 | 49,35 | ||||
| 2025-08-13 | 13F | Lido Advisors, LLC | 11.151 | -9,74 | 849 | -5,36 | ||||
| 2025-07-16 | 13F/A | CX Institutional | 10 | -99,94 | 0 | -100,00 | ||||
| 2025-07-31 | 13F | Shaker Investments Llc/oh | 0 | -100,00 | 0 | |||||
| 2025-08-12 | 13F | SRS Capital Advisors, Inc. | 400 | 0,00 | 30 | 3,45 | ||||
| 2025-07-24 | 13F | Live Oak Investment Partners | 22.138 | 8,87 | 1.685 | 14,25 | ||||
| 2025-08-14 | 13F | Raymond James Financial Inc | 16.970 | -4,06 | 1.292 | 0,62 | ||||
| 2025-08-05 | 13F | Bank Of Montreal /can/ | 555 | 0,00 | 42 | 5,00 | ||||
| 2025-08-07 | 13F | Allworth Financial LP | 1.168 | 0,00 | 89 | 8,64 | ||||
| 2025-07-09 | 13F | Sandbox Financial Partners, LLC | 21.271 | -0,61 | 1.619 | 4,32 | ||||
| 2025-08-01 | 13F | Envestnet Asset Management Inc | 6.184 | 13,41 | 471 | 18,99 | ||||
| 2025-07-30 | 13F | Strategic Blueprint, LLC | 6.557 | -34,15 | 499 | -30,89 | ||||
| 2025-09-04 | 13F/A | Advisor Group Holdings, Inc. | 24.822 | 2,46 | 1.892 | 7,57 | ||||
| 2025-07-29 | 13F | Harbor Asset Planning, Inc. | 5.176 | 394 | ||||||
| 2025-05-08 | 13F | Baker Avenue Asset Management, LP | 0 | -100,00 | 0 | |||||
| 2025-07-29 | 13F | Private Trust Co Na | 3.293 | -51,91 | 251 | -49,60 | ||||
| 2025-08-04 | 13F | FRG Family Wealth Advisors LLC | 18.870 | 0,00 | 1.436 | 4,97 | ||||
| 2025-08-14 | 13F | Fmr Llc | 1.757 | 10,85 | 134 | 16,67 | ||||
| 2025-07-15 | 13F | McAdam, LLC | 2.718 | 207 | ||||||
| 2025-08-07 | 13F/A | Joseph Group Capital Management | 103.052 | 0,41 | 7.844 | 5,37 | ||||
| 2025-08-04 | 13F | Joseph P. Lucia & Associates, LLC | 80.446 | -1,32 | 6.123 | 3,57 | ||||
| 2025-08-12 | 13F | Jpmorgan Chase & Co | 64.600 | 0,00 | 4.917 | 4,93 | ||||
| 2025-07-30 | 13F | Eqis Capital Management, Inc. | 7.638 | -1,56 | 581 | 3,38 | ||||
| 2025-07-10 | 13F | Focus Financial Network, Inc. | 19.637 | -1,50 | 1.495 | 3,32 | ||||
| 2025-07-11 | 13F | Seacrest Wealth Management, Llc | 0 | -100,00 | 0 | |||||
| 2025-07-21 | 13F | DHJJ Financial Advisors, Ltd. | 270 | 0,00 | 21 | 5,26 | ||||
| 2025-08-11 | 13F | HHM Wealth Advisors, LLC | 2.395 | 11,66 | 182 | 17,42 | ||||
| 2025-08-11 | 13F | Cascade Wealth Advisors, Inc | 0 | -100,00 | 0 | |||||
| 2025-08-13 | 13F | Jones Financial Companies Lllp | 10.599 | 23,30 | 800 | 29,92 | ||||
| 2025-04-23 | 13F | Creative Financial Designs Inc /adv | 0 | -100,00 | 0 | |||||
| 2025-08-15 | 13F | Kestra Advisory Services, LLC | 9.206 | 7,91 | 701 | 13,27 | ||||
| 2025-07-18 | 13F | PFG Investments, LLC | 0 | -100,00 | 0 | |||||
| 2025-07-17 | 13F | Walker Asset Management, LLC | 18.638 | 0,94 | 1.419 | 5,90 | ||||
| 2025-08-06 | 13F | North Capital, Inc. | 320 | 0,00 | 24 | 4,35 | ||||
| 2025-08-13 | 13F | Green Harvest Asset Management LLC | 41.204 | 0,95 | 3.136 | 5,95 | ||||
| 2025-07-18 | 13F | Truist Financial Corp | 8.617 | 8,08 | 656 | 13,32 | ||||
| 2025-08-14 | 13F | Stifel Financial Corp | 18.007 | -16,65 | 1.371 | -12,57 | ||||
| 2025-08-14 | 13F | Citadel Advisors Llc | 5.912 | 450 | ||||||
| 2025-04-30 | 13F | Sofos Investments, Inc. | 100 | -56,71 | 7 | -50,00 | ||||
| 2025-08-14 | 13F | Ameriprise Financial Inc | 3.650 | 1,36 | 278 | 6,13 | ||||
| 2025-08-14 | 13F | Royal Bank Of Canada | 17.458 | 4,45 | 1.329 | 9,56 | ||||
| 2025-08-04 | 13F | Spire Wealth Management | 0 | -100,00 | 0 | |||||
| 2025-08-14 | 13F | Two Sigma Investments, Lp | 7.900 | 601 | ||||||
| 2025-07-25 | 13F | Envestnet Portfolio Solutions, Inc. | 3.515 | -4,12 | 268 | 0,75 | ||||
| 2025-07-29 | 13F | Ballast, Inc. | 80.446 | 6.123 | ||||||
| 2025-07-28 | 13F | Harbour Investments, Inc. | 16.597 | -0,47 | 1.263 | 4,47 | ||||
| 2025-08-14 | 13F | IHT Wealth Management, LLC | 0 | -100,00 | 0 | |||||
| 2025-08-14 | 13F | Ancora Advisors, LLC | 82 | 0,00 | 6 | 20,00 | ||||
| 2025-08-12 | 13F | Coldstream Capital Management Inc | 0 | -100,00 | 0 | |||||
| 2025-08-14 | 13F | Mml Investors Services, Llc | 4.965 | 1,51 | 0 | |||||
| 2025-08-11 | 13F | Regal Investment Advisors LLC | 5.025 | 0,00 | 382 | 4,95 | ||||
| 2025-08-14 | 13F | Glenmede Investment Management, LP | 368 | 28 | ||||||
| 2025-05-09 | 13F | CoreCap Advisors, LLC | 0 | -100,00 | 0 | |||||
| 2025-08-13 | 13F | Twin Peaks Wealth Advisors, LLC | 297 | 23 |