Grundlæggende statistik
| Institutionelle ejere | 61 total, 60 long only, 0 short only, 1 long/short - change of 1,67% MRQ |
| Gennemsnitlig porteføljeallokering | 0.0891 % - change of -70,33% MRQ |
| Institutionelle aktier (lange) | 567.427 (ex 13D/G) - change of -0,20MM shares -26,13% MRQ |
| Institutionel værdi (lang) | $ 53.277 USD ($1000) |
Institutionelt ejerskab og aktionærer
ProShares Trust - ProShares Ultra Technology (US:ROM) har 61 institutionelle ejere og aktionærer, der har indsendt 13D/G- eller 13F-formularer til Securities Exchange Commission (SEC). Disse institutioner har i alt 567,427 aktier. Største aktionærer omfatter Gotham Asset Management, LLC, Tyche Wealth Partners LLC, Envestnet Asset Management Inc, WealthCare Asset Management, LLC, Harbour Investments, Inc., Commonwealth Equity Services, Llc, Dale Q Rice Investment Management Ltd, Retirement Planning Co of New England, Inc., Advisor Group Holdings, Inc., and Mariner, LLC .
ProShares Trust - ProShares Ultra Technology (ARCA:ROM) institutionel ejerskabsstruktur viser aktuelle positioner i virksomheden efter institutioner og fonde, samt seneste ændringer i positionsstørrelse. Større aktionærer kan omfatte individuelle investorer, investeringsforeninger, hedgefonde eller institutioner. Skema 13D angiver, at investoren besidder (eller besidder) mere end 5 % af virksomheden og har til hensigt (eller har til hensigt at) aktivt at forfølge en ændring i forretningsstrategi. Skema 13G indikerer en passiv investering på over 5%.
The share price as of March 12, 2026 is 84,68 / share. Previously, on March 13, 2025, the share price was 54,14 / share. This represents an increase of 56,41% over that period.

Fondens stemningsscore
Fund Sentiment Score (fka Ownership Accumulation Score) finder de aktier, der bliver mest købt af fonde. Det er resultatet af en sofistikeret, multi-faktor kvantitativ model, der identificerer virksomheder med de højeste niveauer af institutionel akkumulering. Scoringsmodellen bruger en kombination af den samlede stigning i oplyste ejere, ændringerne i porteføljeallokeringer i disse ejere og andre målinger. Tallet går fra 0 til 100, hvor højere tal indikerer et højere niveau af akkumulering for sine jævnaldrende, og 50 er gennemsnittet.
Opdateringsfrekvens: Dagligt
Se Ownership Explorer, som giver en liste over højest rangerende virksomheder.
AI+ Ask Fintel’s AI assistant about ProShares Trust - ProShares Ultra Technology.
Select a question to share a public post with an AI-crafted answer.
Thinking of good questions…
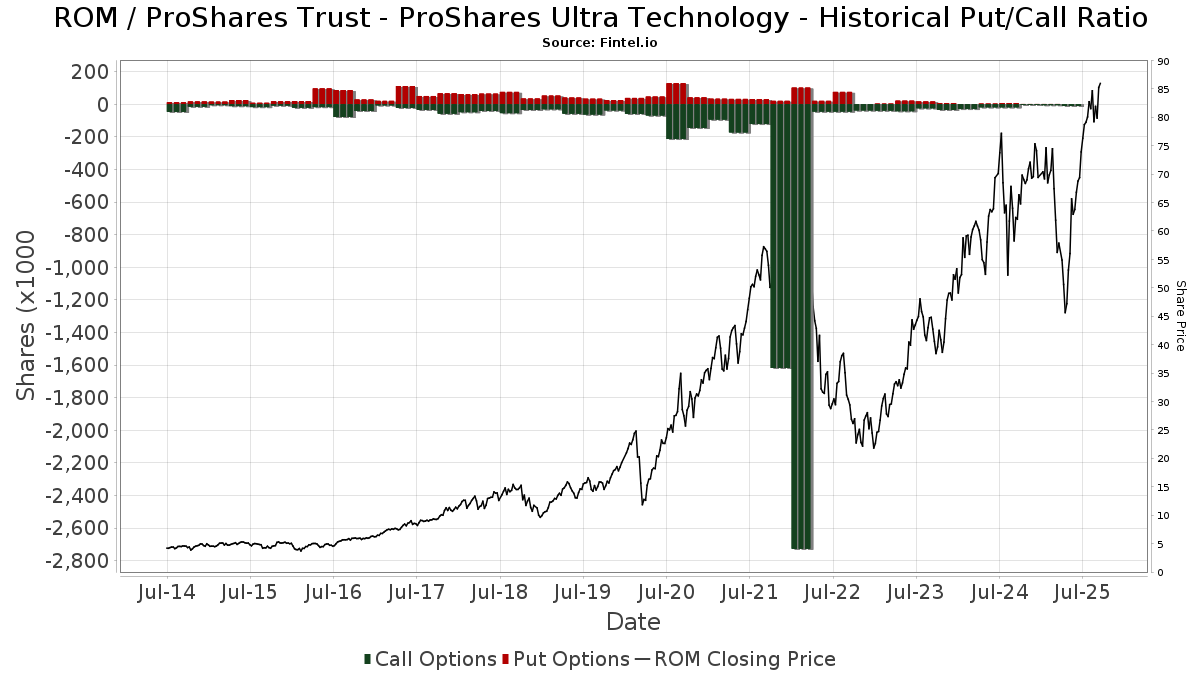
Institutionel Put/Call-forhold
Ud over at indberette standardaktie- og gældsudstedelser skal institutter med mere end 100 mill. aktiver under forvaltning også oplyse deres put- og call-optionsbeholdninger. Da salgsoptioner generelt indikerer negativ stemning, og købsoptioner indikerer positiv stemning, kan vi få en fornemmelse af den overordnede institutionelle stemning ved at plotte forholdet mellem put og kald. Diagrammet til højre viser det historiske put/call-forhold for dette instrument.
Brug af Put/Call Ratio som en indikator for investorernes stemning overvinder en af de vigtigste mangler ved at bruge totalt institutionelt ejerskab, som er, at en betydelig mængde af aktiver under forvaltning investeres passivt for at spore indekser. Passivt forvaltede fonde køber typisk ikke optioner, så indikatoren for put/call-forholdet følger mere nøje følelsen af aktivt forvaltede fonde.
13F og NPORT arkivering
Detaljer om 13F-arkivering er gratis. Detaljer om NP-ansøgninger kræver et premium-medlemskab. Grønne rækker angiver nye positioner. Røde rækker angiver lukkede positioner. Klik på linket ikon for at se den fulde transaktionshistorik.
Opgrader
for at låse premium-data op og eksportere til Excel ![]() .
.
| Fil dato | Kilde | Investor | Type | Gennemsnitlig pris (Øst) |
Aktier | Δ Aktier (%) |
Rapporteret Værdi ($1000) |
Δ Værdi (%) |
Port Alloc (%) |
|
|---|---|---|---|---|---|---|---|---|---|---|
| 2026-01-29 | 13F | UBS Group AG | 98 | 9 | ||||||
| 2026-01-21 | 13F | Runnymede Capital Advisors, Inc. | 0 | -100,00 | 0 | |||||
| 2026-02-12 | 13F | Great Valley Advisor Group, Inc. | 3.358 | -2,50 | 317 | -0,94 | ||||
| 2026-02-11 | 13F | Group One Trading, L.p. | 272 | 26 | ||||||
| 2026-01-29 | 13F | UMA Financial Services, Inc. | 400 | 0,00 | 38 | 0,00 | ||||
| 2026-02-09 | 13F | Harbour Investments, Inc. | 30.601 | 0,00 | 2.886 | 1,76 | ||||
| 2026-01-08 | 13F | Brave Asset Management Inc | 4.176 | 0,00 | 394 | 1,81 | ||||
| 2026-01-20 | 13F | Toth Financial Advisory Corp | 601 | -87,72 | 57 | -87,64 | ||||
| 2026-02-10 | 13F | Shepherd Financial Partners LLC | 4.844 | 0,00 | 457 | 1,79 | ||||
| 2025-12-02 | 13F | Allworth Financial LP | 0 | -100,00 | 0 | |||||
| 2026-02-05 | 13F | Tucker Asset Management Llc | 70 | 7 | ||||||
| 2026-01-26 | 13F | Whittier Trust Co | 165 | 0,00 | 16 | 6,67 | ||||
| 2026-02-11 | 13F | Cerity Partners LLC | 6.400 | 0,00 | 604 | 1,69 | ||||
| 2026-02-17 | 13F | Citadel Advisors Llc | Call | 0 | -100,00 | 0 | ||||
| 2026-02-12 | 13F | Hrt Financial Lp | 0 | -100,00 | 0 | |||||
| 2026-02-11 | 13F | Franklin Resources Inc | 100 | 0,00 | 9 | 0,00 | ||||
| 2026-02-17 | 13F | Creative Planning | 7.500 | -0,08 | 707 | 1,73 | ||||
| 2026-02-03 | 13F | Sequoia Financial Advisors, LLC | 6.400 | 604 | ||||||
| 2026-02-02 | 13F | Oppenheimer & Co Inc | 2.800 | 0,00 | 264 | 1,93 | ||||
| 2026-01-28 | 13F | Chicago Partners Investment Group LLC | 5.438 | 0,00 | 518 | -9,60 | ||||
| 2026-01-26 | 13F | Independent Wealth Network Inc. | 2.257 | 0,00 | 213 | 1,44 | ||||
| 2026-02-17 | 13F | Citadel Advisors Llc | Put | 3.500 | 330 | |||||
| 2026-02-06 | 13F | HighTower Advisors, LLC | 8.623 | 45,34 | 813 | 48,09 | ||||
| 2026-02-17 | 13F | Citadel Advisors Llc | 5.411 | 20,89 | 510 | 23,19 | ||||
| 2026-02-10 | 13F | Lido Advisors, LLC | 3.049 | 0,00 | 283 | 0,00 | ||||
| 2026-02-17 | 13F | Qube Research & Technologies Ltd | 89 | -32,06 | 8 | -33,33 | ||||
| 2026-02-17 | 13F | WealthCare Asset Management, LLC | 31.564 | 2.978 | ||||||
| 2026-02-17 | 13F | Tower Research Capital LLC (TRC) | 0 | -100,00 | 0 | |||||
| 2026-01-16 | 13F | Empirical Financial Services, LLC d.b.a. Empirical Wealth Management | 0 | -100,00 | 0 | |||||
| 2026-02-06 | 13F | Pnc Financial Services Group, Inc. | 1.000 | 0,00 | 94 | 2,17 | ||||
| 2026-02-17 | 13F | Royal Bank Of Canada | 711 | 132,35 | 67 | 139,29 | ||||
| 2026-02-13 | 13F | Kilter Group LLC | 16 | 0,00 | 2 | 0,00 | ||||
| 2026-01-26 | 13F | McGuire Investment Group, LLC | 4.600 | -3,69 | 434 | -2,04 | ||||
| 2026-02-12 | 13F | CIBC Private Wealth Group, LLC | 0 | -100,00 | 0 | |||||
| 2026-02-13 | 13F | River Wealth Advisors LLC | 5.851 | 552 | ||||||
| 2026-02-13 | 13F | Mariner, LLC | 9.420 | 0,00 | 888 | 1,83 | ||||
| 2026-02-05 | 13F | Cambridge Investment Research Advisors, Inc. | 2.213 | 0 | ||||||
| 2026-01-13 | 13F | CoreCap Advisors, LLC | 48 | -45,45 | 5 | -50,00 | ||||
| 2026-02-17 | 13F | Integrated Advisors Network LLC | 4.043 | 381 | ||||||
| 2026-01-28 | 13F | APS Management Group, Inc. | 2.195 | 207 | ||||||
| 2026-02-12 | 13F | Beacon Capital Management, Inc. | 61 | 0,00 | 6 | 0,00 | ||||
| 2026-02-13 | 13F | Kestra Advisory Services, LLC | 0 | -100,00 | 0 | |||||
| 2026-02-04 | 13F | Nwam Llc | 0 | -100,00 | 0 | -100,00 | ||||
| 2026-02-13 | 13F | Wells Fargo & Company/mn | 1 | 0,00 | 0 | |||||
| 2026-02-05 | 13F | Atria Investments Llc | 2.654 | 250 | ||||||
| 2025-12-02 | 13F | IFP Advisors, Inc | 0 | -100,00 | 0 | |||||
| 2026-01-21 | 13F | Sound Income Strategies, LLC | 73 | 7 | ||||||
| 2026-01-26 | 13F | Parcion Private Wealth LLC | 4.800 | 0,00 | 453 | 1,80 | ||||
| 2026-01-28 | 13F | Kanawha Capital Management Llc | 2.186 | 0,00 | 206 | 1,98 | ||||
| 2026-02-10 | 13F | Envestnet Asset Management Inc | 46.864 | 13,00 | 4.419 | 15,02 | ||||
| 2026-02-17 | 13F | Quantinno Capital Management LP | 5.960 | -56,04 | 562 | -55,25 | ||||
| 2026-01-07 | 13F | Aventura Private Wealth, LLC | 800 | 0,00 | 75 | 1,35 | ||||
| 2026-01-26 | 13F | Discipline Wealth Solutions, LLC | 4.320 | 0,00 | 407 | 1,75 | ||||
| 2026-02-13 | 13F | Morgan Stanley | 2 | 100,00 | 0 | |||||
| 2026-02-17 | 13F | Susquehanna International Group, Llp | Call | 0 | -100,00 | 0 | ||||
| 2026-02-11 | 13F | LPL Financial LLC | 5.187 | 34,94 | 489 | 37,36 | ||||
| 2026-02-10 | 13F | Rothschild Investment Llc | 150 | 0,00 | 14 | 7,69 | ||||
| 2026-02-11 | 13F | Simplex Trading, Llc | 0 | -100,00 | 0 | |||||
| 2026-02-11 | 13F | O'shaughnessy Asset Management, Llc | 0 | -100,00 | 0 | |||||
| 2026-01-20 | 13F | Signaturefd, Llc | 200 | 0,00 | 19 | 0,00 | ||||
| 2026-02-04 | 13F | LRI Investments, LLC | 401 | 0,00 | 38 | 0,00 | ||||
| 2026-02-17 | 13F | Susquehanna International Group, Llp | 5.914 | -28,53 | 558 | -27,28 | ||||
| 2026-02-10 | 13F/A | Northwestern Mutual Wealth Management Co | 4.580 | -19,58 | 432 | -18,22 | ||||
| 2026-02-13 | 13F | Truvestments Capital Llc | 616 | 0,00 | 58 | 1,75 | ||||
| 2026-02-10 | 13F | Marshall & Sterling Wealth Advisors Inc. | 1.793 | -7,91 | 169 | -6,11 | ||||
| 2026-01-28 | 13F | Clarity Financial LLC | 2.942 | -3,64 | 277 | -1,77 | ||||
| 2026-02-17 | 13F | Risk Paradigm Group, LLC | 0 | -100,00 | 0 | |||||
| 2026-02-17 | 13F | Advisor Group Holdings, Inc. | 10.837 | 48,05 | 1.022 | 50,81 | ||||
| 2026-02-17 | 13F | Bank Of America Corp /de/ | 6.600 | 0,00 | 622 | 1,80 | ||||
| 2026-02-12 | 13F | Commonwealth Equity Services, Llc | 20.131 | -3,28 | 1.898 | 189.700,00 | ||||
| 2026-01-28 | 13F | Retirement Planning Co of New England, Inc. | 13.695 | -2,55 | 1.291 | -0,84 | ||||
| 2026-02-17 | 13F | Wealth Watch Advisors, INC | 88 | 0,00 | 8 | 0,00 | ||||
| 2026-02-17 | 13F | Warren Averett Asset Management, LLC | 8.200 | 0,00 | 773 | 1,84 | ||||
| 2025-11-13 | 13F | Quadrature Capital Ltd | 0 | -100,00 | 0 | |||||
| 2026-01-30 | 13F | Dale Q Rice Investment Management Ltd | 14.500 | -1,42 | 1.367 | -5,07 | ||||
| 2026-01-23 | 13F | Tyche Wealth Partners LLC | 77.725 | -0,27 | 7.329 | 1,51 | ||||
| 2025-11-14 | 13F | Eqis Capital Management, Inc. | 0 | -100,00 | 0 | |||||
| 2026-02-17 | 13F | Gotham Asset Management, LLC | 171.834 | 0,00 | 16.204 | 1,77 |