Grundlæggende statistik
| Institutionelle ejere | 87 total, 87 long only, 0 short only, 0 long/short - change of 2,35% MRQ |
| Gennemsnitlig porteføljeallokering | 0.6211 % - change of -9,63% MRQ |
| Institutionelle aktier (lange) | 14.912.473 (ex 13D/G) - change of 0,13MM shares 0,88% MRQ |
| Institutionel værdi (lang) | $ 472.879 USD ($1000) |
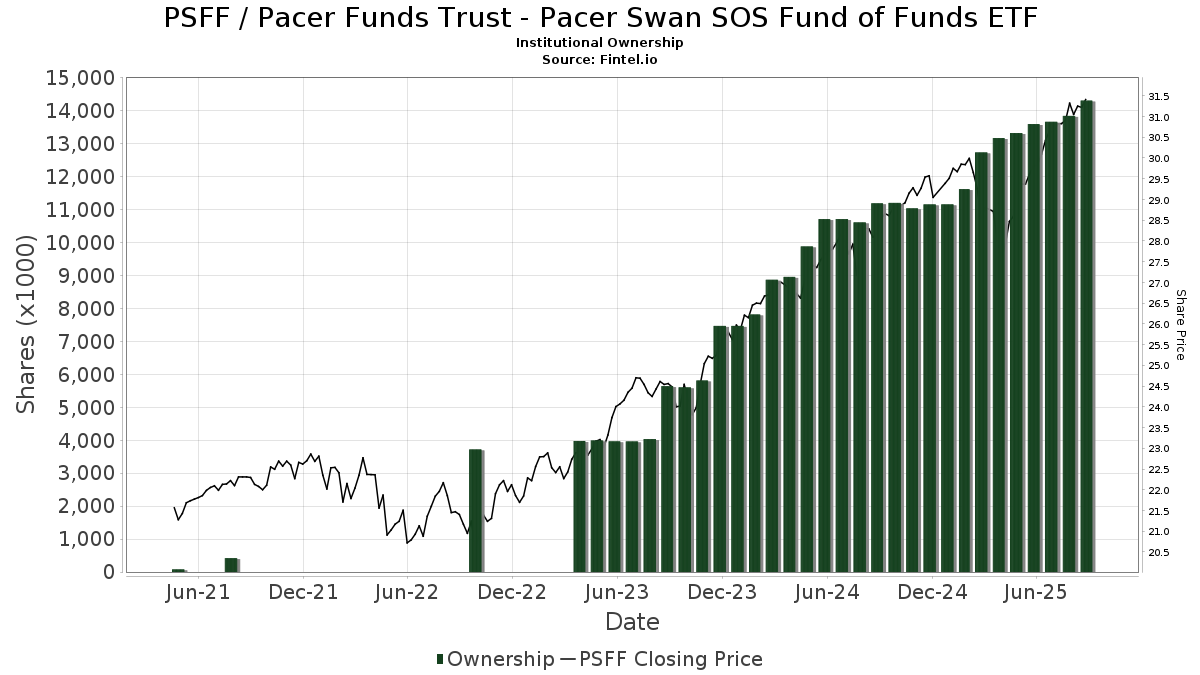
Institutionelt ejerskab og aktionærer
Pacer Funds Trust - Pacer Swan SOS Fund of Funds ETF (US:PSFF) har 87 institutionelle ejere og aktionærer, der har indsendt 13D/G- eller 13F-formularer til Securities Exchange Commission (SEC). Disse institutioner har i alt 14,912,473 aktier. Største aktionærer omfatter Allworth Financial LP, Cetera Investment Advisers, Advisor Group Holdings, Inc., Envestnet Asset Management Inc, Signal Advisors Wealth, LLC, Maripau Wealth Management Llc, Ausdal Financial Partners, Inc., Mml Investors Services, Llc, Brass Tax Wealth Management, Inc, and Financial Strategies Group, Inc. .
Pacer Funds Trust - Pacer Swan SOS Fund of Funds ETF (BATS:PSFF) institutionel ejerskabsstruktur viser aktuelle positioner i virksomheden efter institutioner og fonde, samt seneste ændringer i positionsstørrelse. Større aktionærer kan omfatte individuelle investorer, investeringsforeninger, hedgefonde eller institutioner. Skema 13D angiver, at investoren besidder (eller besidder) mere end 5 % af virksomheden og har til hensigt (eller har til hensigt at) aktivt at forfølge en ændring i forretningsstrategi. Skema 13G indikerer en passiv investering på over 5%.
The share price as of April 10, 2026 is 32,78 / share. Previously, on April 14, 2025, the share price was 27,92 / share. This represents an increase of 17,41% over that period.
Fondens stemningsscore
Fund Sentiment Score (fka Ownership Accumulation Score) finder de aktier, der bliver mest købt af fonde. Det er resultatet af en sofistikeret, multi-faktor kvantitativ model, der identificerer virksomheder med de højeste niveauer af institutionel akkumulering. Scoringsmodellen bruger en kombination af den samlede stigning i oplyste ejere, ændringerne i porteføljeallokeringer i disse ejere og andre målinger. Tallet går fra 0 til 100, hvor højere tal indikerer et højere niveau af akkumulering for sine jævnaldrende, og 50 er gennemsnittet.
Opdateringsfrekvens: Dagligt
Se Ownership Explorer, som giver en liste over højest rangerende virksomheder.
AI+ Ask Fintel’s AI assistant about Pacer Funds Trust - Pacer Swan SOS Fund of Funds ETF.
Select a question to share a public post with an AI-crafted answer.
Thinking of good questions…
Institutionel Put/Call-forhold
Ud over at indberette standardaktie- og gældsudstedelser skal institutter med mere end 100 mill. aktiver under forvaltning også oplyse deres put- og call-optionsbeholdninger. Da salgsoptioner generelt indikerer negativ stemning, og købsoptioner indikerer positiv stemning, kan vi få en fornemmelse af den overordnede institutionelle stemning ved at plotte forholdet mellem put og kald. Diagrammet til højre viser det historiske put/call-forhold for dette instrument.
Brug af Put/Call Ratio som en indikator for investorernes stemning overvinder en af de vigtigste mangler ved at bruge totalt institutionelt ejerskab, som er, at en betydelig mængde af aktiver under forvaltning investeres passivt for at spore indekser. Passivt forvaltede fonde køber typisk ikke optioner, så indikatoren for put/call-forholdet følger mere nøje følelsen af aktivt forvaltede fonde.
13F og NPORT arkivering
Detaljer om 13F-arkivering er gratis. Detaljer om NP-ansøgninger kræver et premium-medlemskab. Grønne rækker angiver nye positioner. Røde rækker angiver lukkede positioner. Klik på linket ikon for at se den fulde transaktionshistorik.
Opgrader
for at låse premium-data op og eksportere til Excel ![]() .
.
| Fil dato | Kilde | Investor | Type | Gennemsnitlig pris (Øst) |
Aktier | Δ Aktier (%) |
Rapporteret Værdi ($1000) |
Δ Værdi (%) |
Port Alloc (%) |
|
|---|---|---|---|---|---|---|---|---|---|---|
| 2026-02-11 | 13F | J.w. Cole Advisors, Inc. | 21.070 | -10,61 | 681 | -8,47 | ||||
| 2026-02-17 | 13F | Signature Equity Partners, LLC | 5.620 | 182 | ||||||
| 2026-02-09 | 13F | Harbour Investments, Inc. | 99.291 | -48,98 | 3.210 | -47,80 | ||||
| 2026-02-17 | 13F | Susquehanna International Group, Llp | 0 | -100,00 | 0 | |||||
| 2026-02-12 | 13F | Principal Securities, Inc. | 0 | -100,00 | 0 | |||||
| 2025-11-14 | 13F | Brass Tax Wealth Management, Inc | 441.868 | -34,98 | 13.961 | -32,61 | ||||
| 2026-01-28 | 13F | Chicago Partners Investment Group LLC | 71.223 | 1,21 | 2.318 | 3,21 | ||||
| 2026-01-26 | 13F | AE Wealth Management LLC | 3.514 | -9,67 | 114 | -7,38 | ||||
| 2026-01-29 | 13F | UBS Group AG | 0 | -100,00 | 0 | |||||
| 2026-02-12 | 13F | Steward Partners Investment Advisory, Llc | 1.611 | -21,64 | 52 | -18,75 | ||||
| 2026-01-15 | 13F | Trinity Wealth Management, LLC | 37.976 | -4,22 | 1.228 | -2,00 | ||||
| 2026-02-10 | 13F | Founders Financial Securities Llc | 35.309 | 4,93 | 1.142 | 7,34 | ||||
| 2026-02-03 | 13F | RFG Advisory, LLC | 8.891 | 35,27 | 287 | 38,65 | ||||
| 2026-02-09 | 13F | Prospera Financial Services Inc | 9.770 | 316 | ||||||
| 2026-04-09 | 13F | DHJJ Financial Advisors, Ltd. | 55 | 0,00 | 2 | 0,00 | ||||
| 2026-02-03 | 13F | International Assets Investment Management, Llc | 2.398 | 78 | ||||||
| 2026-02-06 | 13F | Creative Financial Designs Inc /adv | 281 | 0,00 | 9 | 12,50 | ||||
| 2025-11-14 | 13F | Northwestern Mutual Wealth Management Co | 0 | -100,00 | 0 | |||||
| 2026-01-23 | 13F | Diligent Investors, LLC | 34.498 | -0,29 | 1.115 | 2,01 | ||||
| 2026-02-13 | 13F | Sofos Investments, Inc. | 9.000 | 0,00 | 291 | 2,11 | ||||
| 2026-02-06 | 13F | HighTower Advisors, LLC | 56.209 | -3,02 | 1.817 | -0,76 | ||||
| 2026-02-09 | 13F | Integrity Alliance, Llc. | 11.710 | 379 | ||||||
| 2025-11-14 | 13F | Jane Street Group, Llc | 0 | -100,00 | 0 | |||||
| 2026-02-12 | 13F | Commonwealth Equity Services, Llc | 259.670 | 16,62 | 8.395 | 119.828,57 | ||||
| 2026-03-13 | 13F/A | Pensionmark Financial Group, Llc | 133.347 | 4.311 | ||||||
| 2026-02-11 | 13F | Gwn Securities Inc. | 25.092 | 8,44 | 811 | 10,94 | ||||
| 2026-01-27 | 13F | Novem Group | 6.392 | -26,10 | 207 | -24,54 | ||||
| 2026-01-23 | 13F | Optima Capital Llc | 62.747 | 3,86 | 2.029 | 6,29 | ||||
| 2026-01-26 | 13F | Cwm, Llc | 7.661 | -9,59 | 0 | |||||
| 2026-01-15 | 13F | Brookstone Capital Management | 153.624 | 84,12 | 4.967 | 88,39 | ||||
| 2026-02-13 | 13F | Bay Colony Advisory Group, Inc d/b/a Bay Colony Advisors | 0 | -100,00 | 0 | -100,00 | ||||
| 2026-01-21 | 13F | Capital Investment Advisory Services, LLC | 1.655 | 0,00 | 54 | 1,92 | ||||
| 2026-02-11 | 13F | LPL Financial LLC | 265.569 | -5,73 | 8.586 | -3,54 | ||||
| 2026-02-12 | 13F | Benson Wealth Management INC | 373 | 12 | ||||||
| 2026-02-17 | 13F | Advisory Services Network, LLC | 107.802 | 86,03 | 3.485 | 90,44 | ||||
| 2026-01-20 | 13F | Sugar Maple Asset Management, LLC | 8.394 | -90,56 | 271 | -90,36 | ||||
| 2026-01-29 | 13F | Comerica Bank | 2.491 | 0,00 | 81 | 2,56 | ||||
| 2026-02-13 | 13F | Mml Investors Services, Llc | 498.941 | 9,71 | 16.131 | 12,26 | ||||
| 2026-02-17 | 13F | Private Advisor Group, LLC | 31.889 | -24,22 | 1.031 | -22,50 | ||||
| 2026-02-20 | 13F | Sunbelt Securities, Inc. | 4.195 | 0,00 | 136 | 2,27 | ||||
| 2026-02-13 | 13F | Integrated Wealth Concepts LLC | 0 | -100,00 | 0 | |||||
| 2025-11-04 | 13F | Atlantic Union Bankshares Corp | 0 | -100,00 | 0 | |||||
| 2026-02-11 | 13F | Jpmorgan Chase & Co | 102.554 | 20,27 | 3.316 | 23,05 | ||||
| 2026-01-12 | 13F | Fiduciary Financial Group, Llc | 7.612 | 0,00 | 246 | 2,50 | ||||
| 2026-01-20 | 13F | Stratos Wealth Partners, LTD. | 9.853 | -5,72 | 319 | -3,64 | ||||
| 2026-01-23 | 13F | HBW Advisory Services LLC | 20.827 | 44,38 | 673 | 47,91 | ||||
| 2026-01-15 | 13F | SILVER OAK SECURITIES, Inc | 56.390 | 19,83 | 1.823 | 22,61 | ||||
| 2026-01-23 | 13F | Retirement Guys Formula Llc | 33.476 | -92,82 | 1.082 | -92,66 | ||||
| 2026-01-30 | 13F | Sigma Planning Corp | 236.403 | 2,60 | 7.643 | 4,99 | ||||
| 2025-10-20 | 13F | Ergawealth Advisors, Inc. | 0 | -100,00 | 0 | |||||
| 2026-02-05 | 13F | Allworth Financial LP | 1.797.687 | 3,34 | 58.119 | 5,75 | ||||
| 2026-02-17 | 13F | Advisor Group Holdings, Inc. | 1.476.758 | -2,55 | 47.743 | 0,42 | ||||
| 2026-02-12 | 13F | Brinker Capital Investments, LLC | 17.903 | 579 | ||||||
| 2026-03-24 | 13F | Armis Advisers, LLC | 267.270 | -67,90 | 8.524 | -67,65 | ||||
| 2026-02-13 | 13F | Uniting Wealth Partners, LLC | 0 | -100,00 | 0 | |||||
| 2026-01-26 | 13F | Merit Financial Group, LLC | 119.961 | 3.878 | ||||||
| 2026-02-17 | 13F | Bank Of America Corp /de/ | 65 | 2 | ||||||
| 2026-02-05 | 13F | Cambridge Investment Research Advisors, Inc. | 188.120 | -0,22 | 6 | 20,00 | ||||
| 2026-02-17 | 13F | Old Mission Capital Llc | 15.539 | -4,91 | 502 | -2,71 | ||||
| 2026-01-27 | 13F | PFG Advisors | 16.452 | -17,81 | 532 | -15,98 | ||||
| 2026-02-10 | 13F | Envestnet Asset Management Inc | 1.099.697 | 3,59 | 35.553 | 6,00 | ||||
| 2026-04-07 | 13F | CoreCap Advisors, LLC | 0 | -100,00 | 0 | |||||
| 2026-01-29 | 13F | ODonnell Financial Services, LLC | 100.311 | 4,25 | 3.243 | 6,68 | ||||
| 2026-01-26 | 13F | Independent Wealth Network Inc. | 71.640 | -0,78 | 2.316 | 1,53 | ||||
| 2026-01-13 | 13F | Signal Advisors Wealth, LLC | 582.221 | 0,79 | 18.823 | 3,14 | ||||
| 2026-02-06 | 13F | IFP Advisors, Inc | 518 | 0,00 | 17 | 0,00 | ||||
| 2025-10-23 | 13F | Coastal Investment Advisors, Inc. | 0 | -100,00 | 0 | |||||
| 2026-02-13 | 13F | Pinnacle Wealth Planning Services, Inc. | 739 | 24 | ||||||
| 2026-02-04 | 13F | Centric Wealth Management | 20.396 | -1,95 | 665 | 0,15 | ||||
| 2026-02-19 | 13F | Atomi Financial Group, Inc. | 10.417 | -6,53 | 337 | -4,55 | ||||
| 2025-11-14 | 13F | Raymond James Financial Inc | 0 | -100,00 | 0 | |||||
| 2026-01-20 | 13F | Stratos Wealth Advisors, LLC | 13.089 | 88,71 | 423 | 93,15 | ||||
| 2025-11-07 | 13F | NewEdge Wealth, LLC | 0 | -100,00 | 0 | -100,00 | ||||
| 2026-02-06 | 13F | Signature Estate & Investment Advisors Llc | 57.086 | -4,12 | 1.846 | -1,91 | ||||
| 2026-02-13 | 13F | Arete Wealth Advisors, LLC | 14.868 | -16,38 | 0 | |||||
| 2025-11-10 | 13F | Lion Street Advisors, LLC | 0 | -100,00 | 0 | |||||
| 2026-01-27 | 13F | Keystone Financial Services, LLC | 337.465 | 2,19 | 10.910 | 4,57 | ||||
| 2026-01-30 | 13F | Simplicity Wealth,LLC | 52.521 | -10,00 | 1.698 | -7,92 | ||||
| 2026-01-28 | 13F | Geneos Wealth Management Inc. | 33.324 | 164,52 | 1.077 | 170,60 | ||||
| 2026-02-10 | 13F | Verus Capital Partners, Llc | 210.190 | 6.795 | ||||||
| 2026-02-17 | 13F | Warren Averett Asset Management, LLC | 79.287 | 2.563 | ||||||
| 2026-02-13 | 13F | Financial Network Wealth Advisors LLC | 33.708 | 353,61 | 1.090 | 365,38 | ||||
| 2026-02-17 | 13F | Cetera Investment Advisers | 1.688.291 | 8,32 | 54.582 | 10,84 | ||||
| 2026-04-07 | 13F | U.S. Capital Wealth Advisors, LLC | 7.090 | 227 | ||||||
| 2026-02-10 | 13F | Ascension Capital Advisors, Inc. | 41.366 | 1.337 | ||||||
| 2026-02-12 | 13F | Triumph Capital Management | 600 | 0,00 | 19 | 5,56 | ||||
| 2026-02-13 | 13F | Kestra Advisory Services, LLC | 0 | -100,00 | 0 | |||||
| 2026-02-13 | 13F | Ausdal Financial Partners, Inc. | 528.378 | 12,86 | 17.082 | 15,48 | ||||
| 2026-02-18 | 13F | GWM Advisors LLC | 304.273 | 31,26 | 9.837 | 34,33 | ||||
| 2026-02-10 | 13F | Evolution Wealth Management Inc. | 349.058 | 97,63 | 11.285 | 102,24 | ||||
| 2026-02-14 | 13F | Copley Financial Group, Inc. | 364.551 | 24,60 | 11.786 | 27,50 | ||||
| 2026-02-04 | 13F | Cascades Capital Asset Management, LLC | 48.840 | -7,18 | 1.579 | -5,05 | ||||
| 2026-02-05 | 13F | Financial Strategies Group, Inc. | 427.534 | 0,66 | 13.895 | 2,78 | ||||
| 2026-02-17 | 13F | Core Wealth Advisors, Inc. | 141.104 | 6,97 | 4.562 | 9,46 | ||||
| 2026-02-17 | 13F | Maripau Wealth Management Llc | 578.197 | 0,86 | 18.708 | 3,29 | ||||
| 2026-02-10 | 13F | Bank of New York Mellon Corp | 11.383 | 3,13 | 368 | 5,75 | ||||
| 2026-02-11 | 13F | Capital Analysts, Inc. | 63.338 | -5,06 | 2 | 0,00 | ||||
| 2026-04-08 | 13F | Wealth Enhancement Advisory Services, Llc | 14.433 | 1,18 | 463 | -0,22 | ||||
| 2026-04-07 | 13F | Comprehensive Financial Planning, Inc./PA | 37.219 | 9,48 | 1.193 | 8,46 | ||||
| 2026-02-13 | 13F | Glen Eagle Advisors, LLC | 50.541 | 0,81 | 1.634 | 3,16 | ||||
| 2026-02-13 | 13F | Morgan Stanley | 0 | -100,00 | 0 | |||||
| 2026-01-29 | 13F | Kestra Private Wealth Services, Llc | 300.320 | 19,83 | 9.709 | 22,62 | ||||
| 2026-03-05 | 13F | Storen Legacy Partners, LLC | 356.313 | 11.520 | ||||||
| 2026-01-20 | 13F | Fundamentun, Llc | 95.161 | -2,01 | 3.077 | 0,26 | ||||
| 2026-01-29 | 13F | New Century Financial Group, LLC | 0 | -100,00 | 0 |