Grundlæggende statistik
| Institutionelle ejere | 80 total, 80 long only, 0 short only, 0 long/short - change of 5,26% MRQ |
| Gennemsnitlig porteføljeallokering | 0.0266 % - change of 18,16% MRQ |
| Institutionelle aktier (lange) | 899.200 (ex 13D/G) - change of -0,38MM shares -29,56% MRQ |
| Institutionel værdi (lang) | $ 70.019 USD ($1000) |
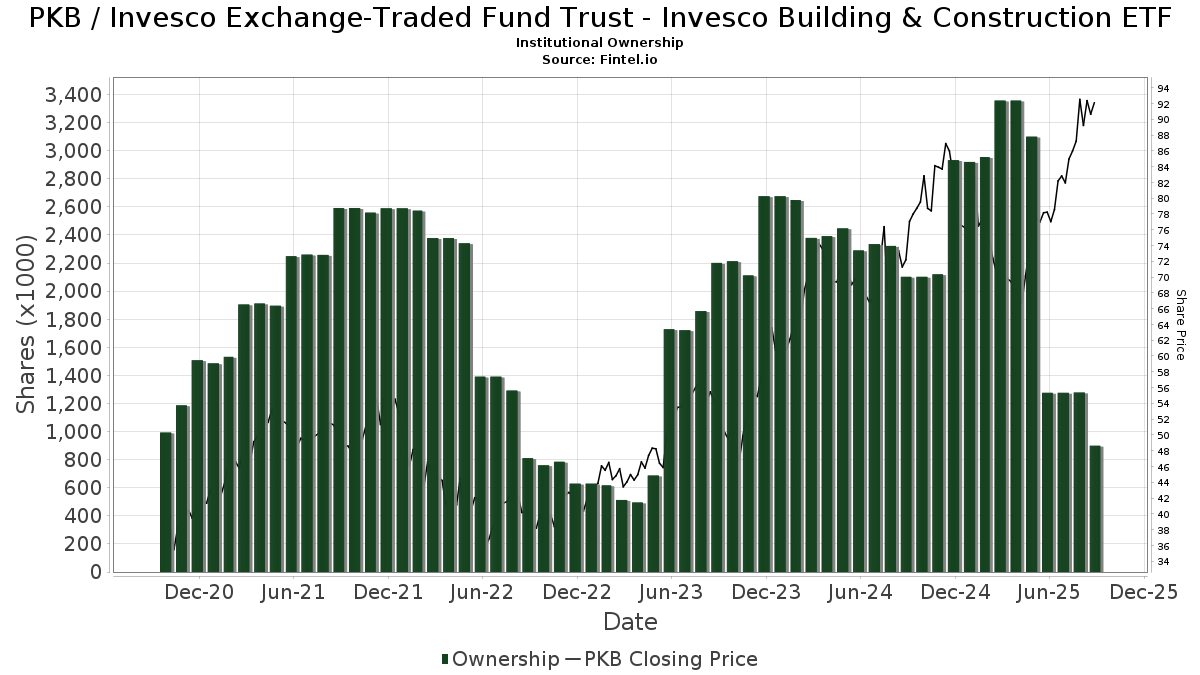
Institutionelt ejerskab og aktionærer
Invesco Exchange-Traded Fund Trust - Invesco Building & Construction ETF (US:PKB) har 80 institutionelle ejere og aktionærer, der har indsendt 13D/G- eller 13F-formularer til Securities Exchange Commission (SEC). Disse institutioner har i alt 899,200 aktier. Største aktionærer omfatter LPL Financial LLC, Morgan Stanley, Bank Of America Corp /de/, Northwestern Mutual Wealth Management Co, Avantax Advisory Services, Inc., Truist Financial Corp, Wells Fargo & Company/mn, Royal Bank Of Canada, MAI Capital Management, and Great Diamond Partners, LLC .
Invesco Exchange-Traded Fund Trust - Invesco Building & Construction ETF (ARCA:PKB) institutionel ejerskabsstruktur viser aktuelle positioner i virksomheden efter institutioner og fonde, samt seneste ændringer i positionsstørrelse. Større aktionærer kan omfatte individuelle investorer, investeringsforeninger, hedgefonde eller institutioner. Skema 13D angiver, at investoren besidder (eller besidder) mere end 5 % af virksomheden og har til hensigt (eller har til hensigt at) aktivt at forfølge en ændring i forretningsstrategi. Skema 13G indikerer en passiv investering på over 5%.
The share price as of September 16, 2025 is 92,96 / share. Previously, on September 17, 2024, the share price was 76,99 / share. This represents an increase of 20,74% over that period.
Fondens stemningsscore
Fund Sentiment Score (fka Ownership Accumulation Score) finder de aktier, der bliver mest købt af fonde. Det er resultatet af en sofistikeret, multi-faktor kvantitativ model, der identificerer virksomheder med de højeste niveauer af institutionel akkumulering. Scoringsmodellen bruger en kombination af den samlede stigning i oplyste ejere, ændringerne i porteføljeallokeringer i disse ejere og andre målinger. Tallet går fra 0 til 100, hvor højere tal indikerer et højere niveau af akkumulering for sine jævnaldrende, og 50 er gennemsnittet.
Opdateringsfrekvens: Dagligt
Se Ownership Explorer, som giver en liste over højest rangerende virksomheder.
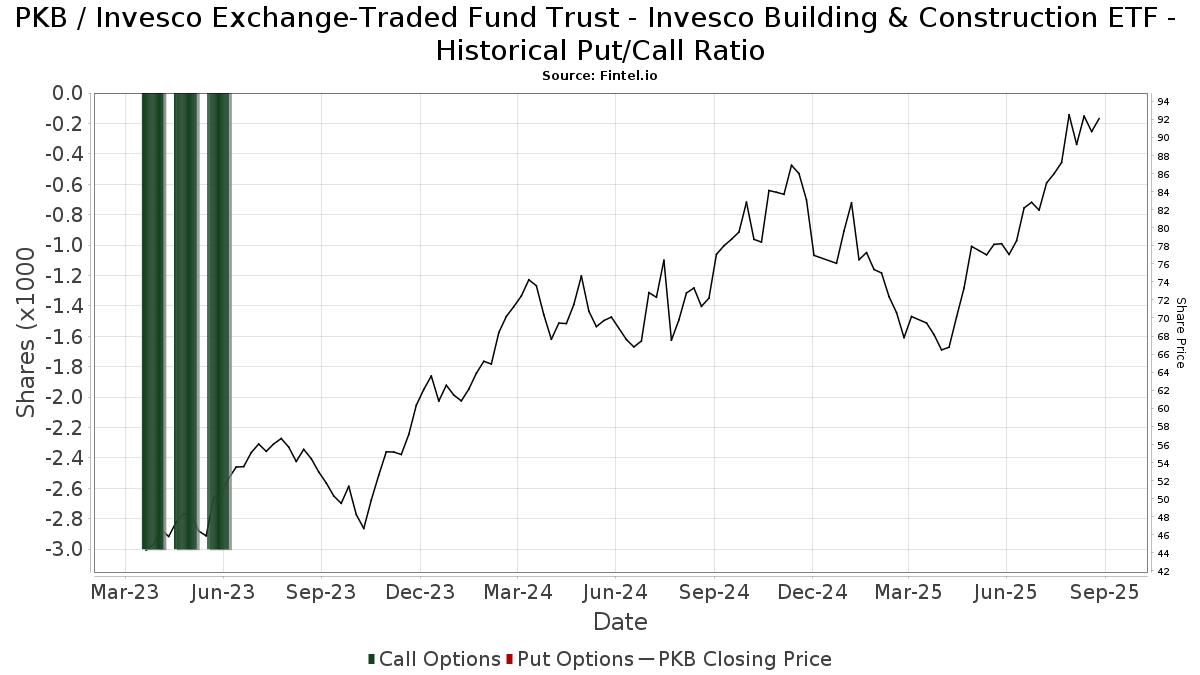
Institutionel Put/Call-forhold
Ud over at indberette standardaktie- og gældsudstedelser skal institutter med mere end 100 mill. aktiver under forvaltning også oplyse deres put- og call-optionsbeholdninger. Da salgsoptioner generelt indikerer negativ stemning, og købsoptioner indikerer positiv stemning, kan vi få en fornemmelse af den overordnede institutionelle stemning ved at plotte forholdet mellem put og kald. Diagrammet til højre viser det historiske put/call-forhold for dette instrument.
Brug af Put/Call Ratio som en indikator for investorernes stemning overvinder en af de vigtigste mangler ved at bruge totalt institutionelt ejerskab, som er, at en betydelig mængde af aktiver under forvaltning investeres passivt for at spore indekser. Passivt forvaltede fonde køber typisk ikke optioner, så indikatoren for put/call-forholdet følger mere nøje følelsen af aktivt forvaltede fonde.
13F og NPORT arkivering
Detaljer om 13F-arkivering er gratis. Detaljer om NP-ansøgninger kræver et premium-medlemskab. Grønne rækker angiver nye positioner. Røde rækker angiver lukkede positioner. Klik på linket ikon for at se den fulde transaktionshistorik.
Opgrader
for at låse premium-data op og eksportere til Excel ![]() .
.
| Fil dato | Kilde | Investor | Type | Gennemsnitlig pris (Øst) |
Aktier | Δ Aktier (%) |
Rapporteret Værdi ($1000) |
Δ Værdi (%) |
Port Alloc (%) |
|
|---|---|---|---|---|---|---|---|---|---|---|
| 2025-08-14 | 13F | Bank Of America Corp /de/ | 53.020 | -75,75 | 4.260 | -71,06 | ||||
| 2025-07-24 | 13F | WMG Financial Advisors, LLC | 3.684 | -4,95 | 296 | 13,85 | ||||
| 2025-08-06 | 13F | AE Wealth Management LLC | 45 | 0,00 | 4 | 0,00 | ||||
| 2025-08-14 | 13F | EP Wealth Advisors, Inc. | 6.855 | -42,28 | 551 | -31,16 | ||||
| 2025-07-11 | 13F | Farther Finance Advisors, LLC | 1.500 | 121 | ||||||
| 2025-08-14 | 13F | Wells Fargo & Company/mn | 40.920 | -34,58 | 3.288 | -21,94 | ||||
| 2025-08-13 | 13F | Rsm Us Wealth Management Llc | 3.692 | 0,00 | 297 | 19,35 | ||||
| 2025-08-15 | 13F | Morgan Stanley | 98.035 | -12,69 | 7.877 | 4,19 | ||||
| 2025-08-12 | 13F | Franklin Resources Inc | 810 | 9,02 | 65 | 30,00 | ||||
| 2025-05-02 | 13F | Apollon Wealth Management, LLC | 0 | -100,00 | 0 | |||||
| 2025-08-12 | 13F | O'shaughnessy Asset Management, Llc | 25 | 2 | ||||||
| 2025-08-15 | 13F | Kestra Advisory Services, LLC | 18.853 | -9,44 | 1.515 | 8,07 | ||||
| 2025-07-18 | 13F | Truist Financial Corp | 42.734 | -0,26 | 3.434 | 19,04 | ||||
| 2025-08-08 | 13F | Cetera Investment Advisers | 7.117 | -5,38 | 572 | 12,85 | ||||
| 2025-08-11 | 13F | Outlook Wealth Advisors, LLC | 0 | -100,00 | 0 | |||||
| 2025-08-14 | 13F | Hrt Financial Lp | 0 | -100,00 | 0 | |||||
| 2025-08-14 | 13F | Susquehanna International Group, Llp | 2.969 | -83,35 | 239 | -80,17 | ||||
| 2025-05-08 | 13F | BRYN MAWR TRUST Co | 0 | -100,00 | 0 | |||||
| 2025-08-11 | 13F | HighTower Advisors, LLC | 5.749 | -17,04 | 462 | -1,07 | ||||
| 2025-07-25 | 13F | Cwm, Llc | 14 | 0,00 | 0 | |||||
| 2025-07-22 | 13F | Accel Wealth Management | 6.248 | 17,71 | 502 | 40,62 | ||||
| 2025-08-13 | 13F | Summit Financial, LLC | 2.935 | 236 | ||||||
| 2025-07-22 | 13F | Wealthcare Advisory Partners LLC | 3.392 | -27,65 | 273 | -13,65 | ||||
| 2025-08-11 | 13F | Private Advisor Group, LLC | 3.435 | -0,89 | 276 | 18,03 | ||||
| 2025-08-14 | 13F | Wiley Bros.-aintree Capital, Llc | 4.961 | -8,42 | 399 | 9,34 | ||||
| 2025-08-07 | 13F | Ibex Wealth Advisors | 9.077 | -16,00 | 729 | 0,28 | ||||
| 2025-08-14 | 13F | Goldman Sachs Group Inc | 8.229 | -82,57 | 661 | -79,20 | ||||
| 2025-07-31 | 13F | Cambridge Investment Research Advisors, Inc. | 10.213 | -20,50 | 1 | |||||
| 2025-08-13 | 13F | Beacon Pointe Advisors, LLC | 3.226 | -43,59 | 259 | -32,73 | ||||
| 2025-08-13 | 13F | Colonial Trust Co / SC | 793 | 64 | ||||||
| 2025-08-06 | 13F | Founders Financial Securities Llc | 2.629 | 211 | ||||||
| 2025-08-13 | 13F | Northwestern Mutual Wealth Management Co | 52.542 | -9,79 | 4.222 | 7,65 | ||||
| 2025-07-11 | 13F | SILVER OAK SECURITIES, Inc | 11.012 | 0,81 | 885 | 20,44 | ||||
| 2025-08-13 | 13F | Transce3nd, LLC | 0 | -100,00 | 0 | |||||
| 2025-08-29 | 13F | Total Investment Management Inc | 3 | 0 | ||||||
| 2025-08-13 | 13F | Flow Traders U.s. Llc | 0 | -100,00 | 0 | |||||
| 2025-08-13 | 13F | IAG Wealth Partners, LLC | 127 | 0,00 | 10 | 25,00 | ||||
| 2025-08-05 | 13F | Advisors Preferred, LLC | 318 | 26 | ||||||
| 2025-08-11 | 13F | Principal Securities, Inc. | 56 | 0,00 | 4 | 0,00 | ||||
| 2025-08-01 | 13F | Envestnet Asset Management Inc | 9.041 | 36,69 | 726 | 63,15 | ||||
| 2025-08-14 | 13F | Two Sigma Securities, Llc | 0 | -100,00 | 0 | |||||
| 2025-04-29 | 13F | Riggs Asset Managment Co. Inc. | 0 | -100,00 | 0 | |||||
| 2025-05-08 | 13F | Private Advisory Group LLC | 0 | -100,00 | 0 | |||||
| 2025-07-30 | 13F | Evermay Wealth Management Llc | 125 | 0,00 | 10 | 25,00 | ||||
| 2025-09-04 | 13F/A | Advisor Group Holdings, Inc. | 12.689 | -7,46 | 1.020 | 10,40 | ||||
| 2025-05-15 | 13F | Qube Research & Technologies Ltd | 0 | -100,00 | 0 | |||||
| 2025-09-04 | 13F | ZynergyRetirementPlanningLLC | 0 | -100,00 | 0 | |||||
| 2025-08-14 | 13F | Royal Bank Of Canada | 30.983 | 43,02 | 2.489 | 70,60 | ||||
| 2025-05-16 | 13F | Coppell Advisory Solutions LLC | 0 | -100,00 | 0 | |||||
| 2025-05-13 | 13F | Bank Of Montreal /can/ | 0 | -100,00 | 0 | |||||
| 2025-08-14 | 13F | MGB Wealth Management, LLC | 250 | 0,00 | 20 | 25,00 | ||||
| 2025-08-12 | 13F | Global Retirement Partners, LLC | 920 | 8,36 | 74 | 14,06 | ||||
| 2025-08-04 | 13F | Northwest Financial Advisors | 2.854 | 229 | ||||||
| 2025-07-18 | 13F | PFG Investments, LLC | 3.282 | -1,44 | 264 | 17,41 | ||||
| 2025-08-06 | 13F | Commonwealth Equity Services, Llc | 8.726 | -17,00 | 1 | |||||
| 2025-08-14 | 13F | Bnp Paribas Arbitrage, Sa | 5.800 | -61,33 | 466 | -53,82 | ||||
| 2025-04-18 | 13F | Global Trust Asset Management, LLC | 0 | -100,00 | 0 | |||||
| 2025-08-14 | 13F | Comerica Bank | 530 | 43 | ||||||
| 2025-05-19 | 13F | Heck Capital Advisors, LLC | 0 | 0 | ||||||
| 2025-08-14 | 13F | Ameriprise Financial Inc | 26.188 | -12,35 | 2.104 | 4,62 | ||||
| 2025-05-06 | 13F | Venturi Wealth Management, LLC | 0 | -100,00 | 0 | -100,00 | ||||
| 2025-07-29 | 13F | Private Trust Co Na | 586 | 0,00 | 47 | 20,51 | ||||
| 2025-08-04 | 13F | Spire Wealth Management | 855 | -6,46 | 69 | 11,48 | ||||
| 2025-08-14 | 13F | Stifel Financial Corp | 3.199 | -5,02 | 257 | 13,72 | ||||
| 2025-04-10 | 13F | Hennion & Walsh Asset Management, Inc. | 0 | -100,00 | 0 | -100,00 | ||||
| 2025-04-22 | 13F | Minichmacgregor Wealth Management, Llc | 0 | -100,00 | 0 | |||||
| 2025-07-31 | 13F | Peterson Wealth Services | 4 | 0,00 | 0 | |||||
| 2025-08-14 | 13F | Fmr Llc | 4.796 | -2,91 | 385 | 15,96 | ||||
| 2025-08-14 | 13F | Citadel Advisors Llc | 3.074 | -87,92 | 247 | -85,64 | ||||
| 2025-08-14 | 13F | UBS Group AG | 19.400 | -0,86 | 1.559 | 18,30 | ||||
| 2025-04-22 | 13F | Nilsine Partners, LLC | 0 | -100,00 | 0 | |||||
| 2025-04-23 | 13F | Western Financial Corp/CA | 0 | -100,00 | 0 | |||||
| 2025-08-08 | 13F | Capital Investment Counsel, Inc | 14 | 0,00 | 1 | |||||
| 2025-08-14 | 13F | CoreCap Advisors, LLC | 45 | 0,00 | 4 | 0,00 | ||||
| 2025-08-14 | 13F | GWM Advisors LLC | 5.504 | -3,83 | 442 | 14,81 | ||||
| 2025-08-08 | 13F | Pnc Financial Services Group, Inc. | 3.630 | 0,00 | 292 | 19,26 | ||||
| 2025-08-05 | 13F | GPS Wealth Strategies Group, LLC | 387 | 0,00 | 31 | 19,23 | ||||
| 2025-04-08 | 13F | Parallel Advisors, LLC | 0 | -100,00 | 0 | -100,00 | ||||
| 2025-08-12 | 13F | Howe & Rusling Inc | 90 | 0,00 | 7 | 16,67 | ||||
| 2025-07-22 | 13F | DAVENPORT & Co LLC | 17.265 | 3,11 | 1.387 | 23,07 | ||||
| 2025-08-05 | 13F | Sigma Planning Corp | 2.646 | 213 | ||||||
| 2025-05-15 | 13F | Prospera Financial Services Inc | 0 | -100,00 | 0 | |||||
| 2025-08-12 | 13F | Proequities, Inc. | 0 | 0 | ||||||
| 2025-08-14 | 13F | Mariner, LLC | 5.301 | 5,26 | 426 | 25,37 | ||||
| 2025-08-13 | 13F | Mount Yale Investment Advisors, LLC | 660 | 53 | ||||||
| 2025-08-14 | 13F | KKM Financial LLC | 3.843 | 0,00 | 309 | 19,38 | ||||
| 2025-05-12 | 13F | Independent Advisor Alliance | 0 | -100,00 | 0 | |||||
| 2025-08-15 | 13F | Tower Research Capital LLC (TRC) | 4 | 0 | ||||||
| 2025-07-15 | 13F | Carr Financial Group Corp | 3.649 | -30,69 | 293 | -17,23 | ||||
| 2025-08-08 | NP | QALTX - Quantified Alternative Investment Fund Investor Class Shares | 318 | -34,70 | 26 | -3,85 | ||||
| 2025-07-18 | 13F | SOA Wealth Advisors, LLC. | 4.779 | 0,08 | 384 | 19,31 | ||||
| 2025-08-12 | 13F | LPL Financial LLC | 161.506 | -22,05 | 12.977 | -6,98 | ||||
| 2025-07-24 | 13F | Us Bancorp \de\ | 51 | 0,00 | 4 | 33,33 | ||||
| 2025-07-28 | 13F | Harbour Investments, Inc. | 155 | 0,00 | 12 | 20,00 | ||||
| 2025-08-14 | 13F | Jane Street Group, Llc | 0 | -100,00 | 0 | |||||
| 2025-08-12 | 13F | MAI Capital Management | 29.346 | -1,88 | 2.358 | 17,09 | ||||
| 2025-05-13 | 13F | Steward Partners Investment Advisory, Llc | 0 | -100,00 | 0 | |||||
| 2025-08-12 | 13F | one8zero8, LLC | 0 | -100,00 | 0 | |||||
| 2025-08-08 | 13F | Avantax Advisory Services, Inc. | 50.795 | 14,78 | 4.081 | 36,99 | ||||
| 2025-08-14 | 13F | Mml Investors Services, Llc | 5.818 | 16,87 | 0 | |||||
| 2025-05-15 | 13F | Baird Financial Group, Inc. | 0 | -100,00 | 0 | |||||
| 2025-07-17 | 13F | Janney Montgomery Scott LLC | 2.611 | 0 | ||||||
| 2025-08-14 | 13F | Raymond James Financial Inc | 19.932 | -23,52 | 1.602 | -8,72 | ||||
| 2025-07-16 | 13F | Crowley Wealth Management, Inc. | 307 | 0,00 | 25 | 20,00 | ||||
| 2025-08-13 | 13F | Jones Financial Companies Lllp | 11.924 | 12,98 | 962 | 35,54 | ||||
| 2025-08-14 | 13F | Boston Private Wealth Llc | 0 | -100,00 | 0 | |||||
| 2025-08-13 | 13F | Great Diamond Partners, LLC | 26.738 | -1,60 | 2.148 | 17,44 | ||||
| 2025-07-10 | 13F | Focus Financial Network, Inc. | 3.162 | 3,77 | 254 | 23,90 | ||||
| 2025-08-13 | 13F | Russell Investments Group, Ltd. | 200 | 0,00 | 16 | 23,08 |