Grundlæggende statistik
| Institutionelle ejere | 113 total, 112 long only, 0 short only, 1 long/short - change of -6,61% MRQ |
| Gennemsnitlig porteføljeallokering | 0.0084 % - change of -18,13% MRQ |
| Institutionelle aktier (lange) | 2.982.786 (ex 13D/G) - change of -0,04MM shares -1,34% MRQ |
| Institutionel værdi (lang) | $ 58.904 USD ($1000) |
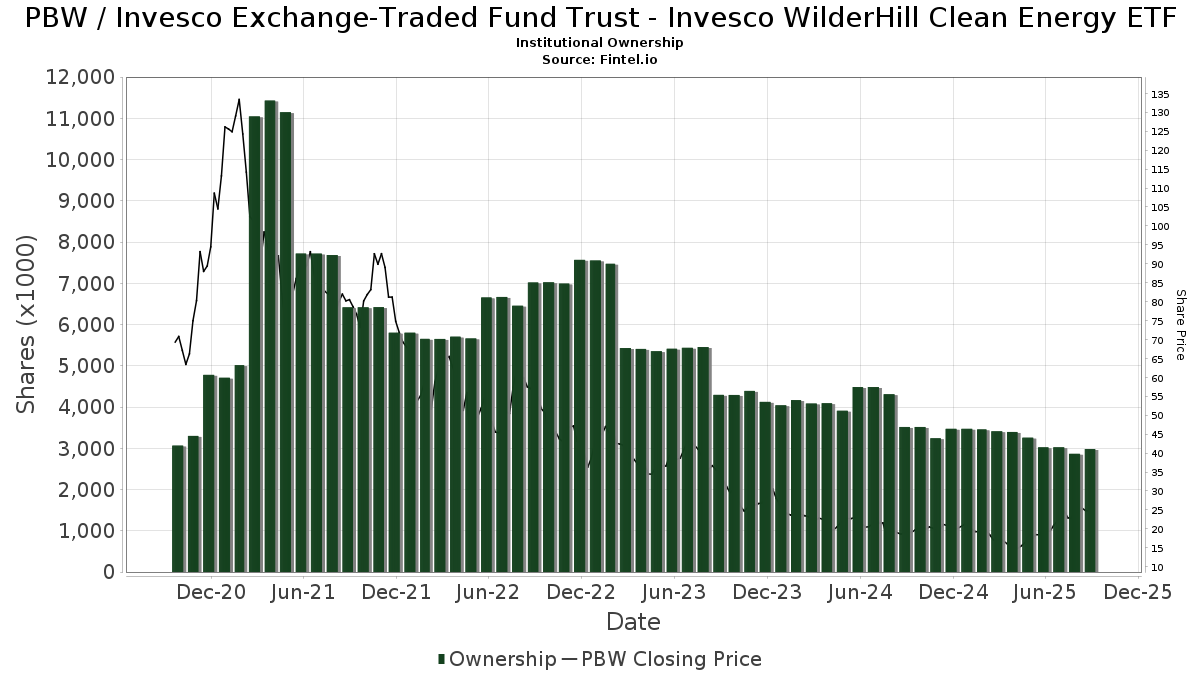
Institutionelt ejerskab og aktionærer
Invesco Exchange-Traded Fund Trust - Invesco WilderHill Clean Energy ETF (US:PBW) har 113 institutionelle ejere og aktionærer, der har indsendt 13D/G- eller 13F-formularer til Securities Exchange Commission (SEC). Disse institutioner har i alt 2,982,786 aktier. Største aktionærer omfatter Morgan Stanley, Bank Of America Corp /de/, Bnp Paribas Arbitrage, Sa, Allianz Se, Goldman Sachs Group Inc, Raymond James Financial Inc, Susquehanna International Group, Llp, Envestnet Portfolio Solutions, Inc., UBS Group AG, and Family Firm, Inc. .
Invesco Exchange-Traded Fund Trust - Invesco WilderHill Clean Energy ETF (ARCA:PBW) institutionel ejerskabsstruktur viser aktuelle positioner i virksomheden efter institutioner og fonde, samt seneste ændringer i positionsstørrelse. Større aktionærer kan omfatte individuelle investorer, investeringsforeninger, hedgefonde eller institutioner. Skema 13D angiver, at investoren besidder (eller besidder) mere end 5 % af virksomheden og har til hensigt (eller har til hensigt at) aktivt at forfølge en ændring i forretningsstrategi. Skema 13G indikerer en passiv investering på over 5%.
The share price as of September 16, 2025 is 26,47 / share. Previously, on September 17, 2024, the share price was 19,54 / share. This represents an increase of 35,47% over that period.
Fondens stemningsscore
Fund Sentiment Score (fka Ownership Accumulation Score) finder de aktier, der bliver mest købt af fonde. Det er resultatet af en sofistikeret, multi-faktor kvantitativ model, der identificerer virksomheder med de højeste niveauer af institutionel akkumulering. Scoringsmodellen bruger en kombination af den samlede stigning i oplyste ejere, ændringerne i porteføljeallokeringer i disse ejere og andre målinger. Tallet går fra 0 til 100, hvor højere tal indikerer et højere niveau af akkumulering for sine jævnaldrende, og 50 er gennemsnittet.
Opdateringsfrekvens: Dagligt
Se Ownership Explorer, som giver en liste over højest rangerende virksomheder.
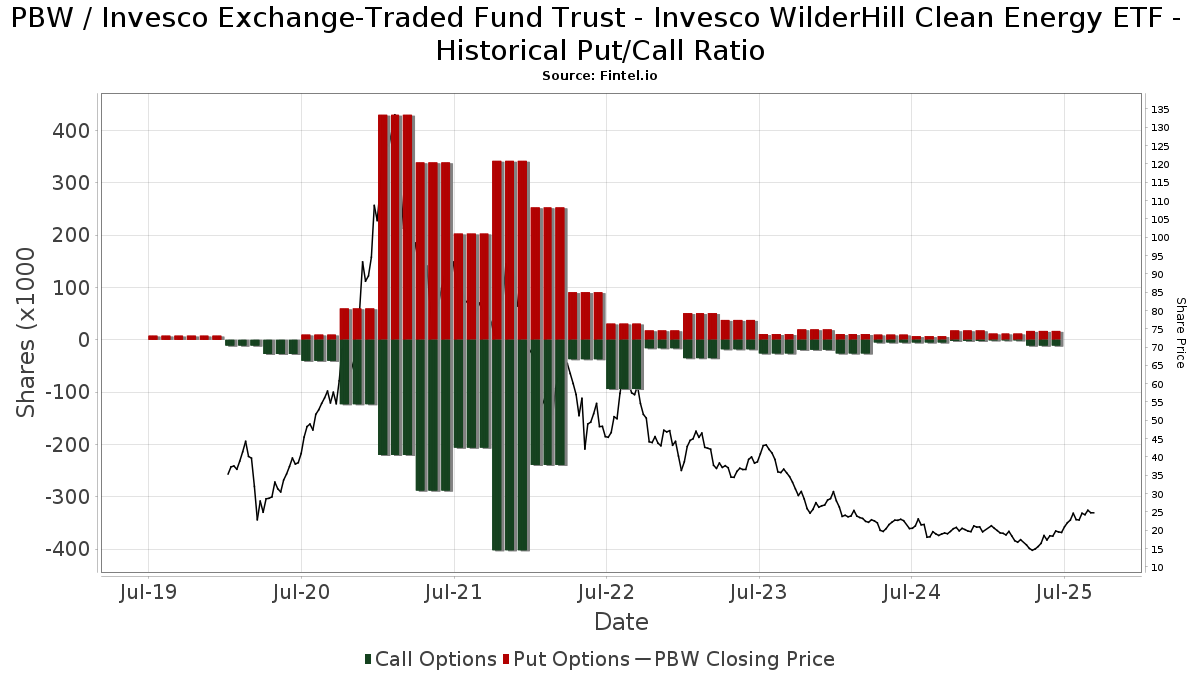
Institutionel Put/Call-forhold
Ud over at indberette standardaktie- og gældsudstedelser skal institutter med mere end 100 mill. aktiver under forvaltning også oplyse deres put- og call-optionsbeholdninger. Da salgsoptioner generelt indikerer negativ stemning, og købsoptioner indikerer positiv stemning, kan vi få en fornemmelse af den overordnede institutionelle stemning ved at plotte forholdet mellem put og kald. Diagrammet til højre viser det historiske put/call-forhold for dette instrument.
Brug af Put/Call Ratio som en indikator for investorernes stemning overvinder en af de vigtigste mangler ved at bruge totalt institutionelt ejerskab, som er, at en betydelig mængde af aktiver under forvaltning investeres passivt for at spore indekser. Passivt forvaltede fonde køber typisk ikke optioner, så indikatoren for put/call-forholdet følger mere nøje følelsen af aktivt forvaltede fonde.
13F og NPORT arkivering
Detaljer om 13F-arkivering er gratis. Detaljer om NP-ansøgninger kræver et premium-medlemskab. Grønne rækker angiver nye positioner. Røde rækker angiver lukkede positioner. Klik på linket ikon for at se den fulde transaktionshistorik.
Opgrader
for at låse premium-data op og eksportere til Excel ![]() .
.
| Fil dato | Kilde | Investor | Type | Gennemsnitlig pris (Øst) |
Aktier | Δ Aktier (%) |
Rapporteret Værdi ($1000) |
Δ Værdi (%) |
Port Alloc (%) |
|
|---|---|---|---|---|---|---|---|---|---|---|
| 2025-08-18 | 13F | Geneos Wealth Management Inc. | 126 | 0,00 | 3 | 100,00 | ||||
| 2025-08-04 | 13F | Center for Financial Planning, Inc. | 160 | 0,00 | 3 | 50,00 | ||||
| 2025-08-07 | 13F | LFA - Lugano Financial Advisors SA | 0 | -100,00 | 0 | |||||
| 2025-08-07 | 13F | Flagship Wealth Advisors, Llc | 580 | 104,23 | 12 | 175,00 | ||||
| 2025-08-12 | 13F | LPL Financial LLC | 52.579 | 5,83 | 1.047 | 33,89 | ||||
| 2025-08-14 | 13F | Wells Fargo & Company/mn | 30.909 | -20,71 | 616 | 0,33 | ||||
| 2025-08-18 | 13F | Pacific Center for Financial Services | 201 | 0,00 | 4 | 33,33 | ||||
| 2025-05-14 | 13F | Stifel Financial Corp | 0 | -100,00 | 0 | |||||
| 2025-07-25 | 13F | NorthRock Partners, LLC | 850 | 0,00 | 17 | 23,08 | ||||
| 2025-08-08 | 13F | Emerald Investment Partners, Llc | 124 | 0,00 | 2 | 100,00 | ||||
| 2025-08-12 | 13F | BlackRock, Inc. | 6.408 | 148,18 | 128 | 217,50 | ||||
| 2025-08-15 | 13F | Morgan Stanley | 747.941 | 2,02 | 14.899 | 29,12 | ||||
| 2025-04-01 | 13F | Modus Advisors, LLC | 0 | -100,00 | 0 | -100,00 | ||||
| 2025-08-14 | 13F | Bnp Paribas Arbitrage, Sa | 299.315 | 106,99 | 5.962 | 161,95 | ||||
| 2025-07-25 | 13F | Community Bank, N.A. | 323 | 0,00 | 6 | 20,00 | ||||
| 2025-08-14 | 13F | Comerica Bank | 2.984 | 63,87 | 59 | 110,71 | ||||
| 2025-08-14 | 13F | Royal Bank Of Canada | 46.150 | 95,27 | 919 | 147,04 | ||||
| 2025-04-29 | 13F | Hm Payson & Co | 1.004 | 0,00 | 16 | -25,00 | ||||
| 2025-07-24 | 13F | Jfs Wealth Advisors, Llc | 0 | -100,00 | 0 | |||||
| 2025-08-14 | 13F | GWM Advisors LLC | 188 | 0,00 | 4 | 50,00 | ||||
| 2025-08-08 | 13F | MTM Investment Management, LLC | 55 | 0,00 | 1 | |||||
| 2025-05-13 | 13F | Aptus Capital Advisors, LLC | 0 | -100,00 | 0 | |||||
| 2025-08-08 | 13F | Glassman Wealth Services | 572 | 11 | ||||||
| 2025-07-24 | 13F | IFP Advisors, Inc | 758 | 2,85 | 15 | 36,36 | ||||
| 2025-07-25 | 13F | Natural Investments, Llc | 0 | -100,00 | 0 | |||||
| 2025-05-14 | 13F | Jane Street Group, Llc | 0 | -100,00 | 0 | |||||
| 2025-08-12 | 13F | MAI Capital Management | 5.296 | -19,39 | 106 | 1,94 | ||||
| 2025-07-15 | 13F | North Star Investment Management Corp. | 1.470 | 0,00 | 29 | 26,09 | ||||
| 2025-08-07 | 13F | CENTRAL TRUST Co | 200 | 0,00 | 4 | 0,00 | ||||
| 2025-08-05 | 13F | EPG Wealth Management LLC | 0 | -100,00 | 0 | |||||
| 2025-08-12 | 13F | Global Retirement Partners, LLC | 256 | 0,00 | 5 | 0,00 | ||||
| 2025-08-14 | 13F | Goldman Sachs Group Inc | 261.750 | 10,17 | 5.214 | 39,45 | ||||
| 2025-07-08 | 13F | Prism Advisors, Inc. | 10.638 | 3,18 | 212 | 30,25 | ||||
| 2025-07-10 | 13F | Piscataqua Savings Bank | 71 | 0,00 | 1 | 0,00 | ||||
| 2025-08-08 | 13F | Pnc Financial Services Group, Inc. | 1.929 | 0,00 | 38 | 26,67 | ||||
| 2025-08-12 | 13F | Jpmorgan Chase & Co | 1.415 | 42,93 | 28 | 86,67 | ||||
| 2025-08-06 | 13F | S&t Bank/pa | 140 | 0,00 | 3 | 0,00 | ||||
| 2025-08-08 | 13F | Hartland & Co., LLC | 100 | 0,00 | 2 | 0,00 | ||||
| 2025-08-07 | 13F | 1620 Investment Advisors, Inc. | 351 | 0,00 | 7 | 20,00 | ||||
| 2025-08-12 | 13F | Ameritas Investment Partners, Inc. | 197 | 0,00 | 4 | 0,00 | ||||
| 2025-08-14 | 13F | UBS Group AG | 69.598 | 102,67 | 1.386 | 156,67 | ||||
| 2025-08-11 | 13F | Citigroup Inc | 29.118 | 24,71 | 580 | 58,04 | ||||
| 2025-08-18 | 13F/A | National Bank Of Canada /fi/ | 2.592 | 22,55 | 52 | 54,55 | ||||
| 2025-07-07 | 13F | Thurston, Springer, Miller, Herd & Titak, Inc. | 30 | 0,00 | 1 | |||||
| 2025-07-08 | 13F | Parallel Advisors, LLC | 3 | -96,34 | 0 | -100,00 | ||||
| 2025-08-08 | 13F | Your Advocates Ltd., LLP | 131 | 0,00 | 3 | 0,00 | ||||
| 2025-07-31 | 13F | Wealthfront Advisers Llc | 24.644 | -13,34 | 491 | 9,62 | ||||
| 2025-08-11 | 13F | Wealthspire Advisors, LLC | 10.295 | -23,38 | 205 | -2,84 | ||||
| 2025-08-14 | 13F | Bank Of America Corp /de/ | 399.923 | -6,36 | 7.966 | 18,51 | ||||
| 2025-08-15 | 13F | Provenance Wealth Advisors, LLC | 0 | -100,00 | 0 | -100,00 | ||||
| 2025-08-08 | 13F | Fortis Group Advisors, LLC | 133 | 0,00 | 3 | 0,00 | ||||
| 2025-08-11 | 13F | Rothschild Investment Llc | 15 | 0,00 | 0 | |||||
| 2025-08-08 | 13F | Tanglewood Legacy Advisors, LLC | 1.223 | 0,16 | 24 | 26,32 | ||||
| 2025-08-14 | 13F | Federation des caisses Desjardins du Quebec | 1.205 | -10,41 | 24 | 14,29 | ||||
| 2025-08-08 | 13F | Cetera Investment Advisers | 13.880 | 8,97 | 276 | 38,00 | ||||
| 2025-07-24 | 13F | Stonebridge Financial Group, LLC | 0 | -100,00 | 0 | |||||
| 2025-08-13 | 13F | Kayne Anderson Rudnick Investment Management Llc | 125 | 0,00 | 2 | 100,00 | ||||
| 2025-08-08 | 13F | Family Firm, Inc. | 59.559 | -5,55 | 1.186 | 19,56 | ||||
| 2025-08-29 | 13F | Evolution Wealth Management Inc. | 311 | 6 | ||||||
| 2025-08-14 | 13F | Susquehanna International Group, Llp | Put | 17.700 | 353 | |||||
| 2025-08-14 | 13F | Susquehanna International Group, Llp | 73.535 | 28,20 | 1.465 | 62,31 | ||||
| 2025-05-15 | 13F | D. E. Shaw & Co., Inc. | 0 | -100,00 | 0 | |||||
| 2025-08-14 | 13F | Susquehanna International Group, Llp | Call | 11.600 | 231 | |||||
| 2025-07-10 | 13F | Moller Financial Services | 37.709 | 13,44 | 751 | 43,59 | ||||
| 2025-08-13 | 13F | Quadrant Capital Group Llc | 0 | -100,00 | 0 | |||||
| 2025-08-15 | 13F | Tower Research Capital LLC (TRC) | 43.126 | 859 | ||||||
| 2025-08-14 | 13F | Citadel Advisors Llc | Put | 0 | -100,00 | 0 | ||||
| 2025-05-12 | 13F | Founders Financial Alliance, LLC | 0 | -100,00 | 0 | |||||
| 2025-07-21 | 13F | Ameritas Advisory Services, LLC | 180 | 4 | ||||||
| 2025-07-15 | 13F | Retirement Income Solutions, Inc | 0 | -100,00 | 0 | |||||
| 2025-08-12 | 13F | Proequities, Inc. | 0 | 0 | ||||||
| 2025-04-29 | 13F | Harel Insurance Investments & Financial Services Ltd. | 0 | -100,00 | 0 | |||||
| 2025-05-14 | 13F | Legend Financial Advisors, Inc. | 0 | -100,00 | 0 | |||||
| 2025-07-15 | 13F | Financial Management Professionals, Inc. | 15 | 0,00 | 0 | |||||
| 2025-08-08 | 13F | Allianz Se | 264.068 | 20,54 | 5.260 | 52,55 | ||||
| 2025-08-11 | 13F | Principal Securities, Inc. | 25 | 0,00 | 0 | |||||
| 2025-08-13 | 13F | Northwestern Mutual Wealth Management Co | 3.236 | -9,30 | 64 | 14,29 | ||||
| 2025-08-14 | 13F | Citadel Advisors Llc | Call | 0 | -100,00 | 0 | ||||
| 2025-07-03 | 13F | Garde Capital, Inc. | 11 | 0,00 | 0 | |||||
| 2025-07-31 | 13F | Sage Mountain Advisors LLC | 4 | 0,00 | 0 | |||||
| 2025-08-14 | 13F/A | Barclays Plc | 770 | 0,00 | 0 | |||||
| 2025-07-21 | 13F | Mirae Asset Global Investments Co., Ltd. | 4.400 | 88 | ||||||
| 2025-07-23 | 13F | Hager Investment Management Services, Llc | 167 | 0,00 | 3 | 50,00 | ||||
| 2025-08-01 | 13F | Envestnet Asset Management Inc | 13.656 | -3,58 | 272 | 22,52 | ||||
| 2025-08-07 | 13F | Allworth Financial LP | 1.746 | 1.095,89 | 35 | 1.600,00 | ||||
| 2025-04-30 | 13F | Cerity Partners LLC | 0 | -100,00 | 0 | |||||
| 2025-07-11 | 13F | Farther Finance Advisors, LLC | 66 | 0,00 | 1 | 0,00 | ||||
| 2025-07-17 | 13F | City Holding Co | 0 | -100,00 | 0 | |||||
| 2025-07-14 | 13F | UMA Financial Services, Inc. | 736 | 5,29 | 15 | 27,27 | ||||
| 2025-07-17 | 13F | Elwood & Goetz Wealth Advisory Group, LLC | 17.316 | 345 | ||||||
| 2025-04-29 | 13F | Capital Investment Advisory Services, LLC | 0 | -100,00 | 0 | |||||
| 2025-07-16 | 13F/A | CX Institutional | 8.935 | -80,83 | 0 | |||||
| 2025-05-09 | 13F | Evolution Wealth Advisors, LLC | 0 | -100,00 | 0 | |||||
| 2025-07-14 | 13F | Armstrong Advisory Group, Inc | 30 | 0,00 | 1 | |||||
| 2025-07-24 | 13F | Trust Co Of Toledo Na /oh/ | 24 | 0 | ||||||
| 2025-09-04 | 13F/A | Advisor Group Holdings, Inc. | 39.829 | 3,89 | 793 | 31,51 | ||||
| 2025-07-09 | 13F | Breakwater Investment Management | 331 | 0,00 | 7 | 20,00 | ||||
| 2025-07-29 | 13F | Activest Wealth Management | 300 | 0,00 | 6 | 25,00 | ||||
| 2025-08-14 | 13F | Raymond James Financial Inc | 116.310 | -14,94 | 2.317 | 7,62 | ||||
| 2025-08-14 | 13F | Fmr Llc | 225 | -80,33 | 4 | -77,78 | ||||
| 2025-08-05 | 13F | Simplex Trading, Llc | 0 | -100,00 | 0 | |||||
| 2025-08-06 | 13F | First Horizon Advisors, Inc. | 712 | -10,33 | 14 | 16,67 | ||||
| 2025-08-11 | 13F | Tidemark, LLC | 0 | -100,00 | 0 | |||||
| 2025-07-16 | 13F | TigerOak Management, L.L.C. | 18.079 | -3,71 | 360 | 22,03 | ||||
| 2025-04-23 | 13F | Spire Wealth Management | 0 | -100,00 | 0 | |||||
| 2025-07-28 | 13F | BRYN MAWR TRUST Co | 188 | -34,72 | 4 | -25,00 | ||||
| 2025-05-15 | 13F | Alpine Global Management, LLC | 0 | -100,00 | 0 | -100,00 | ||||
| 2025-08-06 | 13F | SOUTH STATE Corp | 134 | 0,00 | 3 | 0,00 | ||||
| 2025-08-05 | 13F | Bank Of Montreal /can/ | 96 | 2 | ||||||
| 2025-08-18 | 13F | Hollencrest Capital Management | 35 | 0,00 | 1 | |||||
| 2025-08-06 | 13F | Commonwealth Equity Services, Llc | 16.595 | -59,90 | 0 | |||||
| 2025-07-29 | 13F | Private Trust Co Na | 0 | -100,00 | 0 | |||||
| 2025-07-18 | 13F | Bartlett & Co. Wealth Management Llc | 0 | -100,00 | 0 | |||||
| 2025-04-22 | 13F | Cambridge Investment Research Advisors, Inc. | 0 | -100,00 | 0 | |||||
| 2025-05-05 | 13F | Nwam Llc | 0 | -100,00 | 0 | |||||
| 2025-07-17 | 13F | Vermillion Wealth Management, Inc. | 464 | 0,22 | 9 | 28,57 | ||||
| 2025-08-08 | 13F | Gts Securities Llc | 44.093 | 878 | ||||||
| 2025-07-18 | 13F | SOA Wealth Advisors, LLC. | 368 | 0,27 | 7 | 40,00 | ||||
| 2025-07-24 | 13F | Us Bancorp \de\ | 114 | -24,00 | 2 | 0,00 | ||||
| 2025-08-13 | 13F | Quadrature Capital Ltd | 0 | -100,00 | 0 | |||||
| 2025-08-13 | 13F | Continuum Advisory, LLC | 0 | -100,00 | 0 | |||||
| 2025-07-21 | 13F | Kennebec Savings Bank | 303 | 0,00 | 6 | 50,00 | ||||
| 2025-08-13 | 13F | Mount Yale Investment Advisors, LLC | 260 | 5 | ||||||
| 2025-08-14 | 13F | Hrt Financial Lp | 0 | -100,00 | 0 | |||||
| 2025-08-13 | 13F | Millstone Evans Group, LLC | 357 | 0,00 | 7 | 40,00 | ||||
| 2025-08-06 | 13F | AE Wealth Management LLC | 10 | -98,31 | 0 | -100,00 | ||||
| 2025-08-12 | 13F | Steward Partners Investment Advisory, Llc | 3.505 | 0,00 | 70 | 25,45 | ||||
| 2025-07-30 | 13F | Financial Perspectives, Inc | 581 | 0,00 | 12 | 22,22 | ||||
| 2025-08-14 | 13F | McIlrath & Eck, LLC | 590 | 0,17 | 12 | 22,22 | ||||
| 2025-08-19 | 13F | Newbridge Financial Services Group, Inc. | 7 | 0,00 | 0 | |||||
| 2025-07-16 | 13F | Register Financial Advisors LLC | 65 | 0,00 | 1 | 0,00 | ||||
| 2025-07-17 | 13F | Albion Financial Group /ut | 1.397 | 0,00 | 28 | 28,57 | ||||
| 2025-08-14 | 13F | Ameriprise Financial Inc | 18.329 | -21,96 | 365 | -1,08 | ||||
| 2025-07-24 | 13F | Bernard Wealth Management Corp. | 12 | -40,00 | 0 | |||||
| 2025-05-15 | 13F | Citadel Advisors Llc | 0 | -100,00 | 0 | |||||
| 2025-05-15 | 13F | Bnp Paribas | 0 | -100,00 | 0 | |||||
| 2025-08-05 | 13F | GPS Wealth Strategies Group, LLC | 314 | -11,55 | 6 | 20,00 | ||||
| 2025-08-13 | 13F | Johnson Financial Group, Inc. | 2.087 | 42 | ||||||
| 2025-08-14 | 13F | EP Wealth Advisors, Inc. | 7.217 | -4,75 | 144 | 20,17 | ||||
| 2025-07-10 | 13F | Tompkins Financial Corp | 0 | -100,00 | 0 | |||||
| 2025-08-12 | 13F | Tradition Wealth Management, LLC | 11.949 | -5,42 | 238 | 20,20 | ||||
| 2025-08-12 | 13F | New Republic Capital, LLC | 41 | 0,00 | 1 | |||||
| 2025-07-16 | 13F | Townsend Asset Management Corp /nc/ /adv | 740 | -73,17 | 15 | -67,44 | ||||
| 2025-07-29 | 13F | John G Ullman & Associates Inc | 0 | -100,00 | 0 | |||||
| 2025-07-10 | 13F | Wealth Enhancement Advisory Services, Llc | 34.623 | 37,13 | 749 | 88,41 | ||||
| 2025-07-28 | 13F | Harbour Investments, Inc. | 158 | -16,40 | 3 | 50,00 | ||||
| 2025-08-01 | 13F | Motco | 2.245 | 0,00 | 51 | 45,71 | ||||
| 2025-08-19 | 13F | Asset Dedication, LLC | 46 | 0,00 | 1 | |||||
| 2025-07-25 | 13F | Envestnet Portfolio Solutions, Inc. | 70.530 | -15,37 | 1.405 | 7,09 | ||||
| 2025-08-12 | 13F | Howe & Rusling Inc | 4.060 | -35,55 | 81 | -19,19 | ||||
| 2025-08-11 | 13F | TD Waterhouse Canada Inc. | 54 | 0,00 | 1 | |||||
| 2025-07-18 | 13F | Truist Financial Corp | 27.824 | 7,83 | 554 | 36,45 | ||||
| 2025-08-12 | 13F | Wood Tarver Financial Group, LLC | 29 | 0,00 | 0 |
Other Listings
| MX:PBW |