Grundlæggende statistik
| Institutionelle ejere | 72 total, 72 long only, 0 short only, 0 long/short - change of -2,74% MRQ |
| Gennemsnitlig porteføljeallokering | 0.0226 % - change of -52,41% MRQ |
| Institutionelle aktier (lange) | 7.827.580 (ex 13D/G) - change of 0,12MM shares 1,55% MRQ |
| Institutionel værdi (lang) | $ 44.785 USD ($1000) |
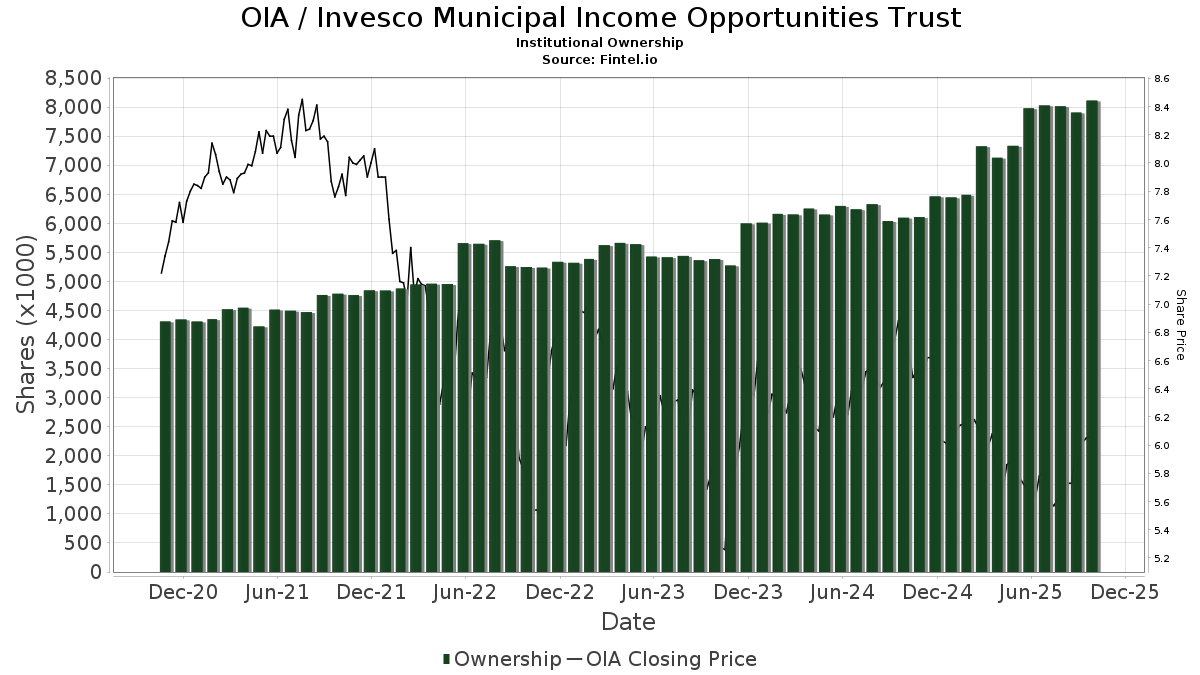
Institutionelt ejerskab og aktionærer
Invesco Municipal Income Opportunities Trust (US:OIA) har 72 institutionelle ejere og aktionærer, der har indsendt 13D/G- eller 13F-formularer til Securities Exchange Commission (SEC). Disse institutioner har i alt 7,827,580 aktier. Største aktionærer omfatter Hennion & Walsh Asset Management, Inc., Guggenheim Capital Llc, Bank Of America Corp /de/, Raymond James Financial Inc, Ameriprise Financial Inc, Morgan Stanley, Wells Fargo & Company/mn, Van Eck Associates Corp, Commonwealth Equity Services, Llc, and UBS Group AG .
Invesco Municipal Income Opportunities Trust (NYSE:OIA) institutionel ejerskabsstruktur viser aktuelle positioner i virksomheden efter institutioner og fonde, samt seneste ændringer i positionsstørrelse. Større aktionærer kan omfatte individuelle investorer, investeringsforeninger, hedgefonde eller institutioner. Skema 13D angiver, at investoren besidder (eller besidder) mere end 5 % af virksomheden og har til hensigt (eller har til hensigt at) aktivt at forfølge en ændring i forretningsstrategi. Skema 13G indikerer en passiv investering på over 5%.
The share price as of April 10, 2026 is 6,17 / share. Previously, on April 14, 2025, the share price was 5,70 / share. This represents an increase of 8,25% over that period.
Fondens stemningsscore
Fund Sentiment Score (fka Ownership Accumulation Score) finder de aktier, der bliver mest købt af fonde. Det er resultatet af en sofistikeret, multi-faktor kvantitativ model, der identificerer virksomheder med de højeste niveauer af institutionel akkumulering. Scoringsmodellen bruger en kombination af den samlede stigning i oplyste ejere, ændringerne i porteføljeallokeringer i disse ejere og andre målinger. Tallet går fra 0 til 100, hvor højere tal indikerer et højere niveau af akkumulering for sine jævnaldrende, og 50 er gennemsnittet.
Opdateringsfrekvens: Dagligt
Se Ownership Explorer, som giver en liste over højest rangerende virksomheder.
AI+ Ask Fintel’s AI assistant about Invesco Municipal Income Opportunities Trust.
Select a question to share a public post with an AI-crafted answer.
Thinking of good questions…
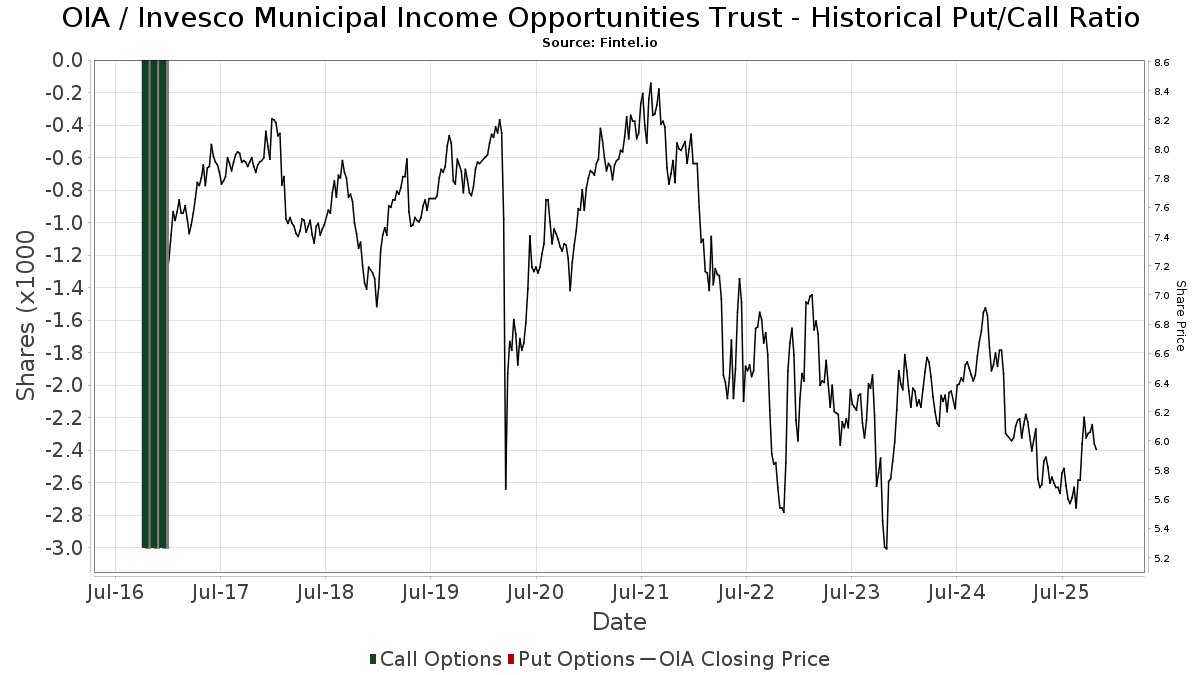
Institutionel Put/Call-forhold
Ud over at indberette standardaktie- og gældsudstedelser skal institutter med mere end 100 mill. aktiver under forvaltning også oplyse deres put- og call-optionsbeholdninger. Da salgsoptioner generelt indikerer negativ stemning, og købsoptioner indikerer positiv stemning, kan vi få en fornemmelse af den overordnede institutionelle stemning ved at plotte forholdet mellem put og kald. Diagrammet til højre viser det historiske put/call-forhold for dette instrument.
Brug af Put/Call Ratio som en indikator for investorernes stemning overvinder en af de vigtigste mangler ved at bruge totalt institutionelt ejerskab, som er, at en betydelig mængde af aktiver under forvaltning investeres passivt for at spore indekser. Passivt forvaltede fonde køber typisk ikke optioner, så indikatoren for put/call-forholdet følger mere nøje følelsen af aktivt forvaltede fonde.
13F og NPORT arkivering
Detaljer om 13F-arkivering er gratis. Detaljer om NP-ansøgninger kræver et premium-medlemskab. Grønne rækker angiver nye positioner. Røde rækker angiver lukkede positioner. Klik på linket ikon for at se den fulde transaktionshistorik.
Opgrader
for at låse premium-data op og eksportere til Excel ![]() .
.
| Fil dato | Kilde | Investor | Type | Gennemsnitlig pris (Øst) |
Aktier | Δ Aktier (%) |
Rapporteret Værdi ($1000) |
Δ Værdi (%) |
Port Alloc (%) |
|
|---|---|---|---|---|---|---|---|---|---|---|
| 2026-01-27 | 13F | Evergreen Capital Management Llc | 12.914 | 78 | ||||||
| 2026-02-05 | 13F | Burford Brothers, Inc. | 34.470 | 0,00 | 207 | 0,00 | ||||
| 2026-02-13 | 13F | Van Eck Associates Corp | 271.827 | 13,08 | 2 | 0,00 | ||||
| 2026-01-16 | 13F | Genesee Capital Advisors, LLC | 17.830 | 0,00 | 107 | 0,00 | ||||
| 2026-02-17 | 13F | Royal Bank Of Canada | 37.609 | -20,76 | 226 | -20,98 | ||||
| 2026-02-12 | 13F | Commonwealth Equity Services, Llc | 246.474 | -1,20 | 1.481 | 148.000,00 | ||||
| 2026-02-13 | 13F | Entrewealth, Llc | 10.736 | 0,00 | 67 | 3,13 | ||||
| 2026-02-17 | 13F | Ameriprise Financial Inc | 562.259 | -0,52 | 3.471 | 1,85 | ||||
| 2026-01-23 | 13F | Nbt Bank N A /ny | 1.824 | 0,00 | 11 | 0,00 | ||||
| 2026-02-13 | 13F | Morgan Stanley | 406.161 | -8,13 | 2.441 | -8,41 | ||||
| 2025-11-14 | 13F | Horizon Kinetics Asset Management Llc | 0 | -100,00 | 0 | |||||
| 2026-02-17 | 13F | DV Trading LLC | 1 | 0 | ||||||
| 2026-02-05 | 13F | Cornerstone Wealth Management, LLC | 11.064 | 0,00 | 66 | 0,00 | ||||
| 2026-02-18 | 13F | Garton & Associates Financial Advisors LLC | 6.359 | 38 | ||||||
| 2025-11-14 | 13F | Rivernorth Capital Management, Llc | 0 | -100,00 | 0 | |||||
| 2026-04-06 | 13F | Highline Wealth Partners Llc | 600 | 4 | ||||||
| 2026-02-17 | 13F | Susquehanna International Group, Llp | 18.611 | -2,18 | 112 | -2,63 | ||||
| 2026-02-06 | 13F | Global Retirement Partners, LLC | 2.400 | 0,00 | 14 | 0,00 | ||||
| 2026-02-06 | 13F | Pnc Financial Services Group, Inc. | 201.154 | 51,36 | 1.209 | 50,81 | ||||
| 2025-11-04 | 13F | Jones Financial Companies Lllp | 0 | -100,00 | 0 | -100,00 | ||||
| 2026-01-22 | 13F | Phoenix Wealth Advisors | 11.235 | 0,00 | 68 | 0,00 | ||||
| 2026-02-05 | 13F | Everstar Asset Management, LLC | 42.478 | -3,28 | 255 | -3,41 | ||||
| 2026-01-29 | 13F | Concurrent Investment Advisors, LLC | 25.646 | 0,00 | 154 | 0,00 | ||||
| 2026-02-05 | 13F | Cambridge Investment Research Advisors, Inc. | 27.650 | -3,86 | 0 | |||||
| 2026-02-06 | 13F | Keudell/Morrison Wealth Management | 0 | -100,00 | 0 | |||||
| 2025-11-12 | 13F | Ameriflex Group, Inc. | 0 | -100,00 | 0 | |||||
| 2026-02-06 | 13F | HighTower Advisors, LLC | 55.108 | 1,47 | 331 | 1,22 | ||||
| 2026-02-12 | 13F | Nuveen, LLC | 15.969 | 96 | ||||||
| 2026-01-20 | 13F | Savvy Advisors, Inc. | 80.050 | -10,59 | 481 | -10,76 | ||||
| 2026-03-03 | 13F | NWF Advisory Services Inc. | 12.166 | 0,00 | 73 | 0,00 | ||||
| 2026-02-17 | 13F | Advisor Group Holdings, Inc. | 178.935 | -14,29 | 1.075 | -12,96 | ||||
| 2026-01-30 | 13F | Us Bancorp \de\ | 3.660 | 22 | ||||||
| 2026-02-17 | 13F | Raymond James Financial Inc | 653.195 | 19,44 | 3.926 | 19,05 | ||||
| 2026-02-12 | 13F | Hrt Financial Lp | 13.894 | 0 | ||||||
| 2026-02-11 | 13F | Janney Montgomery Scott LLC | 57.458 | 0,00 | 0 | |||||
| 2026-02-13 | 13F | Wells Fargo & Company/mn | 278.112 | 68,33 | 1.671 | 67,77 | ||||
| 2025-11-13 | 13F | Landscape Capital Management, L.l.c. | 0 | -100,00 | 0 | |||||
| 2026-04-10 | 13F | Melfa Wealth Management, Llc | 74.780 | 0,00 | 459 | 2,23 | ||||
| 2026-02-17 | 13F | Cetera Investment Advisers | 89.009 | -6,86 | 535 | -7,29 | ||||
| 2025-11-14 | 13F | Virtu Financial LLC | 0 | -100,00 | 0 | |||||
| 2026-02-03 | 13F | Providence First Trust Co | 10.000 | -61,50 | 60 | -61,54 | ||||
| 2026-01-29 | 13F | Sanctuary Advisors, LLC | 31.000 | 0,00 | 186 | 0,00 | ||||
| 2026-01-09 | 13F | Silverlake Wealth Management Llc | 17.783 | 0,47 | 107 | 0,00 | ||||
| 2026-02-06 | 13F | Stronghold Wealth Management L.L.C. | 25.811 | 155 | ||||||
| 2026-02-12 | 13F | Jane Street Group, Llc | 71.394 | 226,67 | 429 | 227,48 | ||||
| 2026-01-26 | 13F | River Street Advisors LLC | 18.450 | 0,00 | 111 | -0,90 | ||||
| 2025-11-07 | 13F | Readystate Asset Management Lp | 0 | -100,00 | 0 | |||||
| 2026-02-17 | 13F | IHT Wealth Management, LLC | 24.800 | 0,00 | 149 | 0,00 | ||||
| 2026-01-29 | 13F | Camelot Portfolios, LLC | 20.000 | 0,00 | 120 | 0,00 | ||||
| 2026-02-02 | 13F | Truist Financial Corp | 19.161 | 0,07 | 115 | 0,00 | ||||
| 2026-02-17 | 13F | Tower Research Capital LLC (TRC) | 0 | -100,00 | 0 | |||||
| 2026-01-26 | 13F | Austin Wealth Management, LLC | 10.736 | 0,00 | 65 | 1,56 | ||||
| 2025-10-28 | 13F | Wolverine Asset Management Llc | 0 | -100,00 | 0 | -100,00 | ||||
| 2026-02-03 | 13F | RFG Advisory, LLC | 16.459 | -68,06 | 99 | -68,39 | ||||
| 2025-10-23 | 13F | CX Institutional | 0 | -100,00 | 0 | |||||
| 2026-01-23 | 13F | G2 Capital Management, Llc / Oh | 28.793 | 173 | ||||||
| 2026-02-13 | 13F | Baird Financial Group, Inc. | 18.001 | 8,73 | 108 | 9,09 | ||||
| 2026-01-14 | 13F | Hennion & Walsh Asset Management, Inc. | 1.057.088 | 88,40 | 6.353 | 87,79 | ||||
| 2026-02-13 | 13F | Mml Investors Services, Llc | 74.826 | -5,21 | 450 | -5,67 | ||||
| 2026-02-17 | 13F | Guggenheim Capital Llc | 1.020.442 | 14,39 | 6.133 | 14,00 | ||||
| 2026-02-14 | 13F | Rockefeller Capital Management L.P. | 41.710 | 0,62 | 251 | 0,40 | ||||
| 2026-02-17 | 13F | Bank Of America Corp /de/ | 985.666 | 7,30 | 5.924 | 6,93 | ||||
| 2026-04-10 | 13F | Insight Wealth Strategies, LLC | 38.964 | 0,63 | 239 | 3,02 | ||||
| 2026-01-22 | 13F | Vista Investment Partners Ii, Llc | 13.947 | 0,00 | 84 | -1,19 | ||||
| 2026-01-27 | 13F | First Horizon Corp | 500 | 0,00 | 3 | 0,00 | ||||
| 2025-11-14 | 13F | Balyasny Asset Management Llc | 0 | -100,00 | 0 | -100,00 | ||||
| 2026-02-13 | 13F | Creekside Partners | 14.892 | 0,00 | 90 | 0,00 | ||||
| 2026-02-11 | 13F | LPL Financial LLC | 150.921 | -2,08 | 907 | -2,37 | ||||
| 2026-02-17 | 13F | Nomura Holdings Inc | 16.250 | 62,50 | 98 | 61,67 | ||||
| 2026-02-13 | 13F | Kestra Advisory Services, LLC | 3.923 | 24 | ||||||
| 2026-02-10 | 13F/A | Northwestern Mutual Wealth Management Co | 38.779 | -18,36 | 233 | -18,53 | ||||
| 2026-02-12 | 13F | Marex Group plc | 17.500 | 105 | ||||||
| 2026-04-07 | 13F | Signaturefd, Llc | 1 | 0,00 | 0 | |||||
| 2026-02-10 | 13F | Envestnet Asset Management Inc | 136.890 | 20,02 | 823 | 19,65 | ||||
| 2025-11-06 | 13F | Prospera Financial Services Inc | 0 | -100,00 | 0 | |||||
| 2026-01-06 | 13F | Arlington Capital Management, Inc. | 34.139 | 13,38 | 205 | 13,26 | ||||
| 2026-02-04 | 13F | Midwest Trust Co | 43.009 | 0,00 | 258 | -0,39 | ||||
| 2026-02-10 | 13F | Rothschild Investment Llc | 4.440 | 0,00 | 27 | 0,00 | ||||
| 2026-01-29 | 13F | UBS Group AG | 207.392 | -52,63 | 1.246 | -52,79 | ||||
| 2026-04-10 | 13F | AssuredPartners Investment Advisors, LLC | 10.696 | 65 | ||||||
| 2026-01-30 | 13F | Activest Wealth Management | 0 | -100,00 | 0 | |||||
| 2026-02-13 | 13F | Arete Wealth Advisors, LLC | 18.603 | 0 | ||||||
| 2026-02-18 | 13F | GWM Advisors LLC | 77.762 | 28,00 | 467 | 27,60 | ||||
| 2026-02-06 | 13F | Pathway Financial Advisers, LLC | 16.471 | 0,93 | 99 | 0,00 | ||||
| 2026-02-13 | 13F | Mariner, LLC | 15.275 | 0,00 | 92 | -1,09 | ||||
| 2026-02-13 | 13F | Fortitude Advisory Group L.L.C. | 13.468 | 0,00 | 81 | -1,23 |