Grundlæggende statistik
| Institutionelle ejere | 95 total, 95 long only, 0 short only, 0 long/short - change of 63,79% MRQ |
| Gennemsnitlig porteføljeallokering | 0.6491 % - change of 174,70% MRQ |
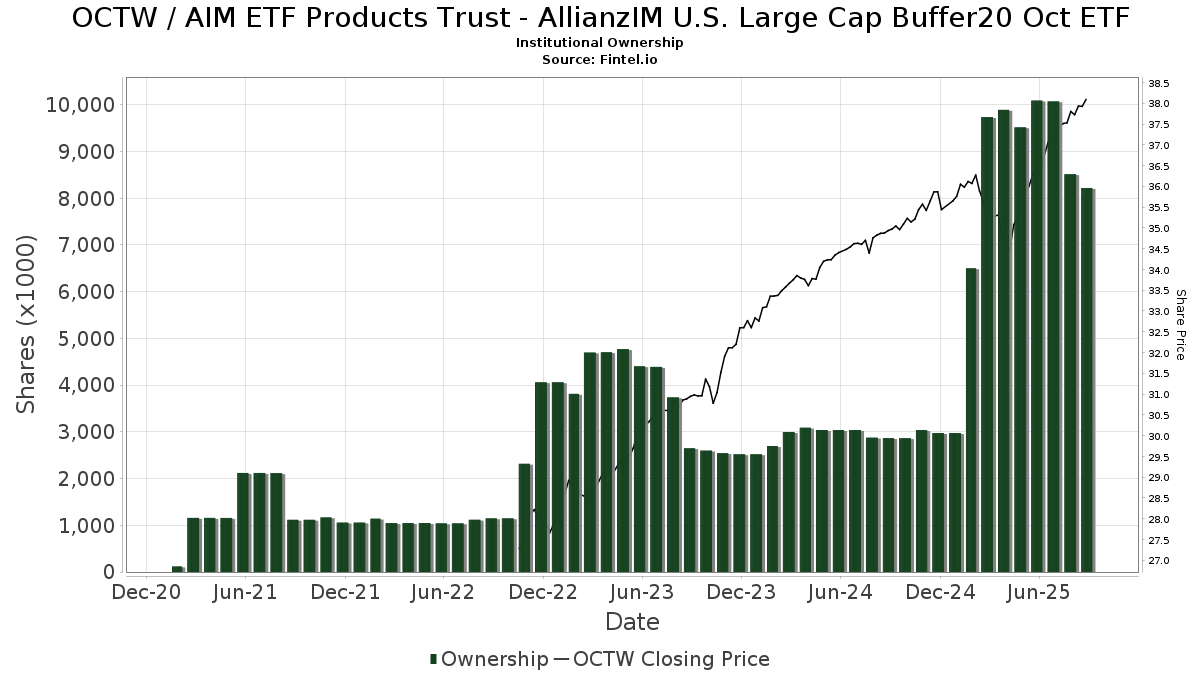
| Institutionelle aktier (lange) | 10.784.844 (ex 13D/G) - change of 5,46MM shares 102,57% MRQ |
| Institutionel værdi (lang) | $ 410.082 USD ($1000) |
Institutionelt ejerskab og aktionærer
AIM ETF Products Trust - AllianzIM U.S. Equity Buffer20 Oct ETF (US:OCTW) har 95 institutionelle ejere og aktionærer, der har indsendt 13D/G- eller 13F-formularer til Securities Exchange Commission (SEC). Disse institutioner har i alt 10,784,844 aktier. Største aktionærer omfatter LPL Financial LLC, AE Wealth Management LLC, Commonwealth Equity Services, Llc, Lloyd Advisory Services, LLC., Raymond James Financial Inc, Access Financial Services, Inc., Advisor Group Holdings, Inc., Centaurus Financial, Inc., Mid-American Wealth Advisory Group, Inc., and Outlook Wealth Advisors, LLC .
AIM ETF Products Trust - AllianzIM U.S. Equity Buffer20 Oct ETF (BATS:OCTW) institutionel ejerskabsstruktur viser aktuelle positioner i virksomheden efter institutioner og fonde, samt seneste ændringer i positionsstørrelse. Større aktionærer kan omfatte individuelle investorer, investeringsforeninger, hedgefonde eller institutioner. Skema 13D angiver, at investoren besidder (eller besidder) mere end 5 % af virksomheden og har til hensigt (eller har til hensigt at) aktivt at forfølge en ændring i forretningsstrategi. Skema 13G indikerer en passiv investering på over 5%.
The share price as of April 2, 2026 is 38,66 / share. Previously, on April 4, 2025, the share price was 33,57 / share. This represents an increase of 15,16% over that period.
Fondens stemningsscore
Fund Sentiment Score (fka Ownership Accumulation Score) finder de aktier, der bliver mest købt af fonde. Det er resultatet af en sofistikeret, multi-faktor kvantitativ model, der identificerer virksomheder med de højeste niveauer af institutionel akkumulering. Scoringsmodellen bruger en kombination af den samlede stigning i oplyste ejere, ændringerne i porteføljeallokeringer i disse ejere og andre målinger. Tallet går fra 0 til 100, hvor højere tal indikerer et højere niveau af akkumulering for sine jævnaldrende, og 50 er gennemsnittet.
Opdateringsfrekvens: Dagligt
Se Ownership Explorer, som giver en liste over højest rangerende virksomheder.
AI+ Ask Fintel’s AI assistant about AIM ETF Products Trust - AllianzIM U.S. Equity Buffer20 Oct ETF.
Select a question to share a public post with an AI-crafted answer.
Thinking of good questions…
Institutionel Put/Call-forhold
Ud over at indberette standardaktie- og gældsudstedelser skal institutter med mere end 100 mill. aktiver under forvaltning også oplyse deres put- og call-optionsbeholdninger. Da salgsoptioner generelt indikerer negativ stemning, og købsoptioner indikerer positiv stemning, kan vi få en fornemmelse af den overordnede institutionelle stemning ved at plotte forholdet mellem put og kald. Diagrammet til højre viser det historiske put/call-forhold for dette instrument.
Brug af Put/Call Ratio som en indikator for investorernes stemning overvinder en af de vigtigste mangler ved at bruge totalt institutionelt ejerskab, som er, at en betydelig mængde af aktiver under forvaltning investeres passivt for at spore indekser. Passivt forvaltede fonde køber typisk ikke optioner, så indikatoren for put/call-forholdet følger mere nøje følelsen af aktivt forvaltede fonde.
13F og NPORT arkivering
Detaljer om 13F-arkivering er gratis. Detaljer om NP-ansøgninger kræver et premium-medlemskab. Grønne rækker angiver nye positioner. Røde rækker angiver lukkede positioner. Klik på linket ikon for at se den fulde transaktionshistorik.
Opgrader
for at låse premium-data op og eksportere til Excel ![]() .
.
| Fil dato | Kilde | Investor | Type | Gennemsnitlig pris (Øst) |
Aktier | Δ Aktier (%) |
Rapporteret Værdi ($1000) |
Δ Værdi (%) |
Port Alloc (%) |
|
|---|---|---|---|---|---|---|---|---|---|---|
| 2026-01-09 | 13F | First Heartland Consultants, Inc. | 9.470 | 369 | ||||||
| 2026-02-06 | 13F | IFP Advisors, Inc | 9.773 | 3,64 | 381 | 5,54 | ||||
| 2025-10-14 | 13F | Paladin Wealth, LLC | 0 | -100,00 | 0 | |||||
| 2025-10-27 | 13F | WealthPLAN Partners, LLC | 0 | -100,00 | 0 | |||||
| 2026-02-17 | 13F | Private Advisor Group, LLC | 7.535 | 0,00 | 294 | 1,74 | ||||
| 2026-01-21 | 13F | BIP Wealth, LLC | 23.763 | 927 | ||||||
| 2026-03-05 | 13F | Taylor Securities Services, Inc. | 9.879 | 385 | ||||||
| 2026-02-17 | 13F | Old Mission Capital Llc | 8.604 | 336 | ||||||
| 2026-01-23 | 13F | Farther Finance Advisors, LLC | 21.006 | 879,76 | 819 | 898,78 | ||||
| 2026-02-05 | 13F | Guardian Capital, LLC | 54.001 | 2.106 | ||||||
| 2026-02-06 | 13F | Authentikos Wealth Advisory, LLC | 20.828 | 812 | ||||||
| 2026-01-12 | 13F | Focus Financial Network, Inc. | 15.579 | 15,10 | 608 | 17,18 | ||||
| 2026-02-17 | 13F/A | Sentinus, LLC | 5.772 | 225 | ||||||
| 2026-02-12 | 13F | Hrt Financial Lp | 0 | -100,00 | 0 | |||||
| 2026-02-11 | 13F | LPL Financial LLC | 2.340.821 | 28,88 | 91.292 | 31,13 | ||||
| 2026-02-17 | 13F | Modern Wealth Management, LLC | 34.801 | 1.357 | ||||||
| 2026-01-20 | 13F | AdvisorNet Financial, Inc | 3.070 | 0,00 | 120 | 1,71 | ||||
| 2026-01-13 | 13F | CoreCap Advisors, LLC | 929 | 0,00 | 36 | 2,86 | ||||
| 2026-01-14 | 13F | Spire Wealth Management | 83.816 | 356,69 | 3.269 | 364,86 | ||||
| 2026-01-23 | 13F | Diligent Investors, LLC | 5.410 | 0,00 | 211 | 1,45 | ||||
| 2026-01-15 | 13F | Brookstone Capital Management | 0 | -100,00 | 0 | |||||
| 2026-02-13 | 13F | Allianz Se | 5.000 | 195 | ||||||
| 2025-11-12 | 13F | Transce3nd, LLC | 0 | -100,00 | 0 | -100,00 | ||||
| 2026-01-21 | 13F | Compass Advisory Group LLC | 67.748 | -0,44 | 2.642 | 1,30 | ||||
| 2026-02-12 | 13F | Steward Partners Investment Advisory, Llc | 649 | 0,00 | 25 | 4,17 | ||||
| 2026-02-10 | 13F | Envestnet Asset Management Inc | 190.862 | 4,74 | 7.444 | 6,57 | ||||
| 2026-02-13 | 13F | Mml Investors Services, Llc | 88.056 | 1,98 | 3.434 | 3,78 | ||||
| 2025-10-27 | 13F | WealthPlan Investment Management, LLC | 0 | -100,00 | 0 | |||||
| 2026-02-11 | 13F | Outlook Wealth Advisors, LLC | 214.983 | 8.384 | ||||||
| 2025-11-12 | 13F | Tounjian Advisory Partners, Llc | 0 | -100,00 | 0 | -100,00 | ||||
| 2026-01-23 | 13F | Diversify Advisory Services, LLC | 17.911 | 0,00 | 704 | 1,74 | ||||
| 2025-11-14 | 13F | Brown Financial Advisors | 0 | -100,00 | 0 | |||||
| 2026-02-11 | 13F | Howard Bailey Securities, Llc | 124.715 | 4.864 | ||||||
| 2026-01-22 | 13F | Centennial Advisors, LLC | 47.640 | 1.858 | ||||||
| 2026-02-05 | 13F | Cambridge Investment Research Advisors, Inc. | 48.977 | 14,40 | 2 | 0,00 | ||||
| 2025-11-13 | 13F | Brown Brothers Harriman & Co | 0 | -100,00 | 0 | |||||
| 2025-11-13 | 13F | Richard W. Paul & Associates, LLC | 0 | -100,00 | 0 | |||||
| 2026-01-22 | 13F | Networth Advisors, LLC | 63.765 | 2.487 | ||||||
| 2026-02-17 | 13F | Advisor Group Holdings, Inc. | 231.346 | 55,50 | 9.022 | 59,60 | ||||
| 2026-01-26 | 13F | Decker Retirement Planning Inc. | 690 | 27 | ||||||
| 2026-02-10 | 13F | Clear Point Advisors Inc. | 6.746 | -7,66 | 263 | -6,07 | ||||
| 2026-02-06 | 13F | Creative Financial Designs Inc /adv | 2.610 | 197,95 | 102 | 206,06 | ||||
| 2026-02-09 | 13F | Harbour Investments, Inc. | 48.384 | 211,89 | 1.887 | 217,51 | ||||
| 2026-01-30 | 13F | Secured Retirement Advisors, Llc | 27.072 | -12,27 | 1.056 | -10,74 | ||||
| 2026-02-13 | 13F | Advyzon Investment Management, LLC | 63.481 | 828,76 | 2.476 | 848,28 | ||||
| 2026-02-05 | 13F | Panoramic Investment Advisors, Llc | 7.500 | 0,00 | 292 | 1,74 | ||||
| 2025-10-30 | 13F | Envestnet Portfolio Solutions, Inc. | 0 | -100,00 | 0 | |||||
| 2026-03-17 | 13F | Forty-three Eighteen Advisors, LLC | 117.894 | 4.598 | ||||||
| 2026-01-12 | 13F | Certified Advisory Corp | 14.253 | 0,00 | 556 | 1,65 | ||||
| 2026-02-09 | 13F | Blue Bell Private Wealth Management, Llc | 94.267 | -4,78 | 3.676 | -3,11 | ||||
| 2026-02-17 | 13F | Cetera Investment Advisers | 196.666 | 6,04 | 7.670 | 7,89 | ||||
| 2025-12-02 | 13F | Allworth Financial LP | 0 | -100,00 | 0 | |||||
| 2026-02-02 | 13F | B.O.S.S. Retirement Advisors, LLC | 115.510 | 4.505 | ||||||
| 2026-02-12 | 13F | Jane Street Group, Llc | 11.280 | 440 | ||||||
| 2026-02-12 | 13F | Commonwealth Equity Services, Llc | 1.165.773 | 2,88 | 45.465 | 105.632,56 | ||||
| 2026-01-27 | 13F | PFG Advisors | 54.195 | 6,69 | 2.114 | 8,53 | ||||
| 2026-01-23 | 13F | DHJJ Financial Advisors, Ltd. | 9.907 | -11,82 | 386 | -10,23 | ||||
| 2026-03-03 | 13F | Integrated Wealth Management | 92.939 | 3.625 | ||||||
| 2026-02-11 | 13F | Jpmorgan Chase & Co | 99 | 0,00 | 4 | 0,00 | ||||
| 2026-02-13 | 13F | Barclays Plc | 5 | 0 | ||||||
| 2026-02-13 | 13F | Change Path, LLC | 6.759 | 264 | ||||||
| 2026-02-13 | 13F | Centaurus Financial, Inc. | 219.973 | 5,62 | 9 | 14,29 | ||||
| 2026-01-23 | 13F | Assetmark, Inc | 67 | 3 | ||||||
| 2026-01-26 | 13F | SMART Wealth LLC | 42.242 | 1.647 | ||||||
| 2026-02-17 | 13F | Main Street Financial Solutions, LLC | 6.369 | 0,00 | 248 | 1,64 | ||||
| 2025-11-13 | 13F | GeoWealth Management, LLC | 0 | -100,00 | 0 | |||||
| 2026-02-13 | 13F | MAI Capital Management | 939 | 0,00 | 37 | 2,86 | ||||
| 2026-02-12 | 13F | Elevation Wealth Management LLC | 75.595 | 2.948 | ||||||
| 2026-02-25 | 13F | Westshore Wealth, LLC | 14.508 | 566 | ||||||
| 2026-01-08 | 13F | Gradient Investments LLC | 0 | -100,00 | 0 | |||||
| 2026-02-05 | 13F | Castle Rock Wealth Management, LLC | 19.771 | 8,55 | 773 | 10,59 | ||||
| 2026-01-26 | 13F | Nations Financial Group Inc, /ia/ /adv | 16.704 | -1,08 | 651 | 0,62 | ||||
| 2026-02-10 | 13F | Foundations Investment Advisors, LLC | 8.751 | -30,78 | 341 | -29,55 | ||||
| 2026-02-06 | 13F | Global Retirement Partners, LLC | 3.119 | 0,00 | 122 | 1,68 | ||||
| 2026-02-10 | 13F | Allianz Investment Management Llc | 94.238 | -90,58 | 3.675 | -85,85 | ||||
| 2026-02-13 | 13F | Morgan Stanley | 0 | -100,00 | 0 | |||||
| 2025-11-13 | 13F | UBS Group AG | 0 | -100,00 | 0 | |||||
| 2026-02-06 | 13F | Csenge Advisory Group | 52.862 | 2.062 | ||||||
| 2026-02-17 | 13F | Raymond James Financial Inc | 438.820 | 4,73 | 17.114 | 6,56 | ||||
| 2026-01-29 | 13F | Jim Saulnier & Associates, Llc | 8.140 | 0,00 | 317 | 1,60 | ||||
| 2026-02-02 | 13F | Avidian Wealth Solutions, LLC | 6.635 | 259 | ||||||
| 2026-02-02 | 13F | RIA Advisory Group LLC | 5.500 | 0,00 | 214 | 1,90 | ||||
| 2026-02-06 | 13F | Blackston Financial Advisory Group, LLC | 21.047 | 821 | ||||||
| 2026-02-06 | 13F | Kingdom Financial Group LLC. | 24.603 | 960 | ||||||
| 2026-01-16 | 13F | BridgePort Financial Solutions, LLC | 6.605 | 258 | ||||||
| 2026-02-17 | 13F | Susquehanna International Group, Llp | 30.928 | 152,02 | 1.206 | 156,60 | ||||
| 2026-01-21 | 13F | Access Financial Services, Inc. | 364.400 | 14.212 | ||||||
| 2026-02-13 | 13F | Kestra Advisory Services, LLC | 0 | -100,00 | 0 | |||||
| 2026-01-13 | 13F | Signal Advisors Wealth, LLC | 6.820 | -52,33 | 266 | -51,64 | ||||
| 2026-02-11 | 13F | Gaddis Premier Wealth Advisors LLC | 7.037 | 274 | ||||||
| 2026-01-29 | 13F | Quest 10 Wealth Builders, Inc. | 11.161 | 435 | ||||||
| 2026-01-26 | 13F | Key Capital Management, INC | 6.278 | 245 | ||||||
| 2026-02-13 | 13F | SRS Capital Advisors, Inc. | 947 | 0,00 | 37 | 0,00 | ||||
| 2026-01-27 | 13F | FSR Wealth Management Ltd. | 144.678 | 5.642 | ||||||
| 2025-11-04 | 13F | Pineridge Advisors LLC | 0 | -100,00 | 0 | |||||
| 2025-10-17 | 13F | Mattson Financial Services, LLC | 0 | -100,00 | 0 | |||||
| 2026-01-23 | 13F | Mid-American Wealth Advisory Group, Inc. | 216.453 | 8.442 | ||||||
| 2026-02-02 | 13F | Grantvest Financial Group LLC | 8.384 | 3,61 | 327 | 5,16 | ||||
| 2026-02-12 | 13F | Great Lakes Retirement, Inc. | 66.757 | 2.604 | ||||||
| 2026-02-11 | 13F | Stirlingshire Investments, Inc. | 9.882 | 385 | ||||||
| 2026-01-07 | 13F | BCGM Wealth Management, LLC | 9.715 | 379 | ||||||
| 2025-11-06 | 13F | Allianz Investment Management U.S. LLC | 5.000 | 0,00 | 192 | 3,24 | ||||
| 2026-01-21 | 13F | Long Island Wealth Management, Inc. | 60.525 | 0,00 | 2.360 | 1,77 | ||||
| 2026-02-04 | 13F | Pensionmark Financial Group, Llc | 83.934 | 3.273 | ||||||
| 2026-01-28 | 13F | HB Wealth Management, LLC | 9.908 | 0,00 | 386 | 1,85 | ||||
| 2026-02-02 | 13F | FSA Advisors, Inc. | 39.976 | 1.559 | ||||||
| 2026-02-06 | 13F | Lloyd Advisory Services, LLC. | 507.409 | 19.789 | ||||||
| 2026-01-26 | 13F | LifeWealth Investments, LLC | 60.254 | 2.350 | ||||||
| 2026-02-10 | 13F | Moors & Cabot, Inc. | 6.130 | 239 | ||||||
| 2026-01-26 | 13F | AE Wealth Management LLC | 2.225.638 | 27.776,23 | 86.800 | 28.265,69 | ||||
| 2026-01-26 | 13F | Patriot Financial Group Insurance Agency, LLC | 7.325 | 286 | ||||||
| 2026-01-27 | 13F | Belpointe Asset Management LLC | 6.490 | 0,00 | 253 | 2,02 | ||||
| 2026-01-30 | 13F | Strategic Blueprint, LLC | 20.977 | -51,04 | 818 | -50,18 | ||||
| 2026-01-26 | 13F | Merit Financial Group, LLC | 8.611 | 0,00 | 336 | 1,52 | ||||
| 2025-11-12 | 13F | Park Square Financial Group, LLC | 0 | -100,00 | 0 |