Grundlæggende statistik
| Institutionelle aktier (lange) | 7.974.569 - 37,67% (ex 13D/G) - change of -0,98MM shares -10,93% MRQ |
| Institutionel værdi (lang) | $ 959.516 USD ($1000) |
Institutionelt ejerskab og aktionærer
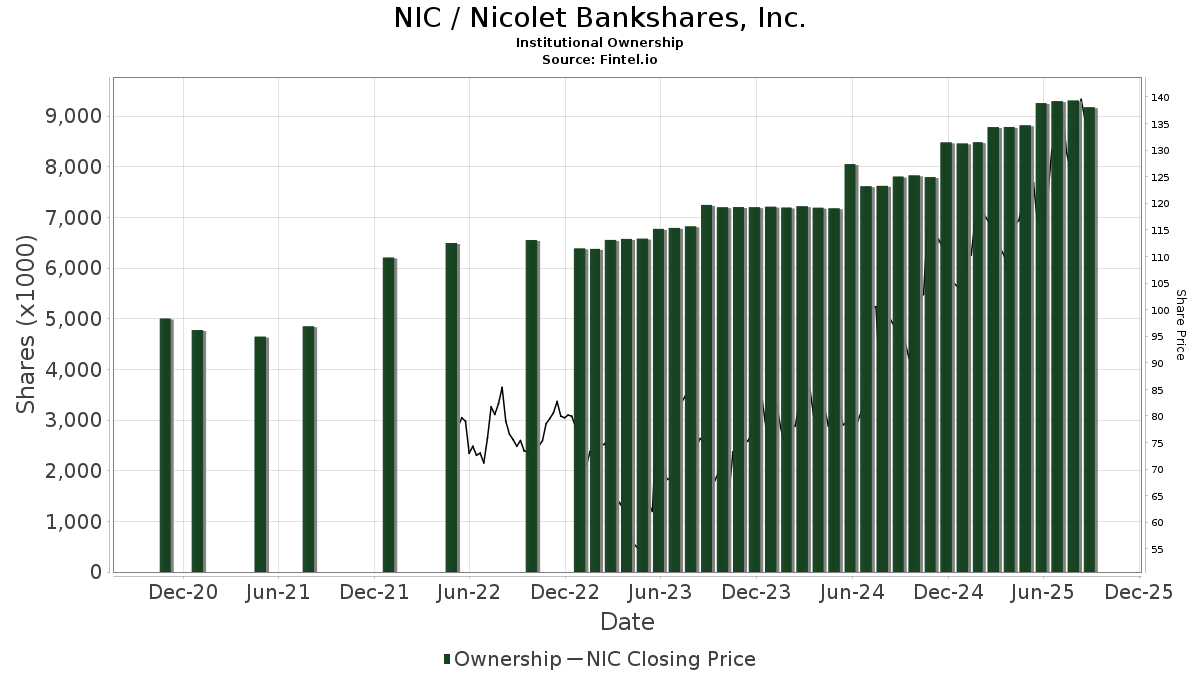
Nicolet Bankshares, Inc. (US:NIC) har 206 institutionelle ejere og aktionærer, der har indsendt 13D/G- eller 13F-formularer til Securities Exchange Commission (SEC). Disse institutioner har i alt 7,974,569 aktier. Største aktionærer omfatter BlackRock, Inc., Nicolet Bankshares Inc, Vanguard Group Inc, Dimensional Fund Advisors Lp, State Street Corp, First Trust Advisors Lp, Geode Capital Management, Llc, Alliancebernstein L.p., Citadel Advisors Llc, and American Century Companies Inc .
Nicolet Bankshares, Inc. (NYSE:NIC) institutionel ejerskabsstruktur viser aktuelle positioner i virksomheden efter institutioner og fonde, samt seneste ændringer i positionsstørrelse. Større aktionærer kan omfatte individuelle investorer, investeringsforeninger, hedgefonde eller institutioner. Skema 13D angiver, at investoren besidder (eller besidder) mere end 5 % af virksomheden og har til hensigt (eller har til hensigt at) aktivt at forfølge en ændring i forretningsstrategi. Skema 13G indikerer en passiv investering på over 5%.
The share price as of April 24, 2026 is 145,51 / share. Previously, on April 28, 2025, the share price was 116,99 / share. This represents an increase of 24,38% over that period.
Fondens stemningsscore
Fund Sentiment Score (fka Ownership Accumulation Score) finder de aktier, der bliver mest købt af fonde. Det er resultatet af en sofistikeret, multi-faktor kvantitativ model, der identificerer virksomheder med de højeste niveauer af institutionel akkumulering. Scoringsmodellen bruger en kombination af den samlede stigning i oplyste ejere, ændringerne i porteføljeallokeringer i disse ejere og andre målinger. Tallet går fra 0 til 100, hvor højere tal indikerer et højere niveau af akkumulering for sine jævnaldrende, og 50 er gennemsnittet.
Opdateringsfrekvens: Dagligt
Se Ownership Explorer, som giver en liste over højest rangerende virksomheder.
AI+ Ask Fintel’s AI assistant about Nicolet Bankshares, Inc..
Select a question to share a public post with an AI-crafted answer.
Thinking of good questions…
Institutionel Put/Call-forhold
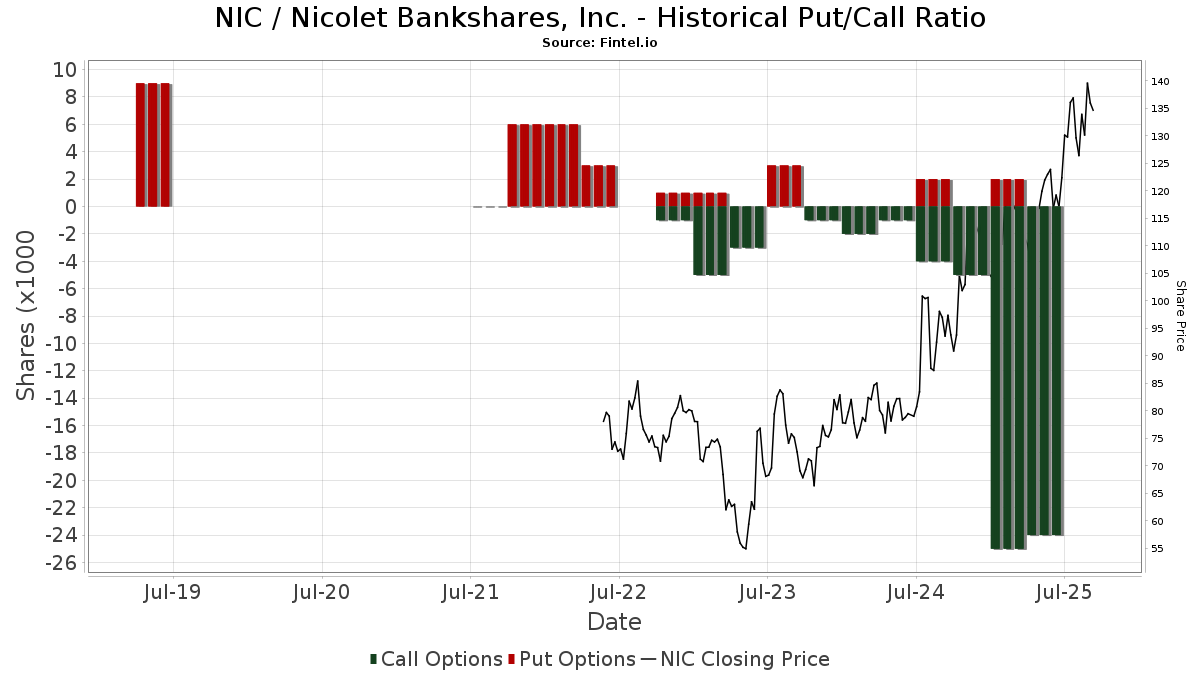
Ud over at indberette standardaktie- og gældsudstedelser skal institutter med mere end 100 mill. aktiver under forvaltning også oplyse deres put- og call-optionsbeholdninger. Da salgsoptioner generelt indikerer negativ stemning, og købsoptioner indikerer positiv stemning, kan vi få en fornemmelse af den overordnede institutionelle stemning ved at plotte forholdet mellem put og kald. Diagrammet til højre viser det historiske put/call-forhold for dette instrument.
Brug af Put/Call Ratio som en indikator for investorernes stemning overvinder en af de vigtigste mangler ved at bruge totalt institutionelt ejerskab, som er, at en betydelig mængde af aktiver under forvaltning investeres passivt for at spore indekser. Passivt forvaltede fonde køber typisk ikke optioner, så indikatoren for put/call-forholdet følger mere nøje følelsen af aktivt forvaltede fonde.
13F og NPORT arkivering
Detaljer om 13F-arkivering er gratis. Detaljer om NP-ansøgninger kræver et premium-medlemskab. Grønne rækker angiver nye positioner. Røde rækker angiver lukkede positioner. Klik på linket ikon for at se den fulde transaktionshistorik.
Opgrader
for at låse premium-data op og eksportere til Excel ![]() .
.
| Fil dato | Kilde | Investor | Type | Gennemsnitlig pris (Øst) |
Aktier | Δ Aktier (%) |
Rapporteret Værdi ($1000) |
Δ Værdi (%) |
Port Alloc (%) |
|
|---|---|---|---|---|---|---|---|---|---|---|
| 2025-11-13 | 13F | Martingale Asset Management L P | 0 | -100,00 | 0 | |||||
| 2025-10-30 | 13F | Twin Peaks Wealth Advisors, LLC | 0 | -100,00 | 0 | |||||
| 2026-02-13 | 13F | Kennedy Capital Management, Inc. | 9.374 | -0,52 | 1.137 | -10,26 | ||||
| 2026-04-07 | 13F | Signaturefd, Llc | 963 | 608,09 | 143 | 793,75 | ||||
| 2026-04-13 | 13F | Massmutual Trust Co Fsb/adv | 5 | 1 | ||||||
| 2026-02-06 | 13F | Covestor Ltd | 8 | 0,00 | 0 | |||||
| 2026-01-27 | 13F | Zurcher Kantonalbank (Zurich Cantonalbank) | 3.353 | 82,03 | 407 | 64,37 | ||||
| 2026-04-20 | 13F | State of Alaska, Department of Revenue | 3.034 | 0,00 | 0 | |||||
| 2026-02-10 | 13F | Angel Oak Capital Advisors, LLC | 3.000 | 364 | ||||||
| 2026-02-13 | 13F | Baird Financial Group, Inc. | 4.227 | -2,27 | 513 | -11,88 | ||||
| 2026-02-13 | 13F | Smartleaf Asset Management LLC | 15 | 0,00 | 2 | -50,00 | ||||
| 2026-02-11 | 13F | Los Angeles Capital Management Llc | 5.818 | 0,00 | 675 | -13,68 | ||||
| 2026-02-17 | 13F | Millennium Management Llc | 65.534 | 7.949 | ||||||
| 2026-02-06 | 13F | Associated Banc-corp | 10.312 | 32,63 | 1.251 | 19,62 | ||||
| 2026-01-29 | 13F | UBS Group AG | 49.213 | 61,06 | 5.970 | 45,27 | ||||
| 2026-02-13 | 13F | American Century Companies Inc | 199.119 | 11,07 | 24.153 | 0,17 | ||||
| 2026-02-13 | 13F | Charles Schwab Investment Management Inc | 110.211 | -1,26 | 13.369 | -10,95 | ||||
| 2026-02-20 | 13F | Sunbelt Securities, Inc. | 3 | 0,00 | 0 | |||||
| 2026-04-23 | 13F | Peregrine Capital Management Llc | 33.230 | 4.939 | ||||||
| 2026-01-29 | 13F | Comerica Bank | 1 | 0 | ||||||
| 2026-02-17 | 13F | Tower Research Capital LLC (TRC) | 678 | -38,59 | 82 | -44,59 | ||||
| 2026-02-13 | 13F | Public Employees Retirement Association Of Colorado | 1.936 | 0,00 | 0 | |||||
| 2026-02-11 | 13F | Deutsche Bank Ag\ | 11.561 | 4,76 | 1.402 | -5,53 | ||||
| 2026-02-04 | 13F | KLCM Advisors, Inc. | 5.500 | 266,67 | 667 | 231,84 | ||||
| 2026-04-16 | 13F | SG Americas Securities, LLC | 8.700 | 12,26 | 1 | |||||
| 2026-02-12 | 13F | Wealthspire Advisors, LLC | 0 | -100,00 | 0 | |||||
| 2026-02-12 | 13F | Swiss National Bank | 26.300 | 0,00 | 3.190 | -9,81 | ||||
| 2026-02-13 | 13F | Police & Firemen's Retirement System of New Jersey | 3.743 | 0,00 | 454 | -9,74 | ||||
| 2026-02-12 | 13F | BlackRock, Inc. | 1.128.444 | 7,12 | 136.880 | -3,40 | ||||
| 2026-02-10 | 13F | Eurizon Capital SGR S.p.A. | 67 | 8 | ||||||
| 2026-04-24 | 13F | UMA Financial Services, Inc. | 8 | 100,00 | 1 | |||||
| 2025-11-14 | 13F | Wolverine Trading, Llc | Call | 2.800 | 374 | |||||
| 2026-02-11 | 13F | O'shaughnessy Asset Management, Llc | 1.733 | -5,15 | 210 | -14,29 | ||||
| 2026-02-17 | 13F | Price T Rowe Associates Inc /md/ | 15.265 | 3,36 | 2 | 0,00 | ||||
| 2026-02-10 | 13F | Bnp Paribas Arbitrage, Sa | 2.921 | 6,96 | 354 | -3,54 | ||||
| 2026-02-12 | 13F | Dimensional Fund Advisors Lp | 620.277 | -0,95 | 75.240 | -10,67 | ||||
| 2026-02-11 | 13F | LPL Financial LLC | 2.836 | 4,65 | 344 | -5,49 | ||||
| 2026-02-17 | 13F | Quantinno Capital Management LP | 3.661 | 444 | ||||||
| 2026-02-10 | 13F | Anchor Capital Advisors Llc | 21.438 | 10,63 | 2.600 | -0,23 | ||||
| 2026-02-10 | 13F | Goldman Sachs Group Inc | 120.218 | 91,01 | 14.582 | 72,26 | ||||
| 2026-02-12 | 13F | Nuveen, LLC | 26.936 | -4,30 | 3.267 | -13,69 | ||||
| 2026-02-17 | 13F | Alliancebernstein L.p. | 233.788 | -7,04 | 28.358 | -16,17 | ||||
| 2026-02-17 | 13F | Russell Investments Group, Ltd. | 1.055 | -6,06 | 128 | -15,89 | ||||
| 2025-11-07 | 13F | Shell Asset Management Co | 540 | -49,58 | 0 | |||||
| 2026-02-10 | 13F | Bank of New York Mellon Corp | 62.236 | 2,73 | 7.549 | -7,35 | ||||
| 2026-04-07 | 13F | Farther Finance Advisors, LLC | 199 | 39,16 | 30 | 70,59 | ||||
| 2026-02-05 | 13F | Allworth Financial LP | 0 | -100,00 | 0 | |||||
| 2026-02-13 | 13F | Citigroup Inc | 11.740 | 17,29 | 1.424 | 5,79 | ||||
| 2026-01-16 | 13F | Marquette Asset Management, LLC | 0 | -100,00 | 0 | -100,00 | ||||
| 2026-04-08 | 13F | Wealth Enhancement Advisory Services, Llc | 20.751 | -23,37 | 3.090 | -9,23 | ||||
| 2026-02-17 | 13F | Oberweis Asset Management Inc/ | 61.700 | 2,49 | 7.484 | -7,56 | ||||
| 2026-02-17 | 13F | Odyssean, LLC | 6.146 | 746 | ||||||
| 2026-01-26 | 13F | Cwm, Llc | 4.484 | -28,45 | 1 | |||||
| 2026-01-28 | 13F | N.E.W. Advisory Services LLC | 39.948 | 5,10 | 4.846 | -5,22 | ||||
| 2025-11-14 | 13F | Ameriprise Financial Inc | 0 | -100,00 | 0 | -100,00 | ||||
| 2026-02-12 | 13F | Bank Of Montreal /can/ | 23.181 | 0,64 | 2.829 | -8,72 | ||||
| 2026-04-13 | 13F | Trust Co | 3 | 0,00 | 0 | |||||
| 2026-02-17 | 13F | Mercer Global Advisors Inc /adv | 8.153 | 4,66 | 989 | -5,64 | ||||
| 2026-02-13 | 13F | First Trust Advisors Lp | 388.488 | -28,12 | 47.124 | -35,18 | ||||
| 2026-02-10 | 13F | Envestnet Asset Management Inc | 5.874 | 5,19 | 713 | -5,19 | ||||
| 2026-02-17 | 13F | Citadel Advisors Llc | Put | 0 | -100,00 | 0 | ||||
| 2026-02-17 | 13F | Canada Pension Plan Investment Board | 6.400 | 776 | ||||||
| 2026-02-17 | 13F | Engineers Gate Manager LP | 13.556 | 1.644 | ||||||
| 2026-01-16 | 13F | Verus Wealth Management, Llc | 0 | -100,00 | 0 | |||||
| 2026-02-13 | 13F | Caitong International Asset Management Co., Ltd | 0 | -100,00 | 0 | |||||
| 2026-02-12 | 13F | New York State Common Retirement Fund | 4.811 | 0,00 | 584 | -9,89 | ||||
| 2026-02-13 | 13F | Ubs Asset Management Americas Inc | 17.790 | -7,27 | 2.158 | -16,40 | ||||
| 2026-02-10 | 13F | Bruce G. Allen Investments, LLC | 6 | 0,00 | 1 | |||||
| 2026-02-13 | 13F | Peak6 Llc | Call | 0 | -100,00 | 0 | ||||
| 2026-02-13 | 13F | Advisory Research Inc | 39.596 | -5,89 | 4.803 | -15,14 | ||||
| 2026-02-17 | 13F | Susquehanna Fundamental Investments, Llc | 11.662 | 80,83 | 1.415 | 63,09 | ||||
| 2026-02-02 | 13F | Principal Financial Group Inc | 16.750 | 52,04 | 2.032 | 37,14 | ||||
| 2026-02-17 | 13F | California State Teachers Retirement System | 13.337 | -0,20 | 1.618 | -10,02 | ||||
| 2026-02-13 | 13F | Morgan Stanley | 95.370 | 186,32 | 11.568 | 158,21 | ||||
| 2026-02-17 | 13F | Lazard Asset Management Llc | 12.134 | 1.472 | ||||||
| 2026-04-23 | 13F | CBOE Vest Financial, LLC | 12.890 | -43,89 | 1.916 | -31,26 | ||||
| 2026-02-09 | 13F | Quest Partners LLC | 16.782 | 804,69 | 2.036 | 717,27 | ||||
| 2026-04-22 | 13F | Caldwell Trust Co | 12.578 | 0,00 | 1.869 | 22,56 | ||||
| 2026-02-12 | 13F | Alps Advisors Inc | 3.417 | 0,83 | 414 | -9,01 | ||||
| 2025-11-14 | 13F | Cubist Systematic Strategies, LLC | 8.035 | 193,25 | 1.081 | 219,53 | ||||
| 2026-02-09 | 13F | Geode Capital Management, Llc | 309.646 | -1,18 | 37.567 | -10,88 | ||||
| 2026-02-17 | 13F | Voloridge Investment Management, Llc | 48.542 | 812,62 | 5.888 | 723,50 | ||||
| 2026-02-11 | 13F | Meeder Asset Management Inc | 399 | 48 | ||||||
| 2026-02-13 | 13F | Aigen Investment Management, Lp | 5.960 | 723 | ||||||
| 2026-02-17 | 13F | MIRAE ASSET GLOBAL ETFS HOLDINGS Ltd. | 6.186 | -1,45 | 750 | -11,14 | ||||
| 2026-02-13 | 13F | Great West Life Assurance Co /can/ | 1.396 | 0,00 | 0 | |||||
| 2026-02-13 | 13F | Panagora Asset Management Inc | 0 | -100,00 | 0 | |||||
| 2026-02-12 | 13F | Quadrant Capital Group Llc | 2.019 | -0,20 | 245 | -10,29 | ||||
| 2026-02-17 | 13F | Raymond James Financial Inc | 14.174 | 1.719 | ||||||
| 2026-02-06 | 13F | Larson Financial Group LLC | 1 | 0 | ||||||
| 2026-04-16 | 13F | Heck Capital Advisors, LLC | 2.000 | 0,00 | 297 | 22,73 | ||||
| 2026-04-24 | 13F | Zwj Investment Counsel Inc | 1.730 | 257 | ||||||
| 2026-02-19 | 13F | Invesco Ltd. | 20.940 | -8,11 | 2.540 | -17,13 | ||||
| 2026-04-16 | 13F | Ellsworth Advisors, LLC | 6.377 | 0,30 | 948 | 11,94 | ||||
| 2026-02-06 | 13F | Gsa Capital Partners Llp | 2.844 | 0 | ||||||
| 2026-02-13 | 13F | BNP Paribas Asset Management Holding S.A. | 2.745 | 5.178,85 | 0 | |||||
| 2026-02-13 | 13F | Clarkston Capital Partners, LLC | 0 | -100,00 | 0 | |||||
| 2026-02-17 | 13F | Optiver Holding B.V. | 24 | -68,42 | 3 | -80,00 | ||||
| 2026-02-10 | 13F | Foundations Investment Advisors, LLC | 2.963 | -1,23 | 359 | -10,92 | ||||
| 2026-02-13 | 13F | Umb Bank N A/mo | 840 | 102 | ||||||
| 2025-11-14 | 13F | XTX Topco Ltd | 0 | -100,00 | 0 | -100,00 | ||||
| 2026-02-12 | 13F | Jane Street Group, Llc | 33.429 | 218,52 | 4.055 | 187,31 | ||||
| 2025-11-13 | 13F | GeoWealth Management, LLC | 0 | -100,00 | 0 | |||||
| 2026-02-12 | 13F | Jane Street Group, Llc | Call | 19.800 | 0,00 | 2.402 | -9,84 | |||
| 2026-02-10 | 13F | Intech Investment Management Llc | 5.588 | -9,64 | 678 | -18,53 | ||||
| 2026-02-23 | 13F | Virtu Financial LLC | 16.887 | 2 | ||||||
| 2026-02-09 | 13F | Nicolet Bankshares Inc | 883.159 | -0,44 | 107.127 | -10,21 | ||||
| 2026-02-10 | 13F | Smith Group Asset Management, LLC | 2.041 | 2,61 | 248 | -7,49 | ||||
| 2026-04-13 | 13F | IFP Advisors, Inc | 0 | -100,00 | 0 | |||||
| 2026-02-10 | 13F | IAG Wealth Partners, LLC | 1.017 | 0,00 | 123 | -9,56 | ||||
| 2026-02-13 | 13F | MAI Capital Management | 2.903 | 0,10 | 352 | -9,74 | ||||
| 2026-02-17 | 13F | RMB Capital Management, LLC | 21.137 | 0,00 | 2.564 | -9,82 | ||||
| 2026-02-13 | 13F | Sei Investments Co | 14.208 | 355,53 | 1.723 | 310,98 | ||||
| 2026-02-06 | 13F | ProShare Advisors LLC | 2.424 | 4,89 | 294 | -5,16 | ||||
| 2026-02-17 | 13F | Bank Of America Corp /de/ | 14.974 | -25,82 | 1.816 | -33,09 | ||||
| 2026-04-06 | 13F | Versant Capital Management, Inc | 170 | 25 | ||||||
| 2026-01-28 | 13F | Teacher Retirement System Of Texas | 3.657 | -24,03 | 444 | -31,53 | ||||
| 2026-02-13 | 13F | Quarry LP | 112 | 330,77 | 14 | 333,33 | ||||
| 2026-02-17 | 13F | PDT Partners, LLC | 0 | -100,00 | 0 | |||||
| 2026-02-17 | 13F | Susquehanna Portfolio Strategies, LLC | 2.835 | 0,00 | 344 | -9,97 | ||||
| 2026-02-09 | 13F | Legal & General Group Plc | 11.868 | -15,46 | 1.448 | -23,32 | ||||
| 2026-02-12 | 13F | Johnson Financial Group, Inc. | 7.500 | 0,00 | 910 | -9,82 | ||||
| 2026-02-17 | 13F | Qube Research & Technologies Ltd | 0 | -100,00 | 0 | |||||
| 2026-02-13 | 13F | FJ Capital Management LLC | 20.421 | 29,63 | 2.477 | 16,95 | ||||
| 2026-04-20 | 13F | Apella Capital, LLC | 2.926 | 463 | ||||||
| 2026-02-10 | 13F | Rothschild Investment Llc | 832 | 0,24 | 101 | -9,91 | ||||
| 2026-04-22 | 13F | Pictet Asset Management Holding SA | 2.996 | 57,44 | 445 | 93,48 | ||||
| 2026-02-17 | 13F | Citadel Advisors Llc | Call | 4.800 | 77,78 | 582 | 60,33 | |||
| 2026-02-17 | 13F | Citadel Advisors Llc | 225.815 | 27.391 | ||||||
| 2026-02-06 | 13F | EverSource Wealth Advisors, LLC | 346 | -0,29 | 42 | -10,87 | ||||
| 2026-02-11 | 13F | Ameritas Investment Partners, Inc. | 1.129 | 137 | ||||||
| 2026-01-30 | 13F | Caldwell Securities, Inc | 720 | 0,00 | 87 | -9,37 | ||||
| 2026-02-03 | 13F | Winch Advisory Services, LLC | 513 | 0,20 | 62 | -8,82 | ||||
| 2026-02-17 | 13F | Jones Financial Companies Lllp | 320 | 0,00 | 39 | -9,52 | ||||
| 2026-02-17 | 13F | Creative Planning | 17.723 | -5,14 | 2.150 | -14,45 | ||||
| 2026-01-30 | 13F | Us Bancorp \de\ | 215 | 0,00 | 26 | -7,14 | ||||
| 2026-01-14 | 13F | USA Financial Portformulas Corp | 0 | -100,00 | 0 | -100,00 | ||||
| 2026-02-17 | 13F | Brevan Howard Capital Management LP | 4.586 | 556 | ||||||
| 2026-02-14 | 13F | Rockefeller Capital Management L.P. | 22 | -26,67 | 3 | -50,00 | ||||
| 2026-02-17 | 13F | Balyasny Asset Management Llc | 1.672 | -69,30 | 203 | -72,40 | ||||
| 2026-02-12 | 13F | Hrt Financial Lp | 16.924 | 2 | ||||||
| 2026-02-13 | 13F | Barclays Plc | 25.680 | 29,12 | 3.115 | 16,41 | ||||
| 2026-02-05 | 13F | Dana Investment Advisors, Inc. | 10.000 | 0,00 | 1.213 | -9,81 | ||||
| 2026-02-10 | 13F/A | Northwestern Mutual Wealth Management Co | 11.137 | 18,13 | 1.351 | 6,47 | ||||
| 2026-04-07 | 13F | Legacy Private Trust Co. | 18.982 | -7,06 | 2.821 | 13,89 | ||||
| 2026-01-26 | 13F | KBC Group NV | 591 | 0,00 | 0 | |||||
| 2026-01-16 | 13F | Empirical Financial Services, LLC d.b.a. Empirical Wealth Management | 0 | -100,00 | 0 | |||||
| 2026-02-11 | 13F | Franklin Resources Inc | 19.148 | 172,92 | 2.323 | 146,24 | ||||
| 2026-02-13 | 13F | State Street Corp | 458.724 | 6,23 | 55.643 | -4,20 | ||||
| 2026-04-23 | 13F | MQS Management LLC | 0 | -100,00 | 0 | |||||
| 2026-02-05 | 13F | Amalgamated Bank | 417 | -9,94 | 0 | |||||
| 2026-02-09 | 13F | Huntington National Bank | 3.000 | 0,00 | 364 | -9,93 | ||||
| 2026-02-17 | 13F | Two Sigma Investments, Lp | 12.248 | 559,91 | 1.486 | 496,39 | ||||
| 2026-01-28 | 13F | Arizona State Retirement System | 3.750 | -6,62 | 455 | -15,93 | ||||
| 2026-02-13 | 13F | Squarepoint Ops LLC | 26.966 | 74,19 | 3.271 | 57,06 | ||||
| 2026-02-17 | 13F | Blair William & Co/il | 2.574 | 42,68 | 312 | 28,93 | ||||
| 2026-02-17 | 13F | Fmr Llc | 50.929 | -64,36 | 6.178 | -67,86 | ||||
| 2026-02-12 | 13F | EntryPoint Capital, LLC | 3.604 | 437 | ||||||
| 2026-02-17 | 13F | Royal Bank Of Canada | 17.095 | 17,20 | 2.074 | 5,71 | ||||
| 2026-02-17 | 13F | Two Sigma Advisers, Lp | 2.900 | 352 | ||||||
| 2026-02-17 | 13F | Susquehanna International Group, Llp | 15.818 | 38,91 | 1.919 | 25,28 | ||||
| 2026-02-17 | 13F | Janus Henderson Group Plc | 101.380 | -4,03 | 12.298 | -13,45 | ||||
| 2025-11-12 | 13F | CIBC Bancorp USA Inc. | 3.440 | 463 | ||||||
| 2026-02-13 | 13F | Rafferty Asset Management, LLC | 14.175 | 5,83 | 1.719 | -4,55 | ||||
| 2026-01-15 | 13F | Nisa Investment Advisors, Llc | 102 | -26,62 | 12 | -33,33 | ||||
| 2026-02-09 | 13F | North Star Asset Management Inc | 38.760 | -1,20 | 4.702 | -10,90 | ||||
| 2026-02-17 | 13F | Public Employees Retirement System Of Ohio | 106 | -6,19 | 13 | -20,00 | ||||
| 2026-02-17 | 13F | Susquehanna International Group, Llp | Call | 1.800 | 218 | |||||
| 2026-02-11 | 13F | Parallel Advisors, LLC | 241 | 0,00 | 29 | -9,37 | ||||
| 2026-02-17 | 13F | Northern Trust Corp | 120.256 | -9,92 | 14.587 | -18,76 | ||||
| 2026-04-23 | 13F | Sippican Capital Advisors | 3.727 | 554 | ||||||
| 2026-02-03 | 13F | Sequoia Financial Advisors, LLC | 6.980 | -0,03 | 847 | -9,90 | ||||
| 2026-04-17 | 13F | Stephenson National Bank & Trust | 8.840 | -2,21 | 1.314 | 19,80 | ||||
| 2026-01-23 | 13F | Bowman & Co S.C. | 10.755 | -8,42 | 1.305 | -17,42 | ||||
| 2026-02-17 | 13F | State Of Wisconsin Investment Board | 4.328 | 21,10 | 525 | 9,17 | ||||
| 2026-02-12 | 13F | Federated Hermes, Inc. | 1.414 | 0,00 | 172 | -10,00 | ||||
| 2026-02-17 | 13F | NorthRock Partners, LLC | 4.530 | 2,70 | 549 | -7,42 | ||||
| 2026-02-10 | 13F | Quantbot Technologies LP | 1.781 | 216 | ||||||
| 2026-02-17 | 13F | Aquatic Capital Management LLC | 7.471 | 126,26 | 906 | 104,05 | ||||
| 2026-02-13 | 13F | Boston Partners | 187.808 | -5,81 | 22.995 | -14,16 | ||||
| 2026-04-24 | 13F | Keybank National Association/oh | 2.334 | 347 | ||||||
| 2026-02-10 | 13F | Jupiter Asset Management Ltd | 45.453 | 5.513 | ||||||
| 2026-02-11 | 13F | Jpmorgan Chase & Co | 82.920 | 247,11 | 10.058 | 213,04 | ||||
| 2025-11-13 | 13F | Wells Fargo & Company/mn | Call | 0 | -100,00 | 0 | -100,00 | |||
| 2026-02-13 | 13F | Rhumbline Advisers | 18.949 | -7,84 | 2.299 | -16,89 | ||||
| 2026-02-12 | 13F | Cibc World Markets Corp | 0 | -100,00 | 0 | |||||
| 2026-04-21 | 13F | Sugar Maple Asset Management, LLC | 13.912 | 0,00 | 2.068 | 22,53 | ||||
| 2026-02-17 | 13F | ExodusPoint Capital Management, LP | 0 | -100,00 | 0 | -100,00 | ||||
| 2026-02-12 | 13F | EAM Investors, LLC | 0 | -100,00 | 0 | |||||
| 2026-04-10 | 13F | Magnus Financial Group LLC | 1.987 | 295 | ||||||
| 2026-04-22 | 13F | Sterling Capital Management LLC | 511 | -11,28 | 76 | 8,70 | ||||
| 2026-02-09 | 13F | Hartland & Co., LLC | 451 | 192,86 | 55 | 170,00 | ||||
| 2026-02-18 | 13F | Mendon Capital Advisors Corp | 20.000 | 1,01 | 2.426 | -8,31 | ||||
| 2026-01-12 | 13F | Schaper Benz & Wise Investment Counsel Inc/wi | 6.379 | 0,00 | 774 | -9,80 | ||||
| 2026-02-12 | 13F | DRW Securities, LLC | 4.136 | 502 | ||||||
| 2025-11-14 | 13F | Point72 Asia (Singapore) Pte. Ltd. | 314 | 42 | ||||||
| 2026-02-12 | 13F | Integrated Quantitative Investments LLC | 3.675 | 446 | ||||||
| 2026-02-12 | 13F | Voya Investment Management Llc | 2.490 | -0,88 | 302 | -10,39 | ||||
| 2026-04-06 | 13F | GAMMA Investing LLC | 98 | 81,48 | 15 | 133,33 | ||||
| 2026-02-06 | 13F | HighTower Advisors, LLC | 3.919 | -0,73 | 475 | -10,55 | ||||
| 2026-02-13 | 13F | Manufacturers Life Insurance Company, The | 0 | -100,00 | 0 | |||||
| 2026-02-17 | 13F | Man Group plc | 3.229 | 392 | ||||||
| 2026-01-28 | 13F | Klp Kapitalforvaltning As | 2.800 | -6,67 | 340 | -15,88 | ||||
| 2026-02-13 | 13F | Prudential Financial Inc | 0 | -100,00 | 0 | |||||
| 2026-02-13 | 13F | Arrowstreet Capital, Limited Partnership | 10.136 | 1.229 | ||||||
| 2026-02-09 | 13F | Jackson Creek Investment Advisors LLC | 13.226 | -3,07 | 2 | 0,00 | ||||
| 2025-11-13 | 13F | Brandywine Global Investment Management, LLC | 0 | -100,00 | 0 | |||||
| 2026-02-05 | 13F | Bessemer Group Inc | 24.278 | 3 | ||||||
| 2026-02-17 | 13F | Aqr Capital Management Llc | 13.482 | 53,97 | 1.635 | 38,91 | ||||
| 2026-04-15 | 13F | Merit Financial Group, LLC | 47.032 | -4,63 | 6.990 | 16,85 | ||||
| 2026-02-17 | 13F | Advisor Group Holdings, Inc. | 14.478 | 8,11 | 1.756 | -4,77 | ||||
| 2026-02-13 | 13F | Wells Fargo & Company/mn | 15.243 | 48,77 | 1.849 | 34,11 | ||||
| 2026-02-10 | 13F | Connor, Clark & Lunn Investment Management Ltd. | 4.310 | 3,13 | 523 | -7,12 | ||||
| 2026-02-12 | 13F | Commonwealth Equity Services, Llc | 1.770 | 13,24 | 215 | |||||
| 2026-02-13 | 13F | Caxton Associates Llp | 2.710 | 329 | ||||||
| 2025-11-14 | 13F | Toroso Investments, LLC | 0 | -100,00 | 0 | -100,00 | ||||
| 2026-02-09 | 13F | Fisher Asset Management, LLC | 5.811 | -28,62 | 705 | -35,65 | ||||
| 2026-02-06 | 13F | Pnc Financial Services Group, Inc. | 8.626 | 0,00 | 1.046 | -9,83 | ||||
| 2026-02-13 | 13F | Stifel Financial Corp | 0 | -100,00 | 0 | |||||
| 2026-04-16 | 13F | Diversified Trust Co | 3.304 | 491 | ||||||
| 2026-02-17 | 13F | Point72 Asset Management, L.P. | 27.671 | 690,60 | 3.356 | 614,04 | ||||
| 2026-04-02 | 13F | Ares Financial Consulting, LLC | 12 | 2 | ||||||
| 2026-02-12 | 13F | MetLife Investment Management, LLC | 7.374 | -7,85 | 894 | -16,91 | ||||
| 2026-02-13 | 13F | Marshall Wace, Llp | 35.668 | 4.327 | ||||||
| 2026-02-13 | 13F | Parkside Financial Bank & Trust | 587 | -0,34 | 71 | -10,13 | ||||
| 2026-01-29 | 13F | Vanguard Group Inc | 737.578 | 3,14 | 89.468 | -6,98 | ||||
| 2025-11-14 | 13F | Point72 (DIFC) Ltd | 525 | 5,42 | 71 | 14,75 | ||||
| 2026-02-17 | 13F | Dark Forest Capital Management Lp | 3.587 | -47,24 | 435 | -52,41 | ||||
| 2025-11-17 | 13F | Jacobs Levy Equity Management, Inc | 0 | -100,00 | 0 | -100,00 | ||||
| 2026-02-17 | 13F | Tudor Investment Corp Et Al | 84.708 | 195,95 | 10.275 | 166,95 | ||||
| 2026-01-20 | 13F | Harbor Capital Advisors, Inc. | 62 | -1,59 | 0 | |||||
| 2026-02-06 | 13F | Legato Capital Management LLC | 3.675 | 446 | ||||||
| 2026-02-12 | 13F | Renaissance Technologies Llc | 38.332 | 4.650 | ||||||
| 2026-02-13 | 13F | SRS Capital Advisors, Inc. | 75 | -64,95 | 9 | -67,86 | ||||
| 2026-04-24 | 13F | Triasima Portfolio Management inc. | 3.777 | 1,53 | 561 | 24,39 | ||||
| 2026-02-03 | 13F | Ballentine Partners, LLC | 1.871 | -0,74 | 227 | -10,67 | ||||
| 2026-04-21 | 13F | McGlone Suttner Wealth Management, Inc. | 4.459 | 8,60 | 663 | 32,93 | ||||
| 2026-02-17 | 13F | D. E. Shaw & Co., Inc. | 42.697 | 5.179 | ||||||
| 2026-02-09 | 13F | Harbour Investments, Inc. | 1.394 | 0,00 | 169 | -9,63 | ||||
| 2026-02-13 | 13F | Victory Capital Management Inc | 0 | -100,00 | 0 |