Grundlæggende statistik
| Institutionelle ejere | 52 total, 52 long only, 0 short only, 0 long/short - change of -3,70% MRQ |
| Gennemsnitlig porteføljeallokering | 0.0036 % - change of 51,30% MRQ |
| Institutionelle aktier (lange) | 179.998 (ex 13D/G) - change of 0,02MM shares 10,59% MRQ |
| Institutionel værdi (lang) | $ 5.985 USD ($1000) |
Institutionelt ejerskab og aktionærer
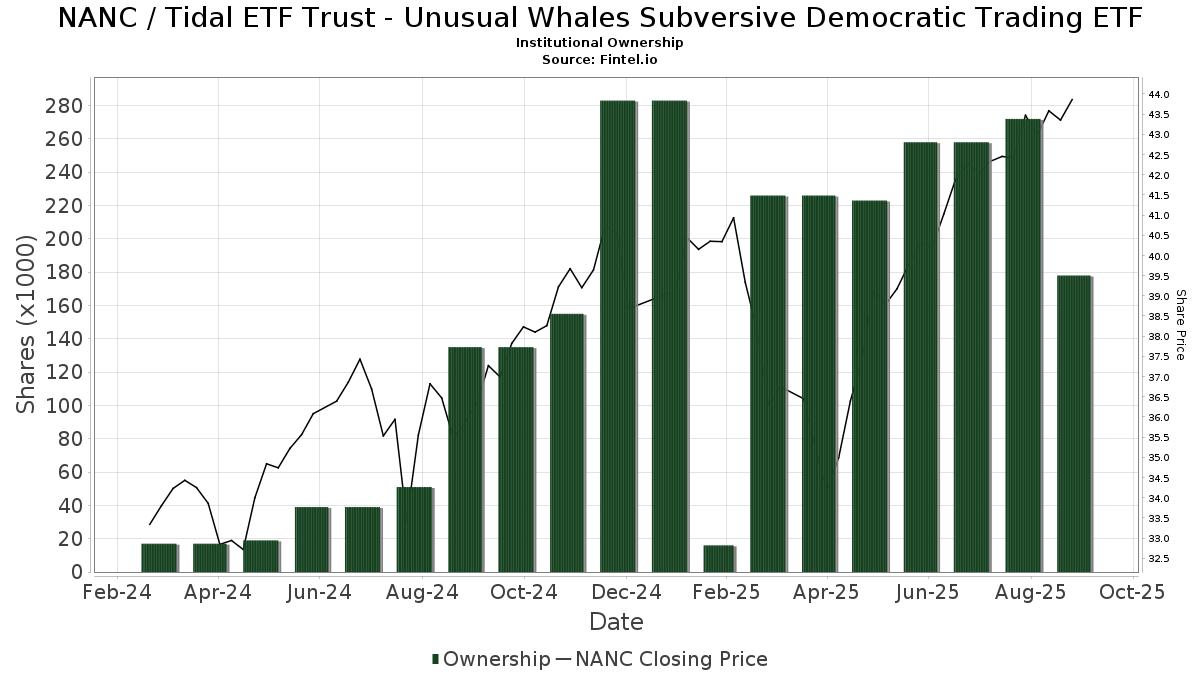
Tidal ETF Trust - Unusual Whales Subversive Democratic Trading ETF (US:NANC) har 52 institutionelle ejere og aktionærer, der har indsendt 13D/G- eller 13F-formularer til Securities Exchange Commission (SEC). Disse institutioner har i alt 179,998 aktier. Største aktionærer omfatter Flow Traders U.s. Llc, Geneos Wealth Management Inc., AE Wealth Management LLC, Raymond James Financial Inc, Bank Of Montreal /can/, Mutual Advisors, LLC, Cambridge Investment Research Advisors, Inc., Citadel Advisors Llc, HighTower Advisors, LLC, and Lake Street Financial Llc .
Tidal ETF Trust - Unusual Whales Subversive Democratic Trading ETF (BATS:NANC) institutionel ejerskabsstruktur viser aktuelle positioner i virksomheden efter institutioner og fonde, samt seneste ændringer i positionsstørrelse. Større aktionærer kan omfatte individuelle investorer, investeringsforeninger, hedgefonde eller institutioner. Skema 13D angiver, at investoren besidder (eller besidder) mere end 5 % af virksomheden og har til hensigt (eller har til hensigt at) aktivt at forfølge en ændring i forretningsstrategi. Skema 13G indikerer en passiv investering på over 5%.
The share price as of March 13, 2026 is 43,37 / share. Previously, on March 17, 2025, the share price was 36,80 / share. This represents an increase of 17,85% over that period.
Fondens stemningsscore
Fund Sentiment Score (fka Ownership Accumulation Score) finder de aktier, der bliver mest købt af fonde. Det er resultatet af en sofistikeret, multi-faktor kvantitativ model, der identificerer virksomheder med de højeste niveauer af institutionel akkumulering. Scoringsmodellen bruger en kombination af den samlede stigning i oplyste ejere, ændringerne i porteføljeallokeringer i disse ejere og andre målinger. Tallet går fra 0 til 100, hvor højere tal indikerer et højere niveau af akkumulering for sine jævnaldrende, og 50 er gennemsnittet.
Opdateringsfrekvens: Dagligt
Se Ownership Explorer, som giver en liste over højest rangerende virksomheder.
AI+ Ask Fintel’s AI assistant about Tidal ETF Trust - Unusual Whales Subversive Democratic Trading ETF.
Select a question to share a public post with an AI-crafted answer.
Thinking of good questions…
Institutionel Put/Call-forhold
Ud over at indberette standardaktie- og gældsudstedelser skal institutter med mere end 100 mill. aktiver under forvaltning også oplyse deres put- og call-optionsbeholdninger. Da salgsoptioner generelt indikerer negativ stemning, og købsoptioner indikerer positiv stemning, kan vi få en fornemmelse af den overordnede institutionelle stemning ved at plotte forholdet mellem put og kald. Diagrammet til højre viser det historiske put/call-forhold for dette instrument.
Brug af Put/Call Ratio som en indikator for investorernes stemning overvinder en af de vigtigste mangler ved at bruge totalt institutionelt ejerskab, som er, at en betydelig mængde af aktiver under forvaltning investeres passivt for at spore indekser. Passivt forvaltede fonde køber typisk ikke optioner, så indikatoren for put/call-forholdet følger mere nøje følelsen af aktivt forvaltede fonde.

13F og NPORT arkivering
Detaljer om 13F-arkivering er gratis. Detaljer om NP-ansøgninger kræver et premium-medlemskab. Grønne rækker angiver nye positioner. Røde rækker angiver lukkede positioner. Klik på linket ikon for at se den fulde transaktionshistorik.
Opgrader
for at låse premium-data op og eksportere til Excel ![]() .
.
| Fil dato | Kilde | Investor | Type | Gennemsnitlig pris (Øst) |
Aktier | Δ Aktier (%) |
Rapporteret Værdi ($1000) |
Δ Værdi (%) |
Port Alloc (%) |
|
|---|---|---|---|---|---|---|---|---|---|---|
| 2026-02-02 | 13F | Pittenger & Anderson Inc | 13 | 0,00 | 1 | |||||
| 2026-02-05 | 13F | Cambridge Investment Research Advisors, Inc. | 7.968 | 2,31 | 0 | |||||
| 2026-02-12 | 13F | Principal Securities, Inc. | 0 | -100,00 | 0 | -100,00 | ||||
| 2026-02-13 | 13F | Flow Traders U.s. Llc | 38.216 | 2 | ||||||
| 2026-02-11 | 13F | Strategic Advocates LLC | 4 | 0,00 | 0 | |||||
| 2025-10-21 | 13F | SOA Wealth Advisors, LLC. | 0 | -100,00 | 0 | |||||
| 2026-02-02 | 13F | Mutual Advisors, LLC | 11.321 | 0,00 | 517 | 0,78 | ||||
| 2026-01-07 | 13F | Lake Street Financial Llc | 5.230 | 0,00 | 239 | 1,71 | ||||
| 2026-02-17 | 13F | Susquehanna International Group, Llp | 0 | -100,00 | 0 | |||||
| 2026-02-11 | 13F | IMA Wealth, Inc. | 139 | 0,00 | 6 | 0,00 | ||||
| 2026-01-28 | 13F | Geneos Wealth Management Inc. | 24.784 | 4,38 | 1.131 | 6,40 | ||||
| 2026-01-29 | 13F | Concord Wealth Partners | 459 | 21 | ||||||
| 2026-02-12 | 13F | Commonwealth Equity Services, Llc | 5.119 | -78,74 | 234 | 23.200,00 | ||||
| 2026-01-13 | 13F | CoreCap Advisors, LLC | 5 | 0 | ||||||
| 2026-02-10 | 13F | Basepoint Wealth LLC | 14 | 1 | ||||||
| 2026-02-10 | 13F | Ritter Daniher Financial Advisory LLC / DE | 200 | 9 | ||||||
| 2026-01-20 | 13F | AdvisorNet Financial, Inc | 25 | 0,00 | 1 | 0,00 | ||||
| 2026-01-26 | 13F | AE Wealth Management LLC | 22.896 | -1,13 | 1.045 | 0,68 | ||||
| 2026-01-05 | 13F | GoalVest Advisory LLC | 355 | 0,00 | 16 | 6,67 | ||||
| 2026-02-06 | 13F | Larson Financial Group LLC | 319 | 0,00 | 15 | 0,00 | ||||
| 2026-02-09 | 13F | Harbour Investments, Inc. | 1.948 | 3.958,33 | 89 | 4.300,00 | ||||
| 2026-02-03 | 13F | International Assets Investment Management, Llc | 225 | -95,34 | 10 | -95,02 | ||||
| 2026-02-17 | 13F | Royal Bank Of Canada | 495 | 27,58 | 23 | 35,29 | ||||
| 2026-02-09 | 13F | Key FInancial Inc | 68 | 0,00 | 3 | 0,00 | ||||
| 2026-01-23 | 13F | Robbins Farley Llc | 1 | 0,00 | 0 | |||||
| 2026-02-11 | 13F | Parallel Advisors, LLC | 47 | 0,00 | 2 | 0,00 | ||||
| 2026-01-20 | 13F | Investment Research & Advisory Group, Inc. | 152 | 0,00 | 7 | 0,00 | ||||
| 2026-02-02 | 13F | Cornerstone Planning Group LLC | 0 | -100,00 | 0 | |||||
| 2026-01-30 | 13F | Archer Investment Corp | 70 | 70,73 | 3 | 200,00 | ||||
| 2026-01-26 | 13F | Main Street Group, LTD | 0 | -100,00 | 0 | |||||
| 2026-02-06 | 13F | HighTower Advisors, LLC | 5.691 | 1,88 | 260 | 3,60 | ||||
| 2026-02-12 | 13F | CIBC Private Wealth Group, LLC | 0 | -100,00 | 0 | |||||
| 2026-02-11 | 13F | Group One Trading, L.p. | 0 | -100,00 | 0 | |||||
| 2026-02-17 | 13F | Raymond James Financial Inc | 16.722 | 763 | ||||||
| 2026-02-13 | 13F | Kestra Advisory Services, LLC | 819 | 37 | ||||||
| 2026-02-20 | 13F | Sunbelt Securities, Inc. | 650 | 0,00 | 30 | 0,00 | ||||
| 2026-02-17 | 13F | Ancora Advisors, LLC | 150 | 0,00 | 7 | 0,00 | ||||
| 2026-02-12 | 13F | Bank Of Montreal /can/ | 14.153 | -1,72 | 646 | 0,00 | ||||
| 2026-02-17 | 13F | Bank Of America Corp /de/ | Call | 0 | -100,00 | 0 | ||||
| 2026-02-13 | 13F | Morgan Stanley | 1.259 | 0,00 | 57 | 1,79 | ||||
| 2026-02-06 | 13F | IFP Advisors, Inc | 114 | -26,45 | 5 | -16,67 | ||||
| 2026-02-17 | 13F | Fmr Llc | 2 | 0 | ||||||
| 2026-01-16 | 13F | Crewe Advisors LLC | 27 | 0,00 | 1 | 0,00 | ||||
| 2026-02-04 | 13F | Clark Wealth Partners | 0 | -100,00 | 0 | |||||
| 2026-01-14 | 13F | Tradewinds Capital Management, LLC | 29 | 0,00 | 1 | 0,00 | ||||
| 2026-02-17 | 13F | Jones Financial Companies Lllp | 0 | -100,00 | 0 | |||||
| 2026-01-23 | 13F | Farther Finance Advisors, LLC | 4.900 | 160,08 | 224 | 165,48 | ||||
| 2026-02-17 | 13F | Advisor Group Holdings, Inc. | 206 | 3,00 | 9 | 12,50 | ||||
| 2026-01-26 | 13F | Cwm, Llc | 2.211 | 0,00 | 0 | |||||
| 2026-02-10 | 13F | Root Financial Partners, LLC | 278 | 0,00 | 13 | 0,00 | ||||
| 2026-01-26 | 13F | Northwest Capital Management Inc | 76 | 0,00 | 3 | 0,00 | ||||
| 2026-02-06 | 13F | EverSource Wealth Advisors, LLC | 1 | -99,78 | 0 | -100,00 | ||||
| 2026-02-17 | 13F | Citadel Advisors Llc | 6.971 | -19,58 | 318 | -18,04 | ||||
| 2025-11-03 | 13F | LRI Investments, LLC | 0 | -100,00 | 0 | |||||
| 2026-02-12 | 13F | Wealthspire Advisors, LLC | 0 | -100,00 | 0 | |||||
| 2026-02-17 | 13F | Advisory Services Network, LLC | 0 | -100,00 | 0 | |||||
| 2026-02-13 | 13F | SRS Capital Advisors, Inc. | 543 | 25 | ||||||
| 2025-11-14 | 13F | Old Mission Capital Llc | 0 | -100,00 | 0 | -100,00 | ||||
| 2026-02-12 | 13F | Steward Partners Investment Advisory, Llc | 196 | 44,12 | 9 | 33,33 | ||||
| 2026-02-12 | 13F | Hollencrest Capital Management | 305 | 0,00 | 14 | 0,00 | ||||
| 2026-02-09 | 13F | HBK Sorce Advisory LLC | 0 | -100,00 | 0 | -100,00 | ||||
| 2026-01-27 | 13F | Friedenthal Financial | 595 | 22,18 | 27 | 28,57 | ||||
| 2026-02-11 | 13F | Jpmorgan Chase & Co | 75 | -27,88 | 3 | -25,00 | ||||
| 2026-02-09 | 13F | Blue Bell Private Wealth Management, Llc | 15 | 0,00 | 1 | |||||
| 2026-02-11 | 13F | Simplex Trading, Llc | 3.694 | 385,41 | 169 | |||||
| 2026-01-30 | 13F | North Star Investment Management Corp. | 50 | 0,00 | 2 | 0,00 | ||||
| 2026-01-29 | 13F | UBS Group AG | 193 | 49,61 | 9 | 60,00 |