Grundlæggende statistik
| Institutionelle ejere | 45 total, 45 long only, 0 short only, 0 long/short - change of 18,42% MRQ |
| Gennemsnitlig porteføljeallokering | 0.3987 % - change of 41,87% MRQ |
| Institutionelle aktier (lange) | 6.780.143 (ex 13D/G) - change of 1,09MM shares 19,19% MRQ |
| Institutionel værdi (lang) | $ 283.322 USD ($1000) |
Institutionelt ejerskab og aktionærer
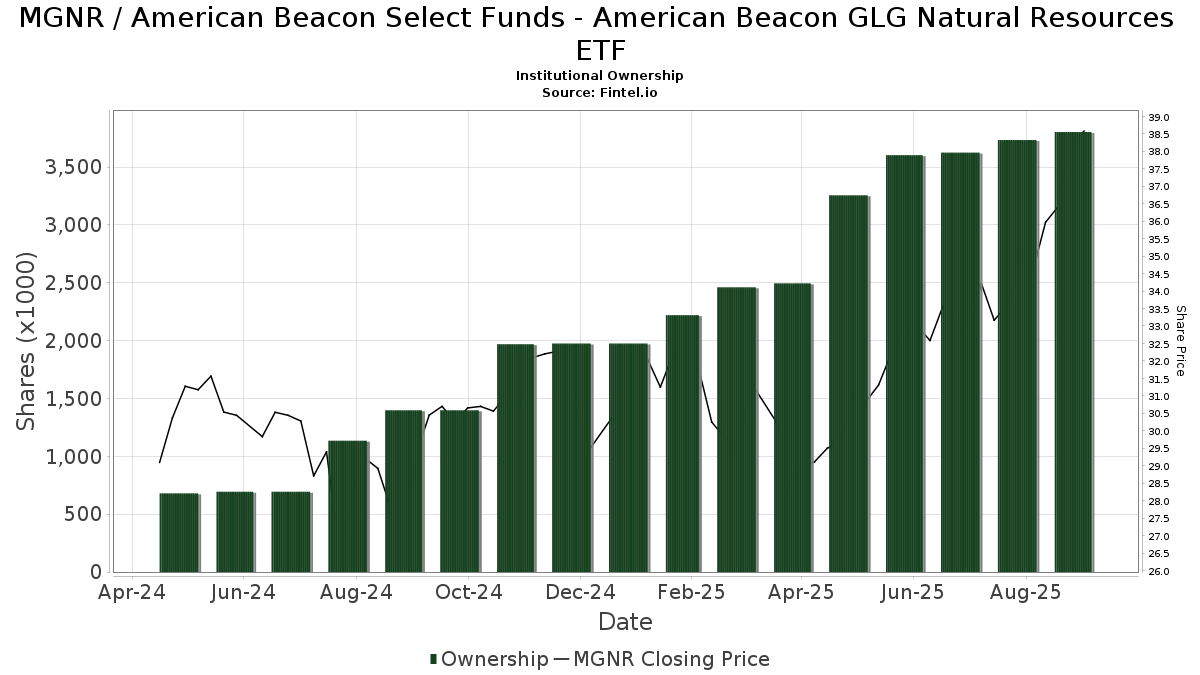
American Beacon Select Funds - American Beacon GLG Natural Resources ETF (US:MGNR) har 45 institutionelle ejere og aktionærer, der har indsendt 13D/G- eller 13F-formularer til Securities Exchange Commission (SEC). Disse institutioner har i alt 6,780,143 aktier. Største aktionærer omfatter Sendero Wealth Management, LLC, Midland Wealth Advisors Llc, Wealth Enhancement Advisory Services, Llc, Morgan Stanley, Janney Montgomery Scott LLC, LPL Financial LLC, Woodard & Co Asset Management Group Inc /adv, Cwm, Llc, Advisor Group Holdings, Inc., and Quadcap Wealth Management, LLC .
American Beacon Select Funds - American Beacon GLG Natural Resources ETF (ARCA:MGNR) institutionel ejerskabsstruktur viser aktuelle positioner i virksomheden efter institutioner og fonde, samt seneste ændringer i positionsstørrelse. Større aktionærer kan omfatte individuelle investorer, investeringsforeninger, hedgefonde eller institutioner. Skema 13D angiver, at investoren besidder (eller besidder) mere end 5 % af virksomheden og har til hensigt (eller har til hensigt at) aktivt at forfølge en ændring i forretningsstrategi. Skema 13G indikerer en passiv investering på over 5%.
The share price as of April 24, 2026 is 53,81 / share. Previously, on April 28, 2025, the share price was 29,98 / share. This represents an increase of 79,48% over that period.
Fondens stemningsscore
Fund Sentiment Score (fka Ownership Accumulation Score) finder de aktier, der bliver mest købt af fonde. Det er resultatet af en sofistikeret, multi-faktor kvantitativ model, der identificerer virksomheder med de højeste niveauer af institutionel akkumulering. Scoringsmodellen bruger en kombination af den samlede stigning i oplyste ejere, ændringerne i porteføljeallokeringer i disse ejere og andre målinger. Tallet går fra 0 til 100, hvor højere tal indikerer et højere niveau af akkumulering for sine jævnaldrende, og 50 er gennemsnittet.
Opdateringsfrekvens: Dagligt
Se Ownership Explorer, som giver en liste over højest rangerende virksomheder.
AI+ Ask Fintel’s AI assistant about American Beacon Select Funds - American Beacon GLG Natural Resources ETF.
Select a question to share a public post with an AI-crafted answer.
Thinking of good questions…
Institutionel Put/Call-forhold
Ud over at indberette standardaktie- og gældsudstedelser skal institutter med mere end 100 mill. aktiver under forvaltning også oplyse deres put- og call-optionsbeholdninger. Da salgsoptioner generelt indikerer negativ stemning, og købsoptioner indikerer positiv stemning, kan vi få en fornemmelse af den overordnede institutionelle stemning ved at plotte forholdet mellem put og kald. Diagrammet til højre viser det historiske put/call-forhold for dette instrument.
Brug af Put/Call Ratio som en indikator for investorernes stemning overvinder en af de vigtigste mangler ved at bruge totalt institutionelt ejerskab, som er, at en betydelig mængde af aktiver under forvaltning investeres passivt for at spore indekser. Passivt forvaltede fonde køber typisk ikke optioner, så indikatoren for put/call-forholdet følger mere nøje følelsen af aktivt forvaltede fonde.
13F og NPORT arkivering
Detaljer om 13F-arkivering er gratis. Detaljer om NP-ansøgninger kræver et premium-medlemskab. Grønne rækker angiver nye positioner. Røde rækker angiver lukkede positioner. Klik på linket ikon for at se den fulde transaktionshistorik.
Opgrader
for at låse premium-data op og eksportere til Excel ![]() .
.
| Fil dato | Kilde | Investor | Type | Gennemsnitlig pris (Øst) |
Aktier | Δ Aktier (%) |
Rapporteret Værdi ($1000) |
Δ Værdi (%) |
Port Alloc (%) |
|
|---|---|---|---|---|---|---|---|---|---|---|
| 2026-04-08 | 13F | Wealth Enhancement Advisory Services, Llc | 742.233 | -42,77 | 38.351 | -35,81 | ||||
| 2026-01-28 | 13F | West Michigan Advisors, Llc | 8.012 | 353 | ||||||
| 2026-02-11 | 13F | SOUTH STATE Corp | 461 | 20 | ||||||
| 2026-04-13 | 13F | IFP Advisors, Inc | 1.000 | 52 | ||||||
| 2026-02-13 | 13F | Navis Wealth Advisors, LLC | 18.342 | 809 | ||||||
| 2026-04-21 | 13F | Magnolia Private Wealth, LLC | 18.905 | 46,61 | 975 | 71,65 | ||||
| 2026-02-05 | 13F | Cambridge Investment Research Advisors, Inc. | 26.201 | 7,95 | 1 | |||||
| 2026-01-27 | 13F | Regions Financial Corp | 474 | 14,22 | 0 | |||||
| 2026-02-03 | 13F | International Assets Investment Management, Llc | 12.900 | 0,00 | 569 | 32,40 | ||||
| 2026-02-12 | 13F | Jane Street Group, Llc | 0 | -100,00 | 0 | -100,00 | ||||
| 2026-02-10 | 13F | IAG Wealth Partners, LLC | 85 | 0,00 | 4 | 0,00 | ||||
| 2026-02-11 | 13F | LPL Financial LLC | 370.860 | -0,11 | 16.355 | 8,90 | ||||
| 2026-02-06 | 13F | HighTower Advisors, LLC | 48.238 | 72,65 | 2.127 | 88,23 | ||||
| 2026-04-07 | 13F | Farther Finance Advisors, LLC | 5.589 | -0,85 | 290 | 16,94 | ||||
| 2026-04-22 | 13F | Sendero Wealth Management, LLC | 1.459.500 | 24,90 | 75.281 | 46,08 | ||||
| 2026-02-13 | 13F | Maia Wealth LLC | 30.103 | 11,03 | 1.545 | 37,49 | ||||
| 2026-02-10 | 13F | Anchor Capital Advisors Llc | 74.600 | -3,02 | 3.290 | 5,72 | ||||
| 2026-04-10 | 13F | Centurion Wealth Management LLC | 8.559 | 3,33 | 441 | 20,82 | ||||
| 2026-02-09 | 13F | Kingsview Wealth Management, LLC | 17.440 | 769 | ||||||
| 2026-02-10 | 13F/A | Northwestern Mutual Wealth Management Co | 1.411 | 62 | ||||||
| 2026-04-23 | 13F | Harbor Investment Advisory, Llc | 94.862 | 19,87 | 4.893 | 40,21 | ||||
| 2026-01-26 | 13F | Cwm, Llc | 224.209 | 20,90 | 10 | 28,57 | ||||
| 2026-04-22 | 13F | SFG Wealth Management, LLC. | 53.975 | 312,84 | 2.784 | 383,33 | ||||
| 2026-01-29 | 13F | Quadcap Wealth Management, LLC | 114.769 | 4,08 | 5.061 | 13,48 | ||||
| 2026-02-10 | 13F | Envestnet Asset Management Inc | 73.454 | 4,07 | 3.239 | 13,45 | ||||
| 2026-02-17 | 13F | Gladstone Institutional Advisory LLC | 6.218 | 274 | ||||||
| 2026-02-09 | 13F | Harbour Investments, Inc. | 5.625 | 41,79 | 248 | 55,00 | ||||
| 2026-02-13 | 13F | Kestra Advisory Services, LLC | 0 | -100,00 | 0 | |||||
| 2026-01-20 | 13F | Philip James Wealth Mangement, LLC | 13.481 | 7,51 | 595 | 17,16 | ||||
| 2026-02-10 | 13F | Principia Wealth Advisory, LLC | 5.971 | -0,40 | 263 | 8,68 | ||||
| 2026-04-14 | 13F | Nbc Securities, Inc. | 200 | 10 | ||||||
| 2026-02-17 | 13F | Advisor Group Holdings, Inc. | 223.988 | 35,66 | 9.878 | 48,10 | ||||
| 2026-02-18 | 13F | GWM Advisors LLC | 83.687 | -42,40 | 3.691 | -37,20 | ||||
| 2026-04-22 | 13F | Janney Montgomery Scott LLC | 539.000 | 81,67 | 28 | 107,69 | ||||
| 2026-02-05 | 13F | Financial Security Advisor, Inc. | 40.659 | 77,46 | 1.793 | 93,63 | ||||
| 2026-04-14 | 13F | Tradewinds Capital Management, LLC | 98 | 5 | ||||||
| 2026-01-29 | 13F | Comerica Bank | 3.167 | 18,61 | 140 | 29,91 | ||||
| 2026-01-26 | 13F | Midland Wealth Advisors Llc | 1.292.832 | 13,11 | 57.014 | 23,32 | ||||
| 2026-04-22 | 13F | Apollon Wealth Management, LLC | 79.534 | -7,19 | 4.102 | 8,55 | ||||
| 2026-02-17 | 13F | Citadel Advisors Llc | 0 | -100,00 | 0 | |||||
| 2026-02-14 | 13F | Rockefeller Capital Management L.P. | 7.534 | 332 | ||||||
| 2026-02-17 | 13F | Bank Of America Corp /de/ | 12.968 | 166,78 | 572 | 191,33 | ||||
| 2026-04-17 | 13F | Worth Asset Management, LLC | 6.204 | 0,00 | 320 | 17,22 | ||||
| 2026-02-14 | 13F | Whipplewood Advisors, LLC | 17.212 | 176,50 | 759 | 202,39 | ||||
| 2026-04-15 | 13F | Nations Financial Group Inc, /ia/ /adv | 48.950 | 291,60 | 2.525 | 358,08 | ||||
| 2026-02-02 | 13F | Woodard & Co Asset Management Group Inc /adv | 330.547 | 158,15 | 14.577 | 181,46 | ||||
| 2026-01-26 | 13F | Pursuit Wealth Management LLC | 18.308 | 807 | ||||||
| 2026-02-13 | 13F | Morgan Stanley | 637.778 | 5.258,13 | 28.126 | 5.747,40 |