Grundlæggende statistik
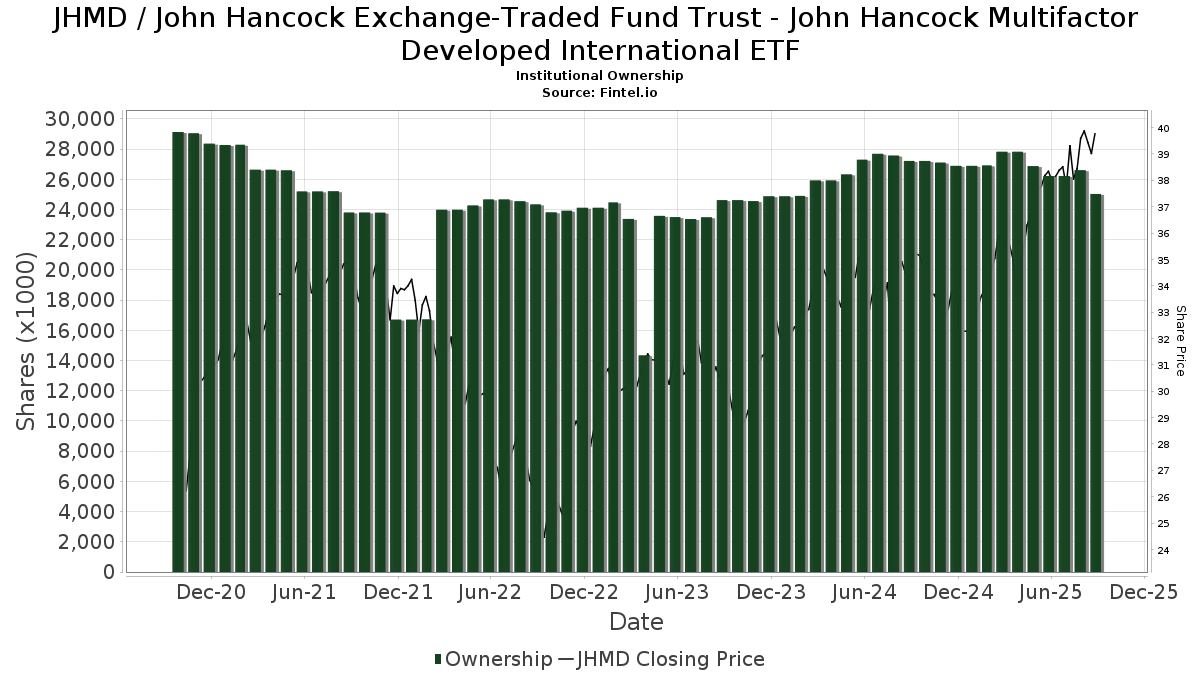
| Institutionelle ejere | 83 total, 83 long only, 0 short only, 0 long/short - change of 2,47% MRQ |
| Gennemsnitlig porteføljeallokering | 0.1931 % - change of -24,52% MRQ |
| Institutionelle aktier (lange) | 9.711.404 (ex 13D/G) - change of -16,29MM shares -62,65% MRQ |
| Institutionel værdi (lang) | $ 355.856 USD ($1000) |
Institutionelt ejerskab og aktionærer
John Hancock Exchange-Traded Fund Trust - John Hancock Multifactor Developed International ETF (US:JHMD) har 83 institutionelle ejere og aktionærer, der har indsendt 13D/G- eller 13F-formularer til Securities Exchange Commission (SEC). Disse institutioner har i alt 9,711,404 aktier. Største aktionærer omfatter Raymond James Financial Inc, LPL Financial LLC, Morgan Stanley, Wells Fargo & Company/mn, Evensky & Katz LLC, Bank Of America Corp /de/, Envestnet Asset Management Inc, Jones Financial Companies Lllp, Magnus Financial Group LLC, and Simplicity Wealth,LLC .
John Hancock Exchange-Traded Fund Trust - John Hancock Multifactor Developed International ETF (ARCA:JHMD) institutionel ejerskabsstruktur viser aktuelle positioner i virksomheden efter institutioner og fonde, samt seneste ændringer i positionsstørrelse. Større aktionærer kan omfatte individuelle investorer, investeringsforeninger, hedgefonde eller institutioner. Skema 13D angiver, at investoren besidder (eller besidder) mere end 5 % af virksomheden og har til hensigt (eller har til hensigt at) aktivt at forfølge en ændring i forretningsstrategi. Skema 13G indikerer en passiv investering på over 5%.
The share price as of May 1, 2026 is 44,32 / share. Previously, on May 5, 2025, the share price was 36,67 / share. This represents an increase of 20,86% over that period.
Fondens stemningsscore
Fund Sentiment Score (fka Ownership Accumulation Score) finder de aktier, der bliver mest købt af fonde. Det er resultatet af en sofistikeret, multi-faktor kvantitativ model, der identificerer virksomheder med de højeste niveauer af institutionel akkumulering. Scoringsmodellen bruger en kombination af den samlede stigning i oplyste ejere, ændringerne i porteføljeallokeringer i disse ejere og andre målinger. Tallet går fra 0 til 100, hvor højere tal indikerer et højere niveau af akkumulering for sine jævnaldrende, og 50 er gennemsnittet.
Opdateringsfrekvens: Dagligt
Se Ownership Explorer, som giver en liste over højest rangerende virksomheder.
AI+ Ask Fintel’s AI assistant about John Hancock Exchange-Traded Fund Trust - John Hancock Multifactor Developed International ETF.
Select a question to share a public post with an AI-crafted answer.
Thinking of good questions…
Institutionel Put/Call-forhold
Ud over at indberette standardaktie- og gældsudstedelser skal institutter med mere end 100 mill. aktiver under forvaltning også oplyse deres put- og call-optionsbeholdninger. Da salgsoptioner generelt indikerer negativ stemning, og købsoptioner indikerer positiv stemning, kan vi få en fornemmelse af den overordnede institutionelle stemning ved at plotte forholdet mellem put og kald. Diagrammet til højre viser det historiske put/call-forhold for dette instrument.
Brug af Put/Call Ratio som en indikator for investorernes stemning overvinder en af de vigtigste mangler ved at bruge totalt institutionelt ejerskab, som er, at en betydelig mængde af aktiver under forvaltning investeres passivt for at spore indekser. Passivt forvaltede fonde køber typisk ikke optioner, så indikatoren for put/call-forholdet følger mere nøje følelsen af aktivt forvaltede fonde.
13F og NPORT arkivering
Detaljer om 13F-arkivering er gratis. Detaljer om NP-ansøgninger kræver et premium-medlemskab. Grønne rækker angiver nye positioner. Røde rækker angiver lukkede positioner. Klik på linket ikon for at se den fulde transaktionshistorik.
Opgrader
for at låse premium-data op og eksportere til Excel ![]() .
.
| Fil dato | Kilde | Investor | Type | Gennemsnitlig pris (Øst) |
Aktier | Δ Aktier (%) |
Rapporteret Værdi ($1000) |
Δ Værdi (%) |
Port Alloc (%) |
|
|---|---|---|---|---|---|---|---|---|---|---|
| 2026-01-12 | 13F | Rialto Wealth Management, LLC | 2.552 | 0,00 | 106 | 2,94 | ||||
| 2026-04-27 | 13F | Sound Income Strategies, LLC | 106 | 0,00 | 5 | 0,00 | ||||
| 2026-01-30 | 13F | Strategic Blueprint, LLC | 0 | -100,00 | 0 | |||||
| 2026-04-15 | 13F | Parsons Capital Management Inc/ri | 10.516 | 0,00 | 446 | 2,06 | ||||
| 2026-02-12 | 13F | Commonwealth Equity Services, Llc | 183.697 | 42,93 | 7.629 | 152.460,00 | ||||
| 2026-02-03 | 13F | Crossmark Global Holdings, Inc. | 0 | -100,00 | 0 | |||||
| 2026-02-10 | 13F | Tidemark, LLC | 536 | 0,00 | 22 | 4,76 | ||||
| 2026-02-17 | 13F | Cetera Investment Advisers | 78.640 | 20,81 | 3.266 | 25,48 | ||||
| 2026-02-05 | 13F | Allworth Financial LP | 981 | 0,00 | 41 | 2,56 | ||||
| 2025-11-04 | 13F | Flaharty Asset Management, LLC | 0 | -100,00 | 0 | -100,00 | ||||
| 2026-04-13 | 13F | LexAurum Advisors, LLC | 15.387 | 129,66 | 652 | 143,82 | ||||
| 2026-04-30 | 13F | Kestra Advisory Services, LLC | 43.783 | -7,21 | 1.855 | -5,31 | ||||
| 2026-02-03 | 13F | Capstone Triton Financial Group, LLC | 5.438 | 0,00 | 226 | 3,69 | ||||
| 2026-04-30 | 13F | Cambridge Investment Research Advisors, Inc. | 84.038 | 3,28 | 4 | 0,00 | ||||
| 2026-04-20 | 13F | Kestra Private Wealth Services, Llc | 5.660 | 0,00 | 240 | 1,70 | ||||
| 2026-01-15 | 13F | Clg Llc | 0 | -100,00 | 0 | |||||
| 2026-02-13 | 13F | Manufacturers Life Insurance Company, The | 0 | -100,00 | 0 | |||||
| 2026-02-17 | 13F | Advisory Services Network, LLC | 35.202 | 24,43 | 1.462 | 29,18 | ||||
| 2025-11-07 | 13F | BOK Financial Private Wealth, Inc. | 0 | -100,00 | 0 | |||||
| 2026-04-13 | 13F | IFP Advisors, Inc | 659 | -0,15 | 28 | 0,00 | ||||
| 2026-04-14 | 13F | SigFig Wealth Management, LLC | 18.970 | -1,03 | 804 | 0,88 | ||||
| 2026-02-17 | 13F | Royal Bank Of Canada | 148.087 | 0,97 | 6.150 | 4,88 | ||||
| 2026-02-12 | 13F | Jane Street Group, Llc | 200.000 | 8.306 | ||||||
| 2026-02-11 | 13F | LPL Financial LLC | 998.364 | 11,33 | 41.462 | 15,65 | ||||
| 2026-04-28 | 13F | Stratos Wealth Partners, LTD. | 16.749 | 0,00 | 710 | 2,01 | ||||
| 2026-04-10 | 13F | Magnus Financial Group LLC | 329.651 | 1,37 | 13.967 | 3,43 | ||||
| 2026-04-30 | 13F | Simplicity Wealth,LLC | 316.683 | 31,65 | 13.418 | 34,32 | ||||
| 2026-01-30 | 13F | Us Bancorp \de\ | 1.770 | 74 | ||||||
| 2026-01-29 | 13F | UBS Group AG | 55.289 | 2,40 | 2.296 | 6,39 | ||||
| 2026-04-07 | 13F | Cooper Financial Group | 73.698 | 3,99 | 3.123 | 6,08 | ||||
| 2026-04-24 | 13F | Private Advisor Group, LLC | 18.209 | 2,32 | 772 | 4,33 | ||||
| 2026-04-23 | 13F | Cornerstone Wealth Management, LLC | 17.460 | 2,95 | 740 | 4,97 | ||||
| 2026-01-29 | 13F | Sanctuary Advisors, LLC | 19.251 | 799 | ||||||
| 2026-01-29 | 13F | Comerica Bank | 3.137 | 15,08 | 130 | 20,37 | ||||
| 2026-04-29 | 13F | Envestnet Portfolio Solutions, Inc. | 21.915 | 68,84 | 929 | 72,17 | ||||
| 2026-04-29 | 13F/A | Salem Investment Counselors Inc | 2.109 | 89 | ||||||
| 2026-02-17 | 13F | Advisor Group Holdings, Inc. | 55.852 | -4,70 | 2.320 | 0,00 | ||||
| 2026-02-17 | 13F | Fmr Llc | 2.633 | -4,71 | 109 | -0,91 | ||||
| 2026-02-14 | 13F | Rockefeller Capital Management L.P. | 2.050 | 1,43 | 85 | 6,25 | ||||
| 2026-02-06 | 13F | Global Retirement Partners, LLC | 30 | 0,00 | 1 | 0,00 | ||||
| 2026-02-13 | 13F | Level Four Advisory Services, Llc | 10.533 | 2,09 | 437 | 6,07 | ||||
| 2026-04-15 | 13F | Iams Wealth Management, Llc | 58.389 | 54,10 | 2.474 | 57,22 | ||||
| 2026-02-02 | 13F | Sun Financial Inc | 5.651 | 235 | ||||||
| 2026-02-12 | 13F | Principal Securities, Inc. | 0 | -100,00 | 0 | -100,00 | ||||
| 2026-02-17 | 13F | IHT Wealth Management, LLC | 6.094 | -9,44 | 253 | -5,95 | ||||
| 2026-04-15 | 13F | Merit Financial Group, LLC | 108.032 | -10,30 | 4.577 | -8,48 | ||||
| 2026-01-12 | 13F | Daymark Wealth Partners, Llc | 12.845 | -22,10 | 533 | -19,12 | ||||
| 2026-02-10 | 13F | Spectrum Wealth Advisory Group, LLC | 247.252 | 3,19 | 10.268 | 7,19 | ||||
| 2026-02-13 | 13F | MAI Capital Management | 160 | 1,27 | 7 | 0,00 | ||||
| 2026-01-14 | 13F | ORG Partners LLC | 7.220 | -18,69 | 300 | -15,77 | ||||
| 2025-11-14 | 13F | Flow Traders U.s. Llc | 0 | -100,00 | 0 | |||||
| 2026-01-23 | 13F | Assetmark, Inc | 1.160 | 866,67 | 48 | 1.100,00 | ||||
| 2026-01-26 | 13F | Cwm, Llc | 10.964 | 0,34 | 0 | |||||
| 2026-02-05 | 13F | Tucker Asset Management Llc | 166 | 7 | ||||||
| 2026-02-11 | 13F | Jpmorgan Chase & Co | 13.007 | -0,69 | 540 | 3,25 | ||||
| 2025-11-12 | 13F | Ameriflex Group, Inc. | 0 | -100,00 | 0 | |||||
| 2026-02-17 | 13F | Raymond James Financial Inc | 1.050.549 | 25,11 | 43.629 | 29,96 | ||||
| 2026-02-13 | 13F | Morgan Stanley | 995.415 | 47,16 | 41.340 | 52,87 | ||||
| 2026-02-10 | 13F/A | Northwestern Mutual Wealth Management Co | 332 | -10,27 | 14 | -7,14 | ||||
| 2026-02-12 | 13F | Brinker Capital Investments, LLC | 125.911 | -3,43 | 5.229 | 0,33 | ||||
| 2026-02-17 | 13F | Aqr Capital Management Llc | 5.898 | -39,49 | 245 | -37,28 | ||||
| 2026-04-16 | 13F | Balboa Wealth Partners | 7.064 | -0,70 | 299 | 1,36 | ||||
| 2026-05-01 | 13F | Fifth Third Bancorp | 6.907 | 293 | ||||||
| 2025-11-06 | 13F | Ameritas Advisory Services, LLC | 0 | -100,00 | 0 | -100,00 | ||||
| 2026-04-22 | 13F | Evensky & Katz LLC | 794.282 | -6,18 | 34 | -5,71 | ||||
| 2026-01-23 | 13F | Westside Investment Management, Inc. | 142 | 0,00 | 6 | 0,00 | ||||
| 2026-02-17 | 13F | Jones Financial Companies Lllp | 519.929 | 63,98 | 21.593 | 71,42 | ||||
| 2026-04-15 | 13F | Ffg Retirement Advisors Llc | 70.109 | 52,68 | 2.971 | 55,74 | ||||
| 2026-02-10 | 13F | Natixis Advisors, L.p. | 22.265 | 1 | ||||||
| 2026-04-16 | 13F | Capital Advisors, Ltd. LLC | 16.960 | 0,00 | 1 | |||||
| 2026-01-29 | 13F | D.a. Davidson & Co. | 39.913 | -3,18 | 1.658 | 0,55 | ||||
| 2026-04-08 | 13F | Wealth Enhancement Advisory Services, Llc | 53.980 | -51,28 | 2.303 | -50,87 | ||||
| 2026-02-13 | 13F | Integrated Wealth Concepts LLC | 31.979 | 1,58 | 1.328 | 5,56 | ||||
| 2026-02-13 | 13F | Wells Fargo & Company/mn | 797.919 | -20,60 | 33.138 | -17,52 | ||||
| 2026-02-17 | 13F | Mercer Global Advisors Inc /adv | 22.763 | -8,51 | 945 | -4,93 | ||||
| 2026-02-12 | 13F | Chilton Capital Management Llc | 510 | 0,00 | 21 | 5,00 | ||||
| 2026-04-07 | 13F | CoreCap Advisors, LLC | 117.887 | 13,80 | 4.995 | 16,09 | ||||
| 2026-05-01 | 13F | Thrivent Financial For Lutherans | 242.018 | -23,16 | 10 | -23,08 | ||||
| 2026-04-22 | 13F | Financially in Tune, LLC | 27.285 | -1,80 | 1.156 | 0,26 | ||||
| 2026-02-17 | 13F | Citadel Advisors Llc | 0 | -100,00 | 0 | |||||
| 2026-04-24 | 13F | Northwest Financial Advisors | 30.027 | 8,68 | 1.272 | 10,90 | ||||
| 2026-02-17 | 13F | Bank Of America Corp /de/ | 715.517 | -18,57 | 29.715 | -15,42 | ||||
| 2026-02-17 | 13F | Ameriprise Financial Inc | 129.684 | -0,33 | 5.373 | 3,29 | ||||
| 2026-01-26 | 13F | AE Wealth Management LLC | 3.890 | 15,09 | 162 | 19,26 | ||||
| 2026-04-28 | 13F | Flagship Harbor Advisors, Llc | 0 | -100,00 | 0 | |||||
| 2026-01-27 | 13F | Institute for Wealth Management, LLC. | 0 | -100,00 | 0 | |||||
| 2025-11-14 | 13F | Strategic Wealth Partners, Ltd. | 23 | 0,00 | 1 | |||||
| 2025-11-05 | 13F | Moloney Securities Asset Management, LLC | 11.697 | 0,00 | 468 | 4,47 | ||||
| 2026-02-13 | 13F | Citigroup Inc | 21.579 | 896 | ||||||
| 2026-02-18 | 13F | GWM Advisors LLC | 8.057 | 103,61 | 335 | 111,39 | ||||
| 2026-02-10 | 13F | Envestnet Asset Management Inc | 555.244 | -0,71 | 23.059 | 3,14 | ||||
| 2026-02-17 | 13F | Zacks Investment Management | 0 | -100,00 | 0 | |||||
| 2026-02-19 | 13F | Birchwood Financial Partners, Inc. | 530 | 22 | ||||||
| 2026-02-10 | 13F | IFG Advisory, LLC | 12.976 | 539 | ||||||
| 2026-02-04 | 13F | MONECO Advisors, LLC | 5.169 | 0,00 | 215 | 3,88 | ||||
| 2026-04-27 | 13F | Pensionmark Financial Group, Llc | 9.874 | 418 | ||||||
| 2026-02-06 | 13F | HighTower Advisors, LLC | 6.545 | 11,50 | 272 | 15,81 | ||||
| 2026-02-17 | 13F | Susquehanna International Group, Llp | 0 | -100,00 | 0 |