Grundlæggende statistik
| Institutionelle ejere | 92 total, 92 long only, 0 short only, 0 long/short - change of 1,10% MRQ |
| Gennemsnitlig porteføljeallokering | 0.2238 % - change of 10,39% MRQ |
| Institutionelle aktier (lange) | 13.706.382 (ex 13D/G) - change of 4,02MM shares 41,54% MRQ |
| Institutionel værdi (lang) | $ 260.061 USD ($1000) |
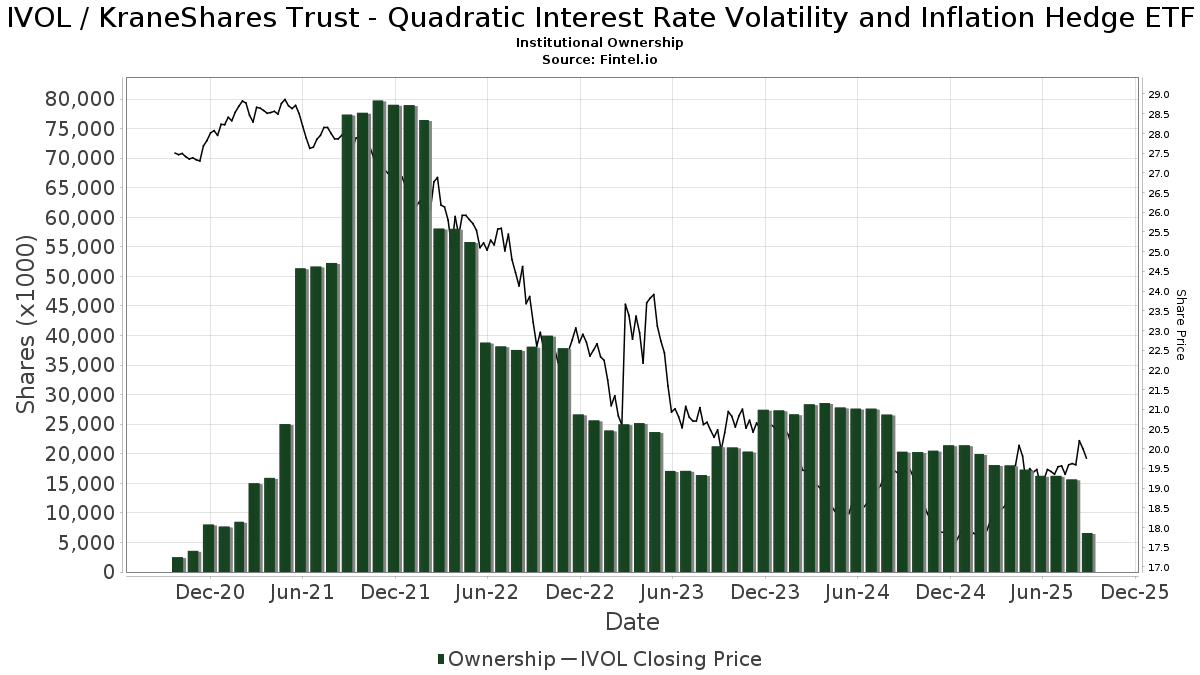
Institutionelt ejerskab og aktionærer
KraneShares Trust - Quadratic Interest Rate Volatility and Inflation Hedge ETF (US:IVOL) har 92 institutionelle ejere og aktionærer, der har indsendt 13D/G- eller 13F-formularer til Securities Exchange Commission (SEC). Disse institutioner har i alt 13,706,382 aktier. Største aktionærer omfatter Jpmorgan Chase & Co, One + One Wealth Management, Llc, Raymond James Financial Inc, Financial Enhancement Group LLC, Wells Fargo & Company/mn, Reuter James Wealth Management, Llc, Morgan Stanley, CacheTech Inc., Adams Wealth Management, and Parkside Investments, LLC .
KraneShares Trust - Quadratic Interest Rate Volatility and Inflation Hedge ETF (ARCA:IVOL) institutionel ejerskabsstruktur viser aktuelle positioner i virksomheden efter institutioner og fonde, samt seneste ændringer i positionsstørrelse. Større aktionærer kan omfatte individuelle investorer, investeringsforeninger, hedgefonde eller institutioner. Skema 13D angiver, at investoren besidder (eller besidder) mere end 5 % af virksomheden og har til hensigt (eller har til hensigt at) aktivt at forfølge en ændring i forretningsstrategi. Skema 13G indikerer en passiv investering på over 5%.
The share price as of April 20, 2026 is 18,58 / share. Previously, on April 21, 2025, the share price was 19,91 / share. This represents a decline of 6,68% over that period.
Fondens stemningsscore
Fund Sentiment Score (fka Ownership Accumulation Score) finder de aktier, der bliver mest købt af fonde. Det er resultatet af en sofistikeret, multi-faktor kvantitativ model, der identificerer virksomheder med de højeste niveauer af institutionel akkumulering. Scoringsmodellen bruger en kombination af den samlede stigning i oplyste ejere, ændringerne i porteføljeallokeringer i disse ejere og andre målinger. Tallet går fra 0 til 100, hvor højere tal indikerer et højere niveau af akkumulering for sine jævnaldrende, og 50 er gennemsnittet.
Opdateringsfrekvens: Dagligt
Se Ownership Explorer, som giver en liste over højest rangerende virksomheder.
AI+ Ask Fintel’s AI assistant about KraneShares Trust - Quadratic Interest Rate Volatility and Inflation Hedge ETF.
Select a question to share a public post with an AI-crafted answer.
Thinking of good questions…
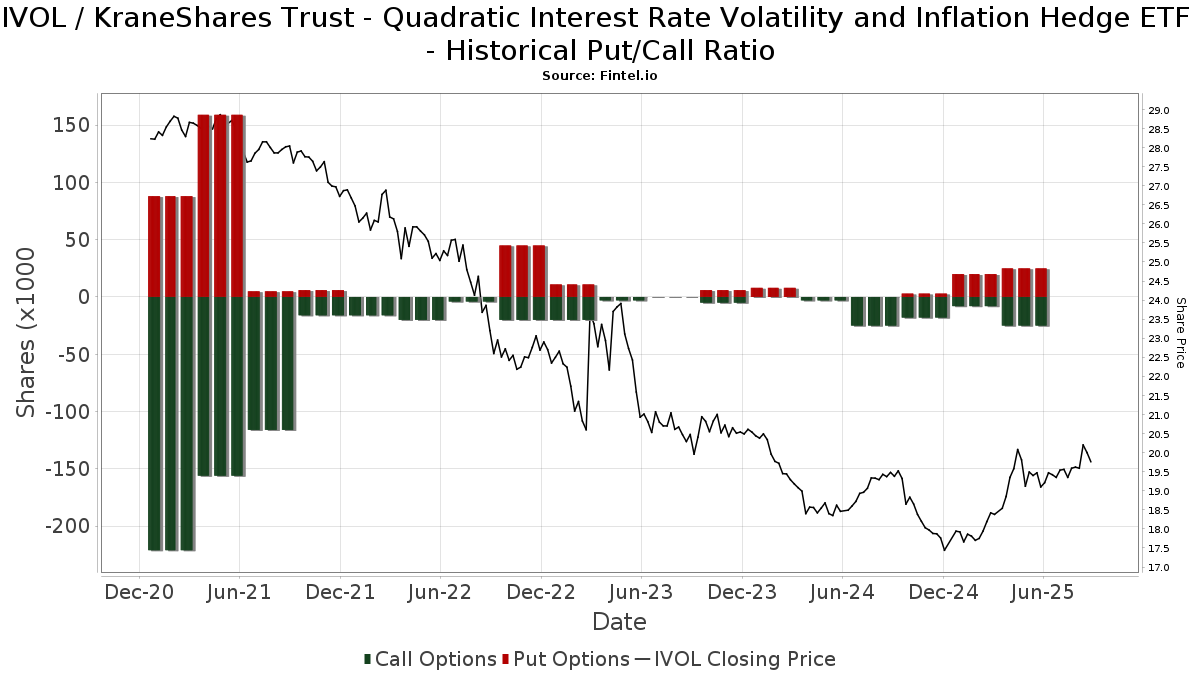
Institutionel Put/Call-forhold
Ud over at indberette standardaktie- og gældsudstedelser skal institutter med mere end 100 mill. aktiver under forvaltning også oplyse deres put- og call-optionsbeholdninger. Da salgsoptioner generelt indikerer negativ stemning, og købsoptioner indikerer positiv stemning, kan vi få en fornemmelse af den overordnede institutionelle stemning ved at plotte forholdet mellem put og kald. Diagrammet til højre viser det historiske put/call-forhold for dette instrument.
Brug af Put/Call Ratio som en indikator for investorernes stemning overvinder en af de vigtigste mangler ved at bruge totalt institutionelt ejerskab, som er, at en betydelig mængde af aktiver under forvaltning investeres passivt for at spore indekser. Passivt forvaltede fonde køber typisk ikke optioner, så indikatoren for put/call-forholdet følger mere nøje følelsen af aktivt forvaltede fonde.
13F og NPORT arkivering
Detaljer om 13F-arkivering er gratis. Detaljer om NP-ansøgninger kræver et premium-medlemskab. Grønne rækker angiver nye positioner. Røde rækker angiver lukkede positioner. Klik på linket ikon for at se den fulde transaktionshistorik.
Opgrader
for at låse premium-data op og eksportere til Excel ![]() .
.
| Fil dato | Kilde | Investor | Type | Gennemsnitlig pris (Øst) |
Aktier | Δ Aktier (%) |
Rapporteret Værdi ($1000) |
Δ Værdi (%) |
Port Alloc (%) |
|
|---|---|---|---|---|---|---|---|---|---|---|
| 2026-02-06 | 13F | Larson Financial Group LLC | 1.317 | 0,92 | 25 | 0,00 | ||||
| 2026-02-11 | 13F | LPL Financial LLC | 123.549 | -4,39 | 2.367 | -4,98 | ||||
| 2026-02-17 | 13F | Two Sigma Securities, Llc | 11.849 | 227 | ||||||
| 2026-04-13 | 13F | IFP Advisors, Inc | 5.275 | 0,00 | 99 | -2,97 | ||||
| 2026-02-02 | 13F | Fifth Third Bancorp | 23.395 | 0,00 | 448 | -0,67 | ||||
| 2026-01-30 | 13F | Oakworth Capital, Inc. | 5.000 | 96 | ||||||
| 2026-01-30 | 13F | Us Bancorp \de\ | 38.200 | -29,62 | 732 | -30,11 | ||||
| 2026-01-30 | 13F | Turning Point Benefit Group, Inc. | 97 | 2 | ||||||
| 2026-02-17 | 13F | Captrust Financial Advisors | 0 | -100,00 | 0 | |||||
| 2026-04-08 | 13F | Parkside Investments, LLC | 404.065 | 3,84 | 7.560 | 1,41 | ||||
| 2026-02-11 | 13F | Jpmorgan Chase & Co | 5.216.227 | 99.943 | ||||||
| 2026-02-05 | 13F | Cambridge Investment Research Advisors, Inc. | 31.488 | 28,20 | 1 | |||||
| 2026-01-29 | 13F | UBS Group AG | 0 | -100,00 | 0 | |||||
| 2026-01-23 | 13F | Reuter James Wealth Management, Llc | 567.991 | -22,86 | 10.883 | -23,34 | ||||
| 2025-11-07 | 13F | Beacon Capital Management, LLC | 0 | -100,00 | 0 | -100,00 | ||||
| 2026-02-13 | 13F | DLD Asset Management, LP | 93.000 | 45,31 | 1.782 | 44,44 | ||||
| 2026-02-06 | 13F | Copia Wealth Management | 1.033 | -78,27 | 20 | -79,12 | ||||
| 2026-02-13 | 13F | SRS Capital Advisors, Inc. | 10 | 0 | ||||||
| 2026-03-19 | 13F | Painted Porch Advisors LLC | 0 | -100,00 | 0 | |||||
| 2026-02-03 | 13F | Richard Bernstein Advisors LLC | 294 | -1,67 | 6 | 0,00 | ||||
| 2026-02-11 | 13F | Strategic Advocates LLC | 1.175 | 97,48 | 23 | 100,00 | ||||
| 2025-11-14 | 13F | Wolverine Trading, Llc | 17.767 | 343 | ||||||
| 2026-02-12 | 13F | Steward Partners Investment Advisory, Llc | 13.987 | -1,75 | 268 | -2,55 | ||||
| 2026-02-17 | 13F | Advisory Services Network, LLC | 0 | -100,00 | 0 | |||||
| 2026-02-14 | 13F | Rockefeller Capital Management L.P. | 3.139 | -6,02 | 60 | -6,25 | ||||
| 2026-02-13 | 13F | Golden State Wealth Management, LLC | 1.549 | 0,00 | 30 | 0,00 | ||||
| 2026-04-07 | 13F | Farther Finance Advisors, LLC | 1.990 | 37 | ||||||
| 2026-01-26 | 13F | BCS Private Wealth Management, Inc. | 184.075 | -0,47 | 3.527 | -1,09 | ||||
| 2026-02-11 | 13F | MCF Advisors LLC | 730 | -92,44 | 14 | -93,01 | ||||
| 2026-02-12 | 13F | Bank Of Montreal /can/ | 200 | 0,00 | 4 | 0,00 | ||||
| 2026-02-13 | 13F | MAI Capital Management | 5.000 | 96 | ||||||
| 2026-02-02 | 13F | Mutual Advisors, LLC | 0 | -100,00 | 0 | |||||
| 2026-02-11 | 13F | Group One Trading, L.p. | 0 | -100,00 | 0 | |||||
| 2026-02-17 | 13F | Raymond James Financial Inc | 832.140 | -1,67 | 15.944 | -2,29 | ||||
| 2026-01-29 | 13F | DecisionPoint Financial, LLC | 65 | 0,00 | 1 | 0,00 | ||||
| 2026-04-08 | 13F | Wealth Enhancement Trust Services, Inc. | 3.130 | -0,16 | 59 | -3,33 | ||||
| 2026-04-10 | 13F | Magnus Financial Group LLC | 16.692 | -0,07 | 312 | -2,50 | ||||
| 2026-02-13 | 13F | Wells Fargo & Company/mn | 660.789 | -17,52 | 12.661 | -18,04 | ||||
| 2026-02-17 | 13F | Aqr Capital Management Llc | 10.888 | -19,76 | 209 | -20,31 | ||||
| 2026-04-20 | 13F | Financial Enhancement Group LLC | 676.284 | 38,43 | 12.565 | 35,94 | ||||
| 2026-02-12 | 13F | Summit Financial, LLC | 39.218 | -7,77 | 751 | -8,30 | ||||
| 2026-02-17 | 13F | Regal Investment Advisors LLC | 240.805 | -6,75 | 4.614 | -7,33 | ||||
| 2026-01-29 | 13F | Comerica Bank | 9.081 | 0,00 | 174 | -1,14 | ||||
| 2026-02-11 | 13F | Simplex Trading, Llc | 10.287 | -55,75 | 197 | |||||
| 2026-02-06 | 13F | Fortis Group Advisors, LLC | 50.738 | -42,71 | 962 | -43,54 | ||||
| 2025-11-14 | 13F | Bank Of America Corp /de/ | 0 | -100,00 | 0 | |||||
| 2026-04-20 | 13F | One + One Wealth Management, Llc | 864.082 | 76,36 | 16.167 | 72,22 | ||||
| 2026-02-17 | 13F | Advisor Group Holdings, Inc. | 113.531 | 16,13 | 2.176 | 15,08 | ||||
| 2026-02-06 | 13F | Mraz, Amerine & Associates, Inc. | 30.989 | 0,00 | 594 | -0,67 | ||||
| 2026-02-17 | 13F | Adams Wealth Management | 419.508 | -0,20 | 8.038 | -0,83 | ||||
| 2026-01-22 | 13F | Brookwood Investment Group LLC | 0 | -100,00 | 0 | |||||
| 2026-02-17 | 13F | Royal Bank Of Canada | 208.846 | -13,66 | 4.001 | -14,22 | ||||
| 2025-11-14 | 13F | Imprint Wealth LLC | 0 | -100,00 | 0 | |||||
| 2026-02-06 | 13F | Global Retirement Partners, LLC | 2.049 | 0,94 | 39 | 0,00 | ||||
| 2026-02-12 | 13F | Jane Street Group, Llc | 80.001 | 1.533 | ||||||
| 2026-04-08 | 13F | Wealth Enhancement Advisory Services, Llc | 318.583 | -19,64 | 5.922 | -21,99 | ||||
| 2026-02-13 | 13F | Kestra Advisory Services, LLC | 4.602 | 88 | ||||||
| 2026-02-13 | 13F | Quarry LP | 25.240 | 18,31 | 484 | 17,52 | ||||
| 2026-02-17 | 13F | Citadel Advisors Llc | 66.762 | 177,63 | 1.279 | 176,24 | ||||
| 2026-02-13 | 13F | Flow Traders U.s. Llc | 0 | -100,00 | 0 | |||||
| 2026-01-28 | 13F | EPG Wealth Management LLC | 8.398 | 0,82 | 161 | 0,00 | ||||
| 2026-02-06 | 13F | HighTower Advisors, LLC | 71.355 | -32,05 | 1.367 | -32,46 | ||||
| 2026-02-13 | 13F | Morgan Stanley | 510.980 | -44,73 | 9.790 | -45,08 | ||||
| 2026-02-17 | 13F | Citadel Advisors Llc | Call | 0 | -100,00 | 0 | ||||
| 2026-02-17 | 13F | Citadel Advisors Llc | Put | 0 | -100,00 | 0 | ||||
| 2026-04-09 | 13F | Tompkins Financial Corp | 630 | -44,25 | 12 | -47,62 | ||||
| 2026-02-12 | 13F | Rossby Financial, LCC | 10.000 | 192 | ||||||
| 2026-02-11 | 13F | Straight Path Wealth Management | 10.579 | -21,29 | 203 | -22,01 | ||||
| 2026-02-17 | 13F | Hilltop Holdings Inc. | 13.399 | -90,48 | 257 | -90,56 | ||||
| 2026-01-21 | 13F | Capital Investment Advisory Services, LLC | 3.035 | -2,25 | 58 | -1,69 | ||||
| 2026-01-29 | 13F | Focused Wealth Management, Inc | 0 | -100,00 | 0 | |||||
| 2026-02-17 | 13F | Blair William & Co/il | 3.350 | -4,01 | 64 | -4,48 | ||||
| 2026-02-17 | 13F/A | Kovack Advisors, Inc. | 13.606 | 261 | ||||||
| 2026-04-17 | 13F | Ambassador Advisors, LLC | 31.639 | 0,43 | 592 | -1,99 | ||||
| 2026-02-10 | 13F/A | Northwestern Mutual Wealth Management Co | 2 | 0 | ||||||
| 2026-02-11 | 13F | TCTC Holdings, LLC | 1.624 | 0,00 | 31 | 0,00 | ||||
| 2026-02-13 | 13F | Bay Colony Advisory Group, Inc d/b/a Bay Colony Advisors | 44.049 | -0,03 | 844 | -0,71 | ||||
| 2026-02-17 | 13F | Qube Research & Technologies Ltd | 190 | -90,10 | 4 | -91,89 | ||||
| 2026-02-17 | 13F | Prostatis Group LLC | 17.534 | -1,60 | 336 | -2,33 | ||||
| 2026-02-13 | 13F | Avos Capital Management, LLC | 79.576 | 1,16 | 1.525 | 0,53 | ||||
| 2026-04-15 | 13F | Trust Co Of Toledo Na /oh/ | 123 | 0,00 | 2 | 0,00 | ||||
| 2026-04-03 | 13F | Investors Research Corp | 642 | 0,00 | 12 | 0,00 | ||||
| 2026-02-17 | 13F | Susquehanna International Group, Llp | 13.041 | -4,43 | 250 | -5,32 | ||||
| 2026-02-18 | 13F | CacheTech Inc. | 442.641 | 5,30 | 8.481 | 4,65 | ||||
| 2026-02-10 | 13F | Belvedere Trading LLC | 0 | -100,00 | 0 | |||||
| 2026-04-10 | 13F | Ballew Advisors, Inc | 147.432 | 3,33 | 2.733 | 1,04 | ||||
| 2026-04-14 | 13F | West Branch Capital LLC | 230 | 0,00 | 4 | 0,00 | ||||
| 2026-02-17 | 13F | Old Mission Capital Llc | 13.032 | -75,31 | 250 | -75,52 | ||||
| 2026-02-02 | 13F | Opes Wealth Management LLC | 169.483 | 2,76 | 3.247 | 2,14 | ||||
| 2026-02-09 | 13F | Bleakley Financial Group, LLC | 202.031 | 24,61 | 3.871 | 23,84 | ||||
| 2026-02-17 | 13F | Quadrature Capital Ltd | 24.619 | 472 | ||||||
| 2026-02-05 | 13F | Allworth Financial LP | 50 | 1 | ||||||
| 2026-02-13 | 13F | Islay Capital Management, Llc | 1.000 | -58,33 | 19 | -58,70 | ||||
| 2026-01-06 | 13F | Sanctuary Advisors, LLC | 43.912 | 820 | ||||||
| 2026-02-18 | 13F | GWM Advisors LLC | 20.545 | 6,15 | 394 | 5,36 | ||||
| 2026-02-17 | 13F | Cetera Investment Advisers | 10.346 | -22,96 | 198 | -23,26 | ||||
| 2026-04-06 | 13F | Highline Wealth Partners Llc | 3 | 0,00 | 0 | |||||
| 2026-02-12 | 13F | CIBC Private Wealth Group, LLC | 22 | 0 | ||||||
| 2026-01-21 | 13F | Sound Income Strategies, LLC | 436 | 445,00 | 8 | 700,00 | ||||
| 2026-02-12 | 13F | Hrt Financial Lp | 26.533 | -1,38 | 1 | |||||
| 2026-02-09 | 13F | Harbour Investments, Inc. | 315 | 0,00 | 6 | 0,00 | ||||
| 2026-02-10 | 13F | Root Financial Partners, LLC | 0 | -100,00 | 0 | |||||
| 2026-02-04 | 13F | Boyd Watterson Asset Management Llc/oh | 0 | -100,00 | 0 | -100,00 | ||||
| 2026-02-12 | 13F | Commonwealth Equity Services, Llc | 34.856 | 7,74 | 668 | |||||
| 2026-01-28 | 13F | Chicago Partners Investment Group LLC | 72.263 | -25,98 | 1.359 | -28,21 | ||||
| 2026-01-26 | 13F | Cwm, Llc | 4.017 | 13,19 | 0 | |||||
| 2026-02-10 | 13F | Belvedere Trading LLC | Call | 0 | -100,00 | 0 | ||||
| 2026-02-12 | 13F | Insigneo Advisory Services, Llc | 0 | -100,00 | 0 | |||||
| 2026-01-30 | 13F | Pekin Hardy Strauss, Inc. | 203.777 | -0,66 | 3.904 | -1,26 | ||||
| 2025-10-27 | 13F | Kiker Wealth Management, LLC | 0 | -100,00 | 0 | |||||
| 2026-01-27 | 13F | TD Waterhouse Canada Inc. | 2.450 | 0,00 | 47 | -2,13 | ||||
| 2026-02-13 | 13F | Stifel Financial Corp | 15.925 | -1,56 | 305 | -1,93 |