Grundlæggende statistik
| Institutionelle ejere | 134 total, 134 long only, 0 short only, 0 long/short - change of 2,29% MRQ |
| Gennemsnitlig porteføljeallokering | 0.2702 % - change of 2,26% MRQ |
| Institutionelle aktier (lange) | 3.371.422 (ex 13D/G) - change of -0,61MM shares -15,34% MRQ |
| Institutionel værdi (lang) | $ 339.447 USD ($1000) |
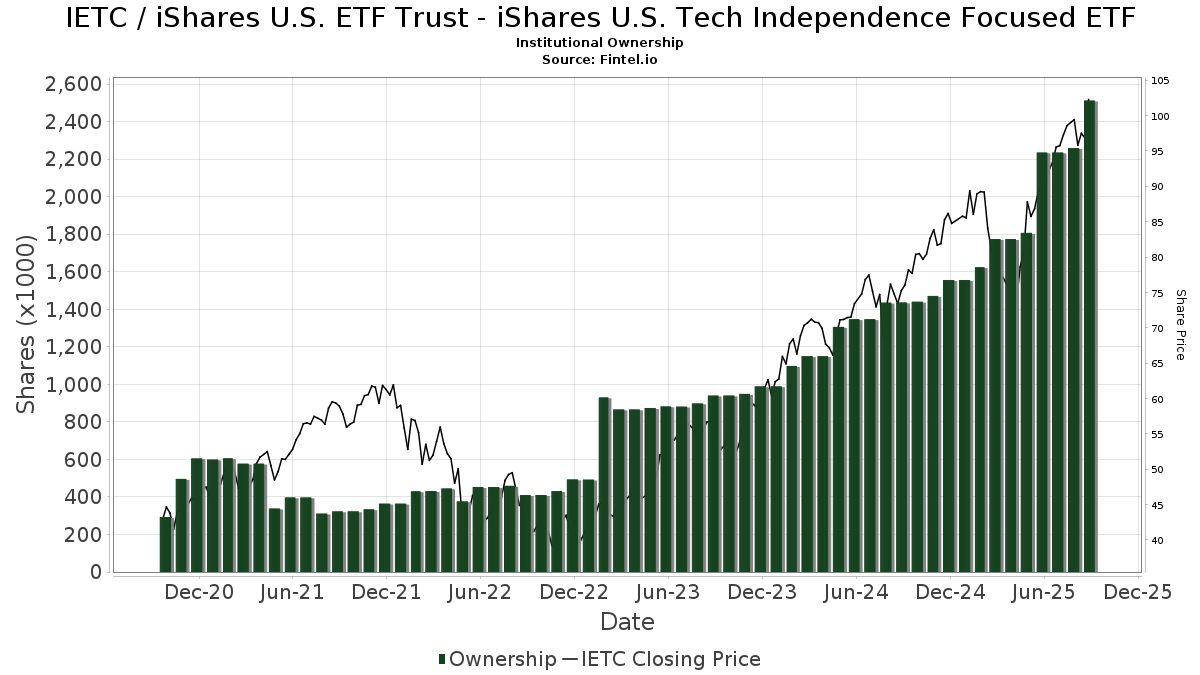
Institutionelt ejerskab og aktionærer
iShares U.S. ETF Trust - iShares U.S. Tech Independence Focused ETF (US:IETC) har 134 institutionelle ejere og aktionærer, der har indsendt 13D/G- eller 13F-formularer til Securities Exchange Commission (SEC). Disse institutioner har i alt 3,371,422 aktier. Største aktionærer omfatter Gradient Investments LLC, Kozak & Associates, Inc., LPL Financial LLC, Assetmark, Inc, United Capital Financial Advisers, Llc, Mml Investors Services, Llc, Apexium Financial, Lp, Jpmorgan Chase & Co, Northwestern Mutual Wealth Management Co, and BCJ Capital Management, LLC .
iShares U.S. ETF Trust - iShares U.S. Tech Independence Focused ETF (BATS:IETC) institutionel ejerskabsstruktur viser aktuelle positioner i virksomheden efter institutioner og fonde, samt seneste ændringer i positionsstørrelse. Større aktionærer kan omfatte individuelle investorer, investeringsforeninger, hedgefonde eller institutioner. Skema 13D angiver, at investoren besidder (eller besidder) mere end 5 % af virksomheden og har til hensigt (eller har til hensigt at) aktivt at forfølge en ændring i forretningsstrategi. Skema 13G indikerer en passiv investering på over 5%.
The share price as of March 26, 2026 is 87,96 / share. Previously, on March 27, 2025, the share price was 77,25 / share. This represents an increase of 13,86% over that period.
Fondens stemningsscore
Fund Sentiment Score (fka Ownership Accumulation Score) finder de aktier, der bliver mest købt af fonde. Det er resultatet af en sofistikeret, multi-faktor kvantitativ model, der identificerer virksomheder med de højeste niveauer af institutionel akkumulering. Scoringsmodellen bruger en kombination af den samlede stigning i oplyste ejere, ændringerne i porteføljeallokeringer i disse ejere og andre målinger. Tallet går fra 0 til 100, hvor højere tal indikerer et højere niveau af akkumulering for sine jævnaldrende, og 50 er gennemsnittet.
Opdateringsfrekvens: Dagligt
Se Ownership Explorer, som giver en liste over højest rangerende virksomheder.
AI+ Ask Fintel’s AI assistant about iShares U.S. ETF Trust - iShares U.S. Tech Independence Focused ETF.
Select a question to share a public post with an AI-crafted answer.
Thinking of good questions…
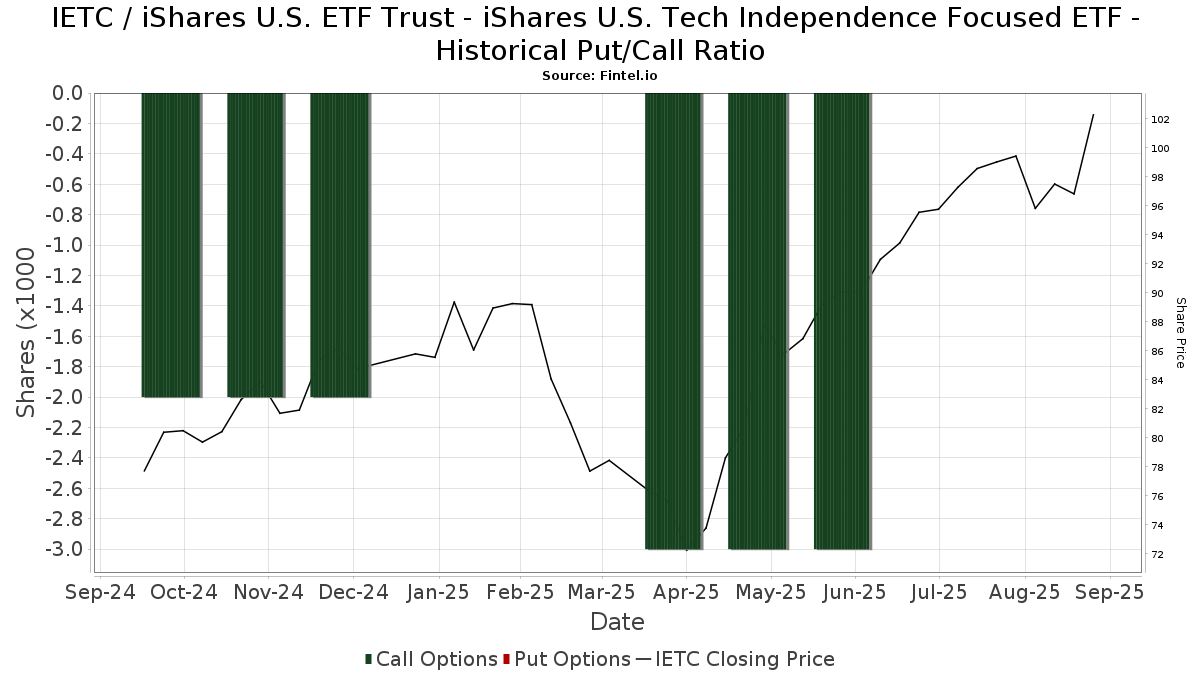
Institutionel Put/Call-forhold
Ud over at indberette standardaktie- og gældsudstedelser skal institutter med mere end 100 mill. aktiver under forvaltning også oplyse deres put- og call-optionsbeholdninger. Da salgsoptioner generelt indikerer negativ stemning, og købsoptioner indikerer positiv stemning, kan vi få en fornemmelse af den overordnede institutionelle stemning ved at plotte forholdet mellem put og kald. Diagrammet til højre viser det historiske put/call-forhold for dette instrument.
Brug af Put/Call Ratio som en indikator for investorernes stemning overvinder en af de vigtigste mangler ved at bruge totalt institutionelt ejerskab, som er, at en betydelig mængde af aktiver under forvaltning investeres passivt for at spore indekser. Passivt forvaltede fonde køber typisk ikke optioner, så indikatoren for put/call-forholdet følger mere nøje følelsen af aktivt forvaltede fonde.
13F og NPORT arkivering
Detaljer om 13F-arkivering er gratis. Detaljer om NP-ansøgninger kræver et premium-medlemskab. Grønne rækker angiver nye positioner. Røde rækker angiver lukkede positioner. Klik på linket ikon for at se den fulde transaktionshistorik.
Opgrader
for at låse premium-data op og eksportere til Excel ![]() .
.
| Fil dato | Kilde | Investor | Type | Gennemsnitlig pris (Øst) |
Aktier | Δ Aktier (%) |
Rapporteret Værdi ($1000) |
Δ Værdi (%) |
Port Alloc (%) |
|
|---|---|---|---|---|---|---|---|---|---|---|
| 2026-02-13 | 13F | Wells Fargo & Company/mn | 1 | 0,00 | 0 | |||||
| 2026-01-23 | 13F | Patriot Investment Management Inc. | 11.716 | -0,79 | 1.190 | -1,08 | ||||
| 2026-02-17 | 13F | Advisor Group Holdings, Inc. | 28.072 | -28,90 | 2.852 | -26,06 | ||||
| 2026-01-27 | 13F | BankPlus Trust Department | 71 | 0,00 | 7 | 0,00 | ||||
| 2026-02-03 | 13F | Financial Partners Group, Inc | 4.176 | -1,16 | 407 | -5,35 | ||||
| 2026-02-11 | 13F | Vise Technologies, Inc. | 2.276 | 231 | ||||||
| 2026-01-28 | 13F | Fischer Investment Strategies, Llc | 2.427 | -4,22 | 247 | -4,65 | ||||
| 2026-02-17 | 13F | Citadel Advisors Llc | 22.154 | 2.251 | ||||||
| 2026-02-13 | 13F | Kcm Investment Advisors Llc | 9.636 | 0,00 | 979 | -0,41 | ||||
| 2026-01-20 | 13F | Stratos Wealth Partners, LTD. | 3.665 | 39,94 | 372 | 39,33 | ||||
| 2026-01-26 | 13F | AE Wealth Management LLC | 10.596 | -22,95 | 1.076 | -23,20 | ||||
| 2026-01-14 | 13F | Hoese & Co LLP | 31.218 | 279,18 | 3.171 | 277,95 | ||||
| 2026-02-11 | 13F | Vestor Capital, Llc | 481 | -99,93 | 78 | 6,85 | ||||
| 2026-01-26 | 13F | Mirae Asset Global Investments Co., Ltd. | 0 | -100,00 | 0 | |||||
| 2026-02-17 | 13F | KM Capital Management Ltd. | 15.822 | 0,00 | 1.607 | -0,31 | ||||
| 2026-02-17 | 13F | Two Sigma Investments, Lp | 44.000 | -50,06 | 4.470 | -50,23 | ||||
| 2026-02-09 | 13F | CBIZ Investment Advisory Services, LLC | 72 | 0,00 | 7 | 0,00 | ||||
| 2026-02-06 | 13F | IFP Advisors, Inc | 839 | 137,01 | 85 | 136,11 | ||||
| 2026-01-20 | 13F | Sovran Advisors, LLC | 3.173 | -28,65 | 322 | -31,99 | ||||
| 2026-02-04 | 13F | BCJ Capital Management, LLC | 75.900 | 11,67 | 7.711 | 11,30 | ||||
| 2026-02-13 | 13F | Citigroup Inc | 0 | -100,00 | 0 | |||||
| 2026-02-06 | 13F | Cascade Financial Partners, LLC | 0 | -100,00 | 0 | -100,00 | ||||
| 2026-02-04 | 13F | Money Concepts Capital Corp | 2.360 | -20,00 | 240 | -20,33 | ||||
| 2026-02-05 | 13F | Cambridge Investment Research Advisors, Inc. | 28.442 | -6,34 | 3 | -33,33 | ||||
| 2026-02-10 | 13F/A | Northwestern Mutual Wealth Management Co | 81.511 | 20,07 | 8.281 | 19,67 | ||||
| 2026-02-10 | 13F | Envestnet Asset Management Inc | 21.773 | 9,18 | 2.212 | 8,81 | ||||
| 2026-02-17 | 13F | Citadel Advisors Llc | Call | 6.800 | -35,24 | 691 | -35,51 | |||
| 2026-02-17 | 13F | Equitable Holdings, Inc. | 10.389 | 9,04 | 1.055 | 8,65 | ||||
| 2025-10-27 | 13F | Belvedere Trading LLC | Put | 0 | -100,00 | 0 | -100,00 | |||
| 2025-11-14 | 13F | Larson Financial Group LLC | 0 | -100,00 | 0 | |||||
| 2026-01-23 | 13F | Beacon Harbor Wealth Advisors, Inc. | 0 | -100,00 | 0 | |||||
| 2026-01-15 | 13F | Saxony Capital Management, LLC | 2.483 | 0,00 | 252 | -0,40 | ||||
| 2026-01-28 | 13F | HB Wealth Management, LLC | 2.500 | 0,00 | 254 | -0,39 | ||||
| 2026-02-17 | 13F | Brown Financial Advisors | 28.379 | 0,82 | 2.883 | 0,49 | ||||
| 2026-02-11 | 13F | Mascagni Wealth Management, Inc. | 6.333 | -0,41 | 643 | -0,77 | ||||
| 2026-01-14 | 13F | Pallas Capital Advisors LLC | 2.538 | -14,40 | 258 | -14,90 | ||||
| 2026-02-05 | 13F | Cornerstone Wealth Management, LLC | 4.927 | 1,05 | 501 | 0,60 | ||||
| 2026-01-30 | 13F | Us Bancorp \de\ | 50 | 0,00 | 5 | 0,00 | ||||
| 2026-02-04 | 13F | Tsfg, Llc | 100 | 0,00 | 0 | |||||
| 2026-02-12 | 13F | Federation des caisses Desjardins du Quebec | 503 | -28,95 | 51 | -29,17 | ||||
| 2026-01-08 | 13F | Gradient Investments LLC | 673.735 | 7,87 | 68.445 | 7,51 | ||||
| 2026-02-13 | 13F | Parkside Financial Bank & Trust | 295 | 0,00 | 30 | -3,33 | ||||
| 2026-02-17 | 13F | Cetera Investment Advisers | 7.400 | 60,24 | 752 | 59,79 | ||||
| 2026-02-12 | 13F | Commonwealth Equity Services, Llc | 14.742 | -35,33 | 1.498 | 74.750,00 | ||||
| 2026-02-17 | 13F | Advisory Services Network, LLC | 0 | -100,00 | 0 | |||||
| 2026-02-19 | 13F | Mcguire Capital Advisors Inc | 49 | 5 | ||||||
| 2026-01-12 | 13F | Kozak & Associates, Inc. | 641.304 | -0,60 | 65.866 | 2,10 | ||||
| 2026-02-12 | 13F | Principal Securities, Inc. | 0 | -100,00 | 0 | -100,00 | ||||
| 2026-02-13 | 13F | Mariner, LLC | 2.067 | 210 | ||||||
| 2026-01-09 | 13F | Zrc Wealth Management, Llc | 1 | 0,00 | 0 | |||||
| 2026-02-17 | 13F | Captrust Financial Advisors | 0 | -100,00 | 0 | |||||
| 2026-02-17 | 13F | GeoWealth Management, LLC | 17.786 | -54,28 | 1.807 | -54,45 | ||||
| 2026-01-12 | 13F | Shira Ridge Wealth Management | 17.095 | -0,63 | 1.737 | -0,97 | ||||
| 2026-01-06 | 13F | Ehrlich Financial Group | 4.789 | 21,92 | 487 | 21,50 | ||||
| 2026-01-13 | 13F | Signal Advisors Wealth, LLC | 0 | -100,00 | 0 | |||||
| 2026-01-29 | 13F | RMR Wealth Builders | 0 | -100,00 | 0 | |||||
| 2026-02-12 | 13F | Hrt Financial Lp | 4.088 | 0 | ||||||
| 2026-02-13 | 13F | Kestra Advisory Services, LLC | 0 | -100,00 | 0 | |||||
| 2026-01-26 | 13F | Lansing Street Advisors | 12.208 | -0,12 | 1.240 | -0,40 | ||||
| 2026-02-17 | 13F | Jones Financial Companies Lllp | 12.155 | 73,77 | 1.235 | 74,05 | ||||
| 2026-01-29 | 13F | Advisors Capital Management, LLC | 15.932 | 6,58 | 1.619 | 6,24 | ||||
| 2026-02-13 | 13F | Financial Freedom, LLC | 882 | 0,00 | 90 | 0,00 | ||||
| 2026-02-09 | 13F | Darden Wealth Group Inc | 2.600 | 0,00 | 264 | -0,38 | ||||
| 2026-02-12 | 13F | Rossby Financial, LCC | 8 | 0,00 | 1 | |||||
| 2026-02-06 | 13F | Pnc Financial Services Group, Inc. | 82 | 0,00 | 8 | 0,00 | ||||
| 2026-02-10 | 13F | Belvedere Trading LLC | Call | 0 | -100,00 | 0 | ||||
| 2026-01-15 | 13F | Ironwood Financial, llc | 10.264 | -3,96 | 1.063 | -2,48 | ||||
| 2026-02-11 | 13F | Jpmorgan Chase & Co | 83.637 | -19,87 | 8.497 | -20,14 | ||||
| 2026-02-06 | 13F | Lloyd Advisory Services, LLC. | 44 | 4 | ||||||
| 2026-02-13 | 13F | Glen Eagle Advisors, LLC | 6.001 | 0,86 | 610 | 0,50 | ||||
| 2026-02-10 | 13F | Private Wealth Asset Management, LLC | 267 | 0,00 | 27 | 0,00 | ||||
| 2026-01-07 | 13F | Central Pacific Bank - Trust Division | 99 | 39,44 | 10 | 42,86 | ||||
| 2026-01-23 | 13F | Farther Finance Advisors, LLC | 398 | 0,00 | 40 | 0,00 | ||||
| 2026-02-13 | 13F | Stifel Financial Corp | 53.590 | 5,55 | 5.444 | 5,20 | ||||
| 2026-01-28 | 13F | Kingswood Wealth Advisors, Llc | 0 | -100,00 | 0 | |||||
| 2026-01-14 | 13F | Nova Wealth Management, Inc. | 3.234 | 1,60 | 329 | 1,23 | ||||
| 2026-01-28 | 13F | Financial Perspectives, Inc | 10.859 | 1,28 | 1.103 | 1,01 | ||||
| 2026-02-10 | 13F | Lido Advisors, LLC | 3.660 | 0,00 | 373 | 0,00 | ||||
| 2026-02-11 | 13F | Artesa Financial Group, LLC | 17.190 | 1.746 | ||||||
| 2026-02-13 | 13F | Haverford Trust Co | 3.115 | 0,00 | 316 | -0,32 | ||||
| 2026-01-15 | 13F | Paladin Wealth, LLC | 18.648 | 28,49 | 1.894 | 28,06 | ||||
| 2026-02-10 | 13F | WCG Wealth Advisors LLC | 11.105 | -1,31 | 1.128 | -1,57 | ||||
| 2026-02-13 | 13F | Morgan Stanley | 2.808 | -9,33 | 285 | -9,52 | ||||
| 2026-02-13 | 13F | TFB Advisors LLC | 4.153 | 5,22 | 422 | 4,99 | ||||
| 2026-01-13 | 13F | Parsons Capital Management Inc/ri | 3.363 | 2,28 | 342 | 1,79 | ||||
| 2026-02-12 | 13F | CIBC Private Wealth Group, LLC | 623 | 0,00 | 63 | 0,00 | ||||
| 2026-02-02 | 13F | Montag A & Associates Inc | 491 | -9,24 | 50 | -10,91 | ||||
| 2026-02-09 | 13F | Mmbg Investment Advisors Co. | 3.774 | 384 | ||||||
| 2025-11-14 | 13F | Wolverine Trading, Llc | Call | 6.500 | 661 | |||||
| 2026-01-26 | 13F | Cwm, Llc | 187 | 0,00 | 0 | |||||
| 2026-02-11 | 13F | Janney Montgomery Scott LLC | 3.514 | 2,90 | 0 | |||||
| 2026-01-29 | 13F | Sanctuary Advisors, LLC | 4.378 | -13,27 | 445 | -13,62 | ||||
| 2026-02-02 | 13F | Bay Harbor Wealth Management, LLC | 5.849 | 0,00 | 594 | -0,34 | ||||
| 2026-01-29 | 13F | Concord Wealth Partners | 100 | 10 | ||||||
| 2026-02-06 | 13F | GPS Wealth Strategies Group, LLC | 0 | -100,00 | 0 | |||||
| 2026-02-13 | 13F | Colony Group, LLC | 2.188 | 222 | ||||||
| 2026-01-30 | 13F | Activest Wealth Management | 742 | 75 | ||||||
| 2026-01-29 | 13F | Comerica Bank | 0 | -100,00 | 0 | |||||
| 2026-02-11 | 13F | Mattson Financial Services, LLC | 44.137 | 8,46 | 4.484 | 8,10 | ||||
| 2026-02-13 | 13F | National Bank Of Canada /fi/ | 20 | 100,00 | 2 | 100,00 | ||||
| 2026-02-02 | 13F | Truist Financial Corp | 47.376 | 103,23 | 4.813 | 102,53 | ||||
| 2026-01-14 | 13F | Worth Asset Management, LLC | 2.461 | -18,54 | 250 | -18,57 | ||||
| 2026-02-10 | 13F | Goldman Sachs Group Inc | 14.120 | 1.434 | ||||||
| 2026-02-13 | 13F | Mml Investors Services, Llc | 99.301 | -5,01 | 10.088 | -5,33 | ||||
| 2026-02-13 | 13F | Integrated Wealth Concepts LLC | 0 | -100,00 | 0 | |||||
| 2026-02-20 | 13F | Kovitz Investment Group Partners, LLC | 0 | -100,00 | 0 | |||||
| 2026-02-18 | 13F | GWM Advisors LLC | 600 | -92,45 | 61 | -92,59 | ||||
| 2026-02-05 | 13F | Allworth Financial LP | 1.404 | -12,25 | 143 | -12,88 | ||||
| 2026-02-09 | 13F | Harbour Investments, Inc. | 291 | 219,78 | 30 | 222,22 | ||||
| 2025-11-10 | 13F | Efficient Advisors, LLC | 0 | -100,00 | 0 | |||||
| 2026-01-14 | 13F | Spire Wealth Management | 20 | 0,00 | 2 | 0,00 | ||||
| 2026-02-17 | 13F | Regal Investment Advisors LLC | 4.276 | 0,07 | 434 | -0,23 | ||||
| 2026-02-17 | 13F | Tower Research Capital LLC (TRC) | 3.463 | -76,49 | 352 | -76,62 | ||||
| 2026-01-30 | 13F | Oakwell Private Wealth Management, LLC | 26.100 | 2.651 | ||||||
| 2026-02-17 | 13F | Hilltop Holdings Inc. | 3.199 | 13,04 | 325 | 12,50 | ||||
| 2026-02-17 | 13F | Signature Equity Partners, LLC | 35 | 4 | ||||||
| 2026-01-30 | 13F | Richardson Capital Management LLC | 1.126 | -2,76 | 114 | -3,39 | ||||
| 2026-02-10 | 13F | Root Financial Partners, LLC | 2.126 | 216 | ||||||
| 2026-02-13 | 13F | Icon Wealth Advisors, LLC | 4.725 | 0,13 | 480 | -0,21 | ||||
| 2026-02-11 | 13F | Capital Analysts, Inc. | 355 | 0 | ||||||
| 2026-02-03 | 13F | International Assets Investment Management, Llc | 1.000 | 102 | ||||||
| 2026-02-11 | 13F | J.w. Cole Advisors, Inc. | 2.686 | 0,04 | 273 | -0,37 | ||||
| 2026-01-29 | 13F | UBS Group AG | 900 | -18,18 | 91 | -18,75 | ||||
| 2026-02-05 | 13F | Western Wealth Management, LLC | 2.182 | 1,02 | 222 | 0,45 | ||||
| 2026-02-06 | 13F | Kingdom Financial Group LLC. | 1.212 | 123 | ||||||
| 2026-01-08 | 13F | Wealth Enhancement Advisory Services, Llc | 3.217 | 6,03 | 331 | 6,11 | ||||
| 2026-02-11 | 13F | Comprehensive Financial Planning, Inc./PA | 4.965 | 0,12 | 504 | -0,20 | ||||
| 2026-02-17 | 13F | Wiley Bros.-aintree Capital, Llc | 12.831 | -5,61 | 1.303 | -5,92 | ||||
| 2026-02-12 | 13F | BlackRock, Inc. | 62 | 0,00 | 6 | 0,00 | ||||
| 2026-03-12 | 13F | Bawa N Mallick Trust | 5.000 | 0,00 | 508 | -0,39 | ||||
| 2026-01-30 | 13F | Keybank National Association/oh | 27.304 | 0,00 | 2.774 | -0,36 | ||||
| 2026-02-17 | 13F | Raymond James Financial Inc | 74.504 | -6,66 | 7.569 | -6,98 | ||||
| 2026-02-17 | 13F | Royal Bank Of Canada | 22.161 | 213,50 | 2.252 | 212,34 | ||||
| 2026-02-17 | 13F | Ibex Wealth Advisors | 0 | -100,00 | 0 | |||||
| 2026-02-11 | 13F | Cerity Partners LLC | 2.259 | -45,43 | 229 | -45,61 | ||||
| 2026-02-13 | 13F | A4 Wealth Advisors LLC | 5.005 | -32,47 | 508 | -32,72 | ||||
| 2026-02-13 | 13F | Safe Harbor Wealth Advisors, LLC | 4.952 | 449 | ||||||
| 2026-02-04 | 13F | Ameritas Advisory Services, LLC | 7.680 | -21,75 | 780 | -22,00 | ||||
| 2026-02-13 | 13F | MAI Capital Management | 58 | 6 | ||||||
| 2026-02-03 | 13F | McIlrath & Eck, LLC | 146 | 0,00 | 15 | 0,00 | ||||
| 2025-11-14 | 13F | Old Mission Capital Llc | 0 | -100,00 | 0 | -100,00 | ||||
| 2026-01-23 | 13F | Assetmark, Inc | 209.468 | 928,11 | 21.280 | 925,00 | ||||
| 2026-02-12 | 13F | Steward Partners Investment Advisory, Llc | 4.398 | 1,78 | 447 | 1,36 | ||||
| 2026-02-11 | 13F | Simplex Trading, Llc | 0 | -100,00 | 0 | |||||
| 2025-11-18 | 13F | Apexium Financial, Lp | 89.167 | 33,22 | 9.089 | 44,46 | ||||
| 2025-11-05 | 13F | Moloney Securities Asset Management, LLC | 7.735 | 0,00 | 788 | 8,39 | ||||
| 2026-02-17 | 13F | Susquehanna International Group, Llp | 10.618 | -37,36 | 1.079 | -37,58 | ||||
| 2026-01-26 | 13F | Brendel Financial Advisors LLC | 0 | -100,00 | 0 | -100,00 | ||||
| 2026-02-06 | 13F | Global Retirement Partners, LLC | 17.326 | 11,09 | 1.760 | 10,76 | ||||
| 2026-02-11 | 13F | LPL Financial LLC | 294.702 | 16,56 | 29.939 | 16,17 | ||||
| 2026-02-17 | 13F | Blair William & Co/il | 3.987 | 405 | ||||||
| 2026-02-17 | 13F | United Capital Financial Advisers, Llc | 103.414 | 10.506 | ||||||
| 2026-02-10 | 13F | Kesler, Norman & Wride, LLC | 4.973 | 505 | ||||||
| 2026-02-17 | 13F | Creative Planning | 5.564 | 1,83 | 565 | 1,62 | ||||
| 2026-01-21 | 13F | Sutton Place Investors Llc | 27.843 | 1,18 | 2.829 | 0,86 | ||||
| 2026-02-10 | 13F | Belvedere Trading LLC | 0 | -100,00 | 0 | |||||
| 2026-01-30 | 13F | Sigma Planning Corp | 12.351 | 2,13 | 1.255 | 1,79 | ||||
| 2026-01-21 | 13F | Sound Income Strategies, LLC | 442 | 48,82 | 45 | 46,67 | ||||
| 2026-02-12 | 13F | Jane Street Group, Llc | 6.093 | -75,22 | 619 | -75,34 | ||||
| 2026-02-05 | 13F | Bessemer Group Inc | 0 | -100,00 | 0 |