Grundlæggende statistik
| Institutionelle ejere | 76 total, 76 long only, 0 short only, 0 long/short - change of 13,43% MRQ |
| Gennemsnitlig porteføljeallokering | 0.5857 % - change of 4,73% MRQ |
| Institutionelle aktier (lange) | 9.441.605 (ex 13D/G) - change of 2,05MM shares 27,68% MRQ |
| Institutionel værdi (lang) | $ 222.094 USD ($1000) |
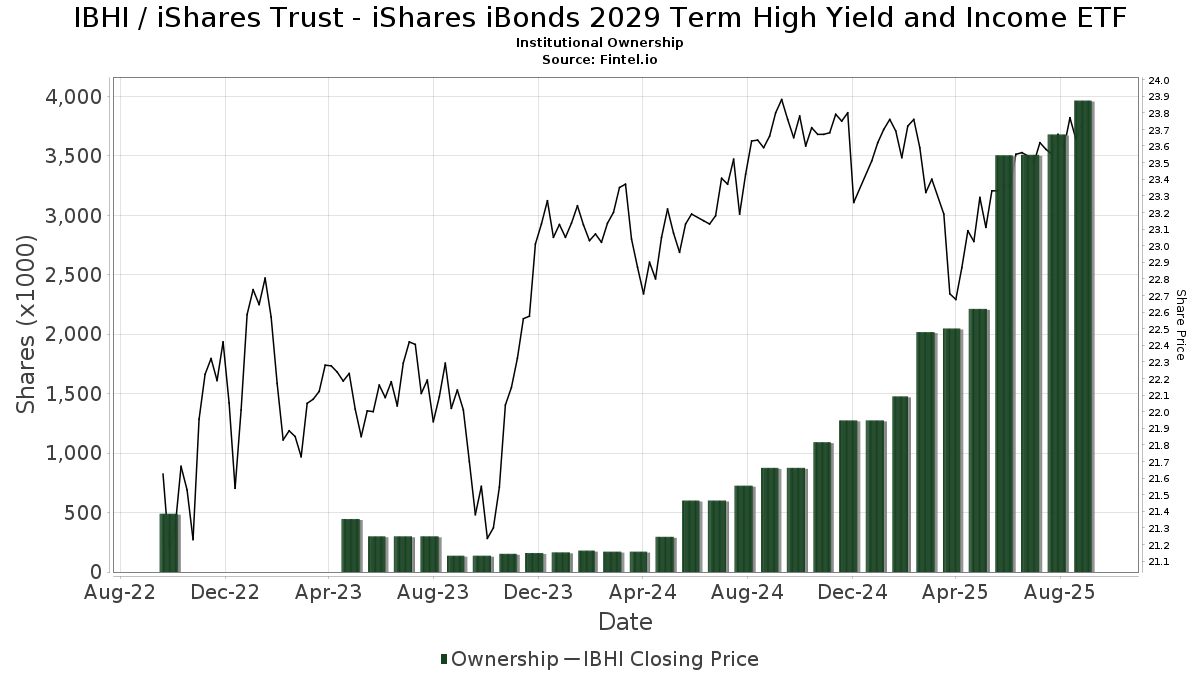
Institutionelt ejerskab og aktionærer
iShares Trust - iShares iBonds 2029 Term High Yield and Income ETF (US:IBHI) har 76 institutionelle ejere og aktionærer, der har indsendt 13D/G- eller 13F-formularer til Securities Exchange Commission (SEC). Disse institutioner har i alt 9,441,605 aktier. Største aktionærer omfatter Lbmc Investment Advisors, Llc, Morgan Stanley, Northwestern Mutual Wealth Management Co, GWM Advisors LLC, Commonwealth Equity Services, Llc, Baltimore-Washington Financial Advisors, Inc., Bank Of America Corp /de/, Keeler THomas Management LLC, Commonwealth Financial Services, LLC, and LPL Financial LLC .
iShares Trust - iShares iBonds 2029 Term High Yield and Income ETF (BATS:IBHI) institutionel ejerskabsstruktur viser aktuelle positioner i virksomheden efter institutioner og fonde, samt seneste ændringer i positionsstørrelse. Større aktionærer kan omfatte individuelle investorer, investeringsforeninger, hedgefonde eller institutioner. Skema 13D angiver, at investoren besidder (eller besidder) mere end 5 % af virksomheden og har til hensigt (eller har til hensigt at) aktivt at forfølge en ændring i forretningsstrategi. Skema 13G indikerer en passiv investering på over 5%.
The share price as of March 4, 2026 is 23,45 / share. Previously, on March 5, 2025, the share price was 23,59 / share. This represents a decline of 0,59% over that period.
Fondens stemningsscore
Fund Sentiment Score (fka Ownership Accumulation Score) finder de aktier, der bliver mest købt af fonde. Det er resultatet af en sofistikeret, multi-faktor kvantitativ model, der identificerer virksomheder med de højeste niveauer af institutionel akkumulering. Scoringsmodellen bruger en kombination af den samlede stigning i oplyste ejere, ændringerne i porteføljeallokeringer i disse ejere og andre målinger. Tallet går fra 0 til 100, hvor højere tal indikerer et højere niveau af akkumulering for sine jævnaldrende, og 50 er gennemsnittet.
Opdateringsfrekvens: Dagligt
Se Ownership Explorer, som giver en liste over højest rangerende virksomheder.
AI+ Ask Fintel’s AI assistant about iShares Trust - iShares iBonds 2029 Term High Yield and Income ETF.
Select a question to share a public post with an AI-crafted answer.
Thinking of good questions…
Institutionel Put/Call-forhold
Ud over at indberette standardaktie- og gældsudstedelser skal institutter med mere end 100 mill. aktiver under forvaltning også oplyse deres put- og call-optionsbeholdninger. Da salgsoptioner generelt indikerer negativ stemning, og købsoptioner indikerer positiv stemning, kan vi få en fornemmelse af den overordnede institutionelle stemning ved at plotte forholdet mellem put og kald. Diagrammet til højre viser det historiske put/call-forhold for dette instrument.
Brug af Put/Call Ratio som en indikator for investorernes stemning overvinder en af de vigtigste mangler ved at bruge totalt institutionelt ejerskab, som er, at en betydelig mængde af aktiver under forvaltning investeres passivt for at spore indekser. Passivt forvaltede fonde køber typisk ikke optioner, så indikatoren for put/call-forholdet følger mere nøje følelsen af aktivt forvaltede fonde.
13F og NPORT arkivering
Detaljer om 13F-arkivering er gratis. Detaljer om NP-ansøgninger kræver et premium-medlemskab. Grønne rækker angiver nye positioner. Røde rækker angiver lukkede positioner. Klik på linket ikon for at se den fulde transaktionshistorik.
Opgrader
for at låse premium-data op og eksportere til Excel ![]() .
.
| Fil dato | Kilde | Investor | Type | Gennemsnitlig pris (Øst) |
Aktier | Δ Aktier (%) |
Rapporteret Værdi ($1000) |
Δ Værdi (%) |
Port Alloc (%) |
|
|---|---|---|---|---|---|---|---|---|---|---|
| 2026-01-28 | 13F | Hobbs Group Advisors, LLC | 16.202 | 383 | ||||||
| 2026-01-05 | 13F | Helen Stephens Group, LLC | 17.353 | 38,91 | 410 | 38,05 | ||||
| 2026-01-29 | 13F | Scissortail Wealth Management, LLC | 59.589 | 8,21 | 1.408 | 7,24 | ||||
| 2026-02-05 | 13F | Cambridge Investment Research Advisors, Inc. | 47.529 | -17,94 | 1 | 0,00 | ||||
| 2026-02-12 | 13F | BlackRock, Inc. | 50.666 | 50,00 | 1.197 | 48,70 | ||||
| 2026-02-11 | 13F | Bradley & Co. Private Wealth Management, LLC | 144.942 | -0,30 | 3.425 | -1,24 | ||||
| 2026-01-29 | 13F | UBS Group AG | 79.951 | 280,07 | 1.889 | 277,05 | ||||
| 2026-02-06 | 13F | Wrapmanager Inc | 34.998 | -17,69 | 827 | -18,44 | ||||
| 2026-02-12 | 13F | Lbmc Investment Advisors, Llc | 1.351.581 | 43,19 | 31.938 | 41,87 | ||||
| 2026-02-05 | 13F | Thrivent Financial For Lutherans | 13.923 | 0 | ||||||
| 2025-11-06 | 13F | Costello Asset Management, INC | 0 | -100,00 | 0 | |||||
| 2026-02-17 | 13F | Raymond James Financial Inc | 91.800 | 23,58 | 2.169 | 22,47 | ||||
| 2026-02-10 | 13F/A | Northwestern Mutual Wealth Management Co | 1.070.938 | 30,18 | 25.306 | 28,98 | ||||
| 2026-02-12 | 13F | Keeler THomas Management LLC | 399.476 | 0,33 | 9.440 | -0,60 | ||||
| 2026-02-11 | 13F | CNB Bank | 3.566 | 84 | ||||||
| 2026-02-12 | 13F | Jane Street Group, Llc | 0 | -100,00 | 0 | |||||
| 2026-02-06 | 13F | IFP Advisors, Inc | 20.519 | -50,21 | 485 | -50,71 | ||||
| 2026-02-17 | 13F | Snowden Capital Advisors LLC | 9.509 | 0,00 | 225 | -0,88 | ||||
| 2026-02-17 | 13F | Mercer Global Advisors Inc /adv | 26.698 | 14,23 | 631 | 13,11 | ||||
| 2026-01-23 | 13F | Freestone Capital Holdings, LLC | 20.519 | 7,16 | 485 | 6,14 | ||||
| 2026-02-10 | 13F | Cherry Tree Wealth Management, LLC | 2.018 | 0,00 | 48 | -2,08 | ||||
| 2026-02-12 | 13F | Principal Securities, Inc. | 0 | -100,00 | 0 | |||||
| 2026-01-16 | 13F | Ronald Blue Trust, Inc. | 826 | 2,23 | 20 | 0,00 | ||||
| 2026-01-28 | 13F | Delta Wealth Advisors LLC | 158.152 | 3.737 | ||||||
| 2026-02-10 | 13F | Hazlett, Burt & Watson, Inc. | 756 | 2,30 | 0 | |||||
| 2026-02-06 | 13F | Global Retirement Partners, LLC | 9.257 | 0,50 | 219 | -0,46 | ||||
| 2026-01-08 | 13F | Occidental Asset Management, LLC | 13.321 | 19,25 | 315 | 18,05 | ||||
| 2026-02-13 | 13F | Baltimore-Washington Financial Advisors, Inc. | 502.656 | 129,86 | 11.878 | 127,75 | ||||
| 2026-02-13 | 13F | Integrated Wealth Concepts LLC | 87.297 | 17,43 | 2.063 | 16,30 | ||||
| 2026-01-16 | 13F | Cyr Financial Inc. | 36.883 | -4,71 | 872 | -5,63 | ||||
| 2026-02-11 | 13F | Ameraudi Asset Management, Inc. | 9.609 | 227 | ||||||
| 2026-01-27 | 13F | Penobscot Investment Management Company, Inc. | 13.450 | 318 | ||||||
| 2026-02-13 | 13F | Alaska Permanent Capital Management | 6.768 | 2,20 | 159 | 1,27 | ||||
| 2026-01-16 | 13F | BridgePort Financial Solutions, LLC | 16.441 | -0,78 | 389 | -1,77 | ||||
| 2026-02-05 | 13F | Littlejohn Financial Services, Inc. | 245.559 | 4,54 | 5.803 | 3,59 | ||||
| 2026-01-15 | 13F | Ironwood Financial, llc | 88.628 | 59,12 | 2.103 | 58,36 | ||||
| 2026-02-10 | 13F | Lido Advisors, LLC | 74.894 | 0,00 | 1.786 | -0,06 | ||||
| 2026-01-14 | 13F | Spire Wealth Management | 12.548 | 297 | ||||||
| 2026-01-23 | 13F | Farther Finance Advisors, LLC | 699 | 0,00 | 17 | 0,00 | ||||
| 2026-02-12 | 13F | Hm Payson & Co | 446 | 0,00 | 11 | 0,00 | ||||
| 2026-01-30 | 13F | Sigma Planning Corp | 56.822 | 28,22 | 1.343 | 27,08 | ||||
| 2026-02-17 | 13F | River's Edge Wealth Management, Llc | 15.637 | 369 | ||||||
| 2026-02-13 | 13F | Focused Alpha, Llc | 37.475 | 886 | ||||||
| 2026-02-02 | 13F | Mutual Advisors, LLC | 19.047 | 0,00 | 450 | -0,22 | ||||
| 2026-01-20 | 13F | Austin Private Wealth, LLC | 10.326 | -1,73 | 244 | -2,40 | ||||
| 2026-01-08 | 13F | Threadgill Financial, Llc | 9.030 | 705 | ||||||
| 2026-01-26 | 13F | Cwm, Llc | 902 | -27,02 | 0 | |||||
| 2026-02-02 | 13F | Ellis Investment Partners, LLC | 9.400 | 222 | ||||||
| 2026-01-22 | 13F | Legacy Trust | 11.339 | 0,00 | 268 | -1,11 | ||||
| 2026-02-05 | 13F | High Note Wealth, LLC | 2.735 | 65 | ||||||
| 2026-02-17 | 13F | Royal Bank Of Canada | 37.322 | 16,66 | 882 | 15,60 | ||||
| 2026-01-20 | 13F | Stratos Wealth Partners, LTD. | 189.233 | 3,50 | 4.472 | 2,55 | ||||
| 2026-02-03 | 13F | McIlrath & Eck, LLC | 8.599 | 203 | ||||||
| 2026-01-16 | 13F | M3 Advisory Group, LLC | 8.558 | 0,00 | 202 | -0,98 | ||||
| 2025-11-07 | 13F | Marble Harbor Investment Counsel, LLC | 0 | -100,00 | 0 | |||||
| 2026-02-12 | 13F | Insigneo Advisory Services, Llc | 29.247 | 0,00 | 691 | -0,86 | ||||
| 2026-01-28 | 13F | Barrett & Company, Inc. | 1.944 | 0,00 | 46 | -2,17 | ||||
| 2026-01-05 | 13F | GAMMA Investing LLC | 2.753 | 0,99 | 65 | 0,00 | ||||
| 2026-02-09 | 13F | Hartland & Co., LLC | 0 | -100,00 | 0 | |||||
| 2026-02-10 | 13F | Envestnet Asset Management Inc | 28.939 | 684 | ||||||
| 2026-02-11 | 13F | LPL Financial LLC | 273.126 | 28,06 | 6.454 | 26,88 | ||||
| 2026-02-06 | 13F | Commonwealth Financial Services, LLC | 328.813 | 4,70 | 7.770 | 3,72 | ||||
| 2026-02-09 | 13F | Harbour Investments, Inc. | 67 | -87,62 | 2 | -91,67 | ||||
| 2026-02-17 | 13F | Cetera Investment Advisers | 35.819 | 15,87 | 846 | 14,79 | ||||
| 2025-11-03 | 13F | Summit Investment Advisory Services, LLC | 0 | -100,00 | 0 | |||||
| 2026-02-13 | 13F | Tableaux Llc | 0 | -100,00 | 0 | |||||
| 2026-02-17 | 13F | Bank Of America Corp /de/ | 436.090 | 31,62 | 10.305 | 30,40 | ||||
| 2026-02-18 | 13F | Beacon Pointe Advisors, LLC | 48.616 | 17,99 | 1.149 | 16,90 | ||||
| 2026-01-30 | 13F | Bogart Wealth, LLC | 634 | 15 | ||||||
| 2026-02-13 | 13F | 10Elms LLP | 551 | 0,00 | 13 | 0,00 | ||||
| 2026-02-03 | 13F | Orion Capital Management LLC | 5.000 | 0,00 | 118 | -0,84 | ||||
| 2026-01-29 | 13F | Kestra Private Wealth Services, Llc | 24.005 | 11,65 | 567 | 10,74 | ||||
| 2026-02-12 | 13F | Commonwealth Equity Services, Llc | 577.204 | 87,95 | 13.639 | 194.742,86 | ||||
| 2025-09-24 | NP | LDRH - iShares iBonds 1-5 Year High Yield and Income Ladder ETF | 33.778 | -0,63 | 797 | 1,66 | ||||
| 2026-02-02 | 13F | Headinvest, Llc | 26.978 | 0,00 | 637 | -0,93 | ||||
| 2026-02-12 | 13F | Reliant Wealth Planning | 8.431 | 0,00 | 199 | -1,00 | ||||
| 2026-02-17 | 13F | Advisor Group Holdings, Inc. | 4.049 | 45,65 | 96 | 43,94 | ||||
| 2026-02-17 | 13F | Advisory Services Network, LLC | 0 | -100,00 | 0 | |||||
| 2026-02-11 | 13F | Straight Path Wealth Management | 109.998 | 42,17 | 2.599 | 40,87 | ||||
| 2026-02-13 | 13F | Wells Fargo & Company/mn | 90.674 | 44,30 | 2.143 | 42,99 | ||||
| 2026-02-17 | 13F | Captrust Financial Advisors | 16.229 | 30,05 | 383 | 28,96 | ||||
| 2026-02-18 | 13F | GWM Advisors LLC | 883.775 | 18,08 | 20.884 | 16,99 | ||||
| 2026-02-17 | 13F | Warren Averett Asset Management, LLC | 12.281 | 1,63 | 290 | 0,69 | ||||
| 2026-02-13 | 13F | Morgan Stanley | 1.306.212 | 4,82 | 30.866 | 3,85 |