Grundlæggende statistik
| Institutionelle ejere | 103 total, 103 long only, 0 short only, 0 long/short - change of -6,31% MRQ |
| Gennemsnitlig porteføljeallokering | 0.1578 % - change of -28,23% MRQ |
| Institutionelle aktier (lange) | 2.016.052 (ex 13D/G) - change of -0,07MM shares -3,33% MRQ |
| Institutionel værdi (lang) | $ 168.644 USD ($1000) |
Institutionelt ejerskab og aktionærer
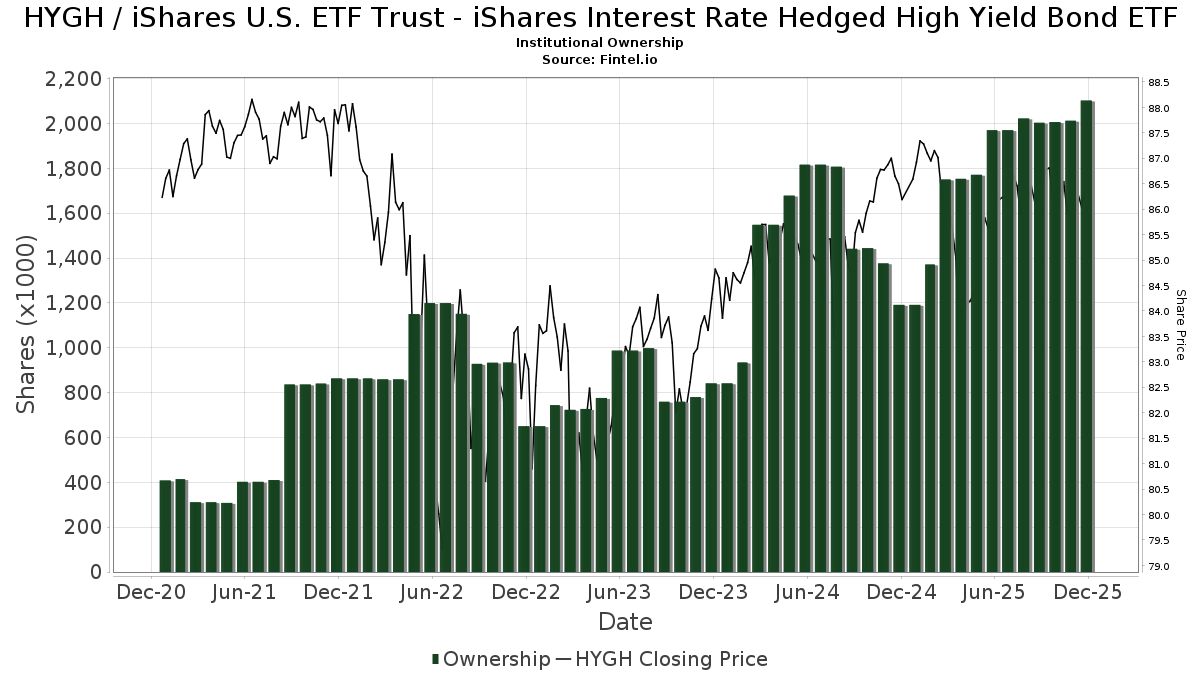
iShares U.S. ETF Trust - iShares Interest Rate Hedged High Yield Bond ETF (US:HYGH) har 103 institutionelle ejere og aktionærer, der har indsendt 13D/G- eller 13F-formularer til Securities Exchange Commission (SEC). Disse institutioner har i alt 2,016,052 aktier. Største aktionærer omfatter LPL Financial LLC, Minichmacgregor Wealth Management, Llc, Matauro, Llc, Rooted Wealth Advisors, Inc., Raymond James Financial Inc, AdvisorNet Financial, Inc, Sound Income Strategies, LLC, Foundations Investment Advisors, LLC, Capital Asset Advisory Services LLC, and Axxcess Wealth Management, Llc .
iShares U.S. ETF Trust - iShares Interest Rate Hedged High Yield Bond ETF (ARCA:HYGH) institutionel ejerskabsstruktur viser aktuelle positioner i virksomheden efter institutioner og fonde, samt seneste ændringer i positionsstørrelse. Større aktionærer kan omfatte individuelle investorer, investeringsforeninger, hedgefonde eller institutioner. Skema 13D angiver, at investoren besidder (eller besidder) mere end 5 % af virksomheden og har til hensigt (eller har til hensigt at) aktivt at forfølge en ændring i forretningsstrategi. Skema 13G indikerer en passiv investering på over 5%.
The share price as of April 10, 2026 is 85,86 / share. Previously, on April 11, 2025, the share price was 82,90 / share. This represents an increase of 3,57% over that period.
Fondens stemningsscore
Fund Sentiment Score (fka Ownership Accumulation Score) finder de aktier, der bliver mest købt af fonde. Det er resultatet af en sofistikeret, multi-faktor kvantitativ model, der identificerer virksomheder med de højeste niveauer af institutionel akkumulering. Scoringsmodellen bruger en kombination af den samlede stigning i oplyste ejere, ændringerne i porteføljeallokeringer i disse ejere og andre målinger. Tallet går fra 0 til 100, hvor højere tal indikerer et højere niveau af akkumulering for sine jævnaldrende, og 50 er gennemsnittet.
Opdateringsfrekvens: Dagligt
Se Ownership Explorer, som giver en liste over højest rangerende virksomheder.
AI+ Ask Fintel’s AI assistant about iShares U.S. ETF Trust - iShares Interest Rate Hedged High Yield Bond ETF.
Select a question to share a public post with an AI-crafted answer.
Thinking of good questions…
Institutionel Put/Call-forhold
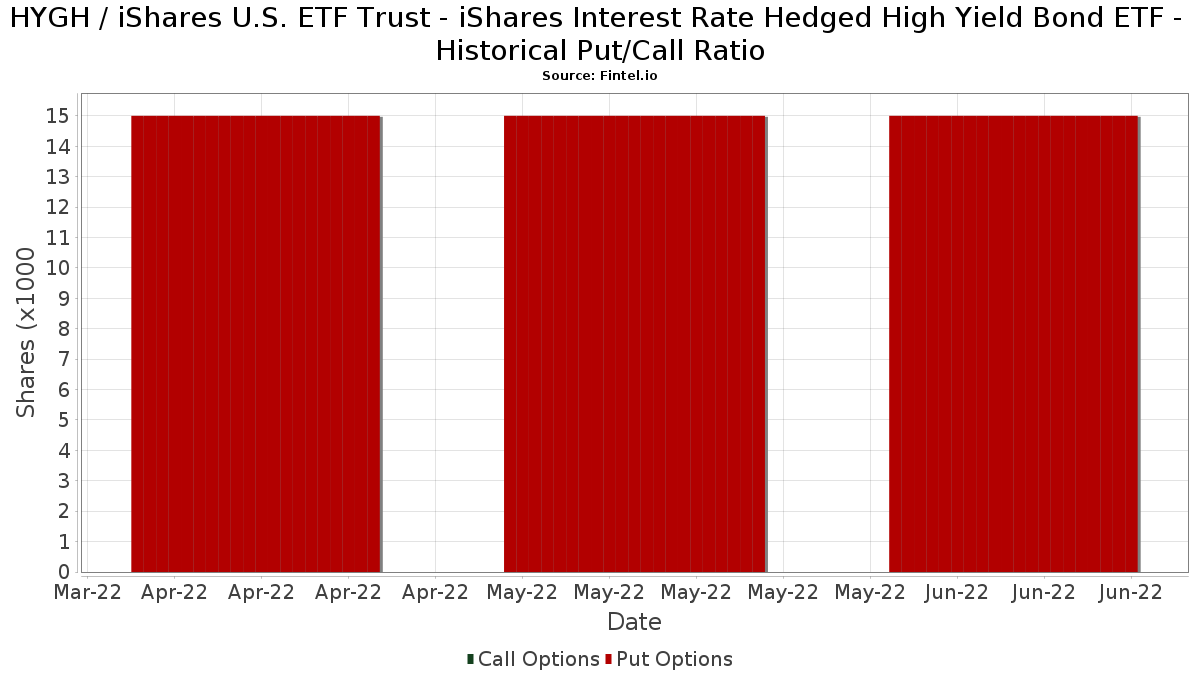
Ud over at indberette standardaktie- og gældsudstedelser skal institutter med mere end 100 mill. aktiver under forvaltning også oplyse deres put- og call-optionsbeholdninger. Da salgsoptioner generelt indikerer negativ stemning, og købsoptioner indikerer positiv stemning, kan vi få en fornemmelse af den overordnede institutionelle stemning ved at plotte forholdet mellem put og kald. Diagrammet til højre viser det historiske put/call-forhold for dette instrument.
Brug af Put/Call Ratio som en indikator for investorernes stemning overvinder en af de vigtigste mangler ved at bruge totalt institutionelt ejerskab, som er, at en betydelig mængde af aktiver under forvaltning investeres passivt for at spore indekser. Passivt forvaltede fonde køber typisk ikke optioner, så indikatoren for put/call-forholdet følger mere nøje følelsen af aktivt forvaltede fonde.
13F og NPORT arkivering
Detaljer om 13F-arkivering er gratis. Detaljer om NP-ansøgninger kræver et premium-medlemskab. Grønne rækker angiver nye positioner. Røde rækker angiver lukkede positioner. Klik på linket ikon for at se den fulde transaktionshistorik.
Opgrader
for at låse premium-data op og eksportere til Excel ![]() .
.
| Fil dato | Kilde | Investor | Type | Gennemsnitlig pris (Øst) |
Aktier | Δ Aktier (%) |
Rapporteret Værdi ($1000) |
Δ Værdi (%) |
Port Alloc (%) |
|
|---|---|---|---|---|---|---|---|---|---|---|
| 2026-02-17 | 13F | Advisor Group Holdings, Inc. | 48.421 | 31,00 | 4.176 | 30,50 | ||||
| 2026-01-09 | 13F | Capital Asset Advisory Services LLC | 68.865 | -3,22 | 5.960 | -3,54 | ||||
| 2026-01-14 | 13F | Net Worth Advisory Group | 2.726 | 235 | ||||||
| 2026-01-13 | 13F | Synergy Financial Management, LLC | 3.364 | 21,14 | 290 | 19,92 | ||||
| 2026-02-13 | 13F | Wells Fargo & Company/mn | 150 | -88,39 | 13 | -89,29 | ||||
| 2025-11-14 | 13F | Great Valley Advisor Group, Inc. | 0 | -100,00 | 0 | -100,00 | ||||
| 2026-02-17 | 13F | Minichmacgregor Wealth Management, Llc | 130.748 | 7,06 | 11.271 | 6,27 | ||||
| 2026-02-05 | 13F | Mason & Associates Inc | 32.559 | 2.807 | ||||||
| 2026-02-17 | 13F | Ameriflex Group, Inc. | 100 | -50,00 | 9 | -52,94 | ||||
| 2026-02-12 | 13F | Principal Securities, Inc. | 3.320 | 15,72 | 286 | 14,86 | ||||
| 2026-01-26 | 13F | Nations Financial Group Inc, /ia/ /adv | 24.054 | 66,84 | 2.074 | 65,58 | ||||
| 2026-01-26 | 13F | AE Wealth Management LLC | 166 | 336,84 | 14 | 366,67 | ||||
| 2026-01-16 | 13F | Matauro, Llc | 111.393 | -8,19 | 9.602 | -8,86 | ||||
| 2026-02-13 | 13F | Morgan Stanley | 1.502 | 15,72 | 129 | 15,18 | ||||
| 2026-01-27 | 13F | PFG Advisors | 12.566 | -5,50 | 1.083 | -6,15 | ||||
| 2026-02-06 | 13F | IFP Advisors, Inc | 9.228 | -0,92 | 795 | -1,61 | ||||
| 2026-04-06 | 13F | Highline Wealth Partners Llc | 305 | 0,00 | 26 | 0,00 | ||||
| 2025-11-07 | 13F | Jpmorgan Chase & Co | 0 | -100,00 | 0 | |||||
| 2026-02-10 | 13F/A | Northwestern Mutual Wealth Management Co | 11.877 | 16,17 | 1.024 | 15,33 | ||||
| 2026-02-02 | 13F | Truist Financial Corp | 0 | -100,00 | 0 | |||||
| 2026-02-05 | 13F | Cambridge Investment Research Advisors, Inc. | 33.460 | -8,33 | 3 | -33,33 | ||||
| 2026-02-17 | 13F | Citadel Advisors Llc | 7.014 | -47,29 | 605 | -47,71 | ||||
| 2026-02-23 | 13F | Blue Capital, Inc. | 20.814 | 0,52 | 1.794 | -0,22 | ||||
| 2025-11-14 | 13F | Strategic Wealth Partners, Ltd. | 19 | 2 | ||||||
| 2026-02-17 | 13F | Equitable Holdings, Inc. | 10.644 | 6,94 | 918 | 6,13 | ||||
| 2026-02-17 | 13F | Susquehanna International Group, Llp | 0 | -100,00 | 0 | |||||
| 2026-02-17 | 13F | Royal Bank Of Canada | 6.907 | -48,73 | 595 | -49,15 | ||||
| 2025-11-14 | 13F | Flow Traders U.s. Llc | 0 | -100,00 | 0 | |||||
| 2026-02-10 | 13F | Envestnet Asset Management Inc | 60.109 | -0,67 | 5.181 | -1,39 | ||||
| 2026-01-29 | 13F | Live Oak Investment Partners | 39.820 | 3.433 | ||||||
| 2025-11-04 | 13F | Guerra Advisors Inc | 105 | 9 | ||||||
| 2026-02-12 | 13F | Chilton Capital Management Llc | 0 | -100,00 | 0 | |||||
| 2026-01-30 | 13F | Us Bancorp \de\ | 1.129 | 0,36 | 97 | 0,00 | ||||
| 2026-02-13 | 13F | Centaurus Financial, Inc. | 4.273 | -20,77 | 0 | |||||
| 2026-01-20 | 13F | Princeton Global Asset Management LLC | 225 | 0,00 | 19 | 0,00 | ||||
| 2026-02-12 | 13F | Federation des caisses Desjardins du Quebec | 130 | 0,00 | 11 | 0,00 | ||||
| 2026-02-12 | 13F | Commonwealth Equity Services, Llc | 7.861 | -5,32 | 678 | |||||
| 2026-02-20 | 13F | Sunbelt Securities, Inc. | 0 | -100,00 | 0 | |||||
| 2026-01-21 | 13F | Sound Income Strategies, LLC | 69.603 | -2,47 | 6.047 | -1,50 | ||||
| 2026-02-19 | 13F | Van Diest Capital, LLC | 2.430 | 210 | ||||||
| 2026-04-01 | 13F | Bangor Savings Bank | 199 | 0,00 | 17 | 0,00 | ||||
| 2026-01-23 | 13F | HBW Advisory Services LLC | 9.534 | 17,56 | 822 | 16,62 | ||||
| 2026-02-11 | 13F | Buckingham Strategic Partners | 11.777 | -20,76 | 1.015 | -20,77 | ||||
| 2026-02-13 | 13F | Capital Square, LLC | 3.131 | 20,66 | 270 | 19,56 | ||||
| 2026-02-17 | 13F | Cetera Investment Advisers | 17.793 | 22,36 | 1.534 | 21,47 | ||||
| 2026-02-10 | 13F | Founders Financial Securities Llc | 26.100 | 20,23 | 2.250 | 19,31 | ||||
| 2026-02-13 | 13F | Inspire Advisors, LLC | 52.070 | -13,54 | 4.488 | -14,17 | ||||
| 2026-02-10 | 13F | AXS Investments LLC | 18.296 | 0,67 | 1.577 | -0,06 | ||||
| 2026-02-06 | 13F | Global Retirement Partners, LLC | 3.531 | 11,28 | 304 | 10,55 | ||||
| 2026-01-23 | 13F | Diversify Advisory Services, LLC | 3.351 | -2,93 | 291 | -2,02 | ||||
| 2026-02-17 | 13F | Bank Of America Corp /de/ | 41.221 | 5,46 | 3.553 | 4,68 | ||||
| 2026-04-10 | 13F | Perigon Wealth Management, LLC | 6.200 | -11,43 | 531 | -12,11 | ||||
| 2026-01-21 | 13F | Apella Capital, LLC | 20.130 | 0,64 | 1.735 | 1,28 | ||||
| 2026-02-17 | 13F | Clark Capital Management Group, Inc. | 25.379 | 2,62 | 2.188 | 1,86 | ||||
| 2025-11-03 | 13F | Summit Investment Advisory Services, LLC | 0 | -100,00 | 0 | |||||
| 2025-11-06 | 13F | Abich Financial Wealth Management LLC | 155 | 13 | ||||||
| 2026-02-05 | 13F | Thrivent Financial For Lutherans | 0 | -100,00 | 0 | |||||
| 2026-01-21 | 13F | Capital Advisory Group Advisory Services, LLC | 0 | -100,00 | 0 | |||||
| 2026-02-17 | 13F | Ibex Wealth Advisors | 26.839 | 9,06 | 2.314 | 8,24 | ||||
| 2026-04-07 | 13F | Park Avenue Securities Llc | 10.974 | 1 | ||||||
| 2026-02-17 | 13F | Advisory Services Network, LLC | 0 | -100,00 | 0 | |||||
| 2026-01-26 | 13F | United Advisor Group, LLC | 10.412 | -22,90 | 898 | -23,46 | ||||
| 2026-01-21 | 13F | Leo Wealth, LLC | 3.841 | 0,00 | 331 | -0,60 | ||||
| 2026-01-26 | 13F | Cwm, Llc | 235 | 1.368,75 | 0 | |||||
| 2026-01-20 | 13F | AdvisorNet Financial, Inc | 76.090 | 42,81 | 6.559 | 41,76 | ||||
| 2026-02-11 | 13F | Smithbridge Asset Management Inc/de | 9.062 | 14,07 | 781 | 13,35 | ||||
| 2026-02-12 | 13F | CIBC Private Wealth Group, LLC | 1.057 | 1,25 | 91 | 1,11 | ||||
| 2026-01-12 | 13F | Focus Financial Network, Inc. | 30.627 | 4,08 | 2.640 | 3,33 | ||||
| 2026-02-06 | 13F | Axxcess Wealth Management, Llc | 68.310 | -4,00 | 5.888 | -4,71 | ||||
| 2026-02-02 | 13F | Cornerstone Planning Group LLC | 11 | 0,00 | 1 | |||||
| 2026-02-17 | 13F | Elequin Capital Lp | 0 | -100,00 | 0 | |||||
| 2026-02-09 | 13F | Rooted Wealth Advisors, Inc. | 97.199 | 0,14 | 8.398 | 0,06 | ||||
| 2026-01-21 | 13F | New Wave Wealth Advisors Llc | 18.253 | 2,50 | 1.573 | 1,75 | ||||
| 2025-11-10 | 13F | Lion Street Advisors, LLC | 3.000 | 263 | ||||||
| 2026-02-02 | 13F | Advisors Preferred, LLC | 0 | -100,00 | 0 | |||||
| 2026-02-13 | 13F | Greenline Wealth Management LLC | 4.975 | 429 | ||||||
| 2026-02-11 | 13F | Janney Montgomery Scott LLC | 11.207 | 190,34 | 1 | |||||
| 2026-02-06 | 13F | Advisory Alpha, LLC | 2.425 | -2,96 | 209 | -2,79 | ||||
| 2026-01-30 | 13F | Strategic Blueprint, LLC | 2.455 | 212 | ||||||
| 2026-02-04 | 13F | Strait & Sound Wealth Management LLC | 14.416 | 3,17 | 1.243 | 2,39 | ||||
| 2026-02-17 | 13F | Fmr Llc | 113 | 0,00 | 10 | 0,00 | ||||
| 2025-11-04 | 13F | Meridian Wealth Management, LLC | 0 | -100,00 | 0 | |||||
| 2025-11-13 | 13F | Quartz Partners, LLC | 0 | -100,00 | 0 | |||||
| 2026-02-12 | 13F | Kovack Advisors, Inc. | 45.164 | -51,40 | 3.890 | -51,80 | ||||
| 2026-02-13 | 13F | Mml Investors Services, Llc | 39.765 | 13,15 | 3.428 | 12,29 | ||||
| 2026-02-03 | 13F | Anfield Capital Management, LLC | 1.971 | 39,10 | 170 | 37,40 | ||||
| 2026-04-07 | 13F | Farther Finance Advisors, LLC | 419 | -3,01 | 36 | -5,41 | ||||
| 2026-02-18 | 13F | GWM Advisors LLC | 1.250 | -44,44 | 108 | -45,13 | ||||
| 2026-01-20 | 13F | Sheets Smith Wealth Management | 13.515 | 5,46 | 1.165 | 4,68 | ||||
| 2026-01-14 | 13F | ORG Partners LLC | 3.200 | 0,00 | 276 | -0,72 | ||||
| 2026-02-13 | 13F | Aptus Capital Advisors, LLC | 0 | -100,00 | 0 | |||||
| 2026-02-02 | 13F | Fifth Third Bancorp | 111 | 10 | ||||||
| 2026-02-17 | 13F | Signature Equity Partners, LLC | 13 | 1 | ||||||
| 2026-02-09 | 13F | Huntington National Bank | 1 | |||||||
| 2026-01-26 | 13F | Key Capital Management, INC | 85 | 7 | ||||||
| 2026-02-11 | 13F | Capital Analysts, Inc. | 54 | 0,00 | 0 | |||||
| 2026-02-17 | 13F | Regal Investment Advisors LLC | 6.135 | 12,73 | 529 | 11,86 | ||||
| 2026-02-17 | 13F | Dark Forest Capital Management Lp | 0 | -100,00 | 0 | |||||
| 2026-02-09 | 13F | Harbour Investments, Inc. | 358 | -5,54 | 31 | -6,25 | ||||
| 2026-01-26 | 13F | Reyes Financial Architecture, Inc. | 0 | -100,00 | 0 | |||||
| 2026-01-26 | 13F | Private Trust Co Na | 252 | 2,86 | 22 | 0,00 | ||||
| 2026-01-29 | 13F | UBS Group AG | 60.463 | -39,10 | 5.212 | -39,56 | ||||
| 2026-02-10 | 13F | Foundations Investment Advisors, LLC | 68.936 | 9,72 | 5.942 | 8,91 | ||||
| 2026-02-12 | 13F | BlackRock, Inc. | 4.609 | -6,95 | 397 | -7,67 | ||||
| 2026-02-05 | 13F | Park Square Financial Group, LLC | 3 | 0,00 | 0 | |||||
| 2026-02-17 | 13F | Ancora Advisors, LLC | 0 | -100,00 | 0 | |||||
| 2026-02-11 | 13F | J.w. Cole Advisors, Inc. | 2.387 | -1,57 | 206 | -2,38 | ||||
| 2026-01-15 | 13F | Brookstone Capital Management | 5.590 | 3,21 | 482 | 2,34 | ||||
| 2026-02-17 | 13F | Raymond James Financial Inc | 83.874 | 69,21 | 7.230 | 67,96 | ||||
| 2026-02-13 | 13F | Golden State Wealth Management, LLC | 4.848 | -6,34 | 418 | -7,13 | ||||
| 2026-02-17 | 13F | Trustmark National Bank Trust Department | 4.393 | 0,00 | 379 | -0,79 | ||||
| 2026-02-13 | 13F | MAI Capital Management | 55 | 0,00 | 5 | 0,00 | ||||
| 2025-11-06 | 13F | Ameritas Advisory Services, LLC | 0 | -100,00 | 0 | |||||
| 2025-11-13 | 13F | Parallel Advisors, LLC | 0 | -100,00 | 0 | |||||
| 2026-02-12 | 13F | Steward Partners Investment Advisory, Llc | 176 | 15 | ||||||
| 2026-01-23 | 13F | Assetmark, Inc | 16 | 0,00 | 1 | 0,00 | ||||
| 2026-01-28 | 13F | Trademark Financial Management, LLC | 2.553 | 220 | ||||||
| 2026-01-21 | 13F | Capital Investment Advisory Services, LLC | 28 | 0,00 | 2 | 0,00 | ||||
| 2026-02-06 | 13F | GPS Wealth Strategies Group, LLC | 0 | -100,00 | 0 | |||||
| 2025-11-13 | 13F | Bank Of Montreal /can/ | 0 | -100,00 | 0 | |||||
| 2026-01-23 | 13F | Eagle Strategies LLC | 0 | -100,00 | 0 | |||||
| 2026-01-29 | 13F | Nbc Securities, Inc. | 310 | 2,31 | 27 | 0,00 | ||||
| 2026-02-14 | 13F | Rockefeller Capital Management L.P. | 24.927 | 9,07 | 2.149 | 8,27 | ||||
| 2026-01-28 | 13F | Geneos Wealth Management Inc. | 7 | 1 | ||||||
| 2026-02-11 | 13F | LPL Financial LLC | 268.735 | 4,47 | 23.165 | 3,70 | ||||
| 2025-11-12 | 13F | Napa Wealth Management | 6.701 | 1,58 | 582 | 1,93 | ||||
| 2026-02-12 | 13F | Jane Street Group, Llc | 6.328 | -60,33 | 545 | -60,65 | ||||
| 2026-01-30 | 13F | Sigma Planning Corp | 2.566 | 221 |