Grundlæggende statistik
| Institutionelle ejere | 101 total, 101 long only, 0 short only, 0 long/short - change of 4,04% MRQ |
| Gennemsnitlig porteføljeallokering | 0.0246 % - change of -63,81% MRQ |
| Institutionelle aktier (lange) | 3.128.320 (ex 13D/G) - change of -0,08MM shares -2,64% MRQ |
| Institutionel værdi (lang) | $ 58.537 USD ($1000) |
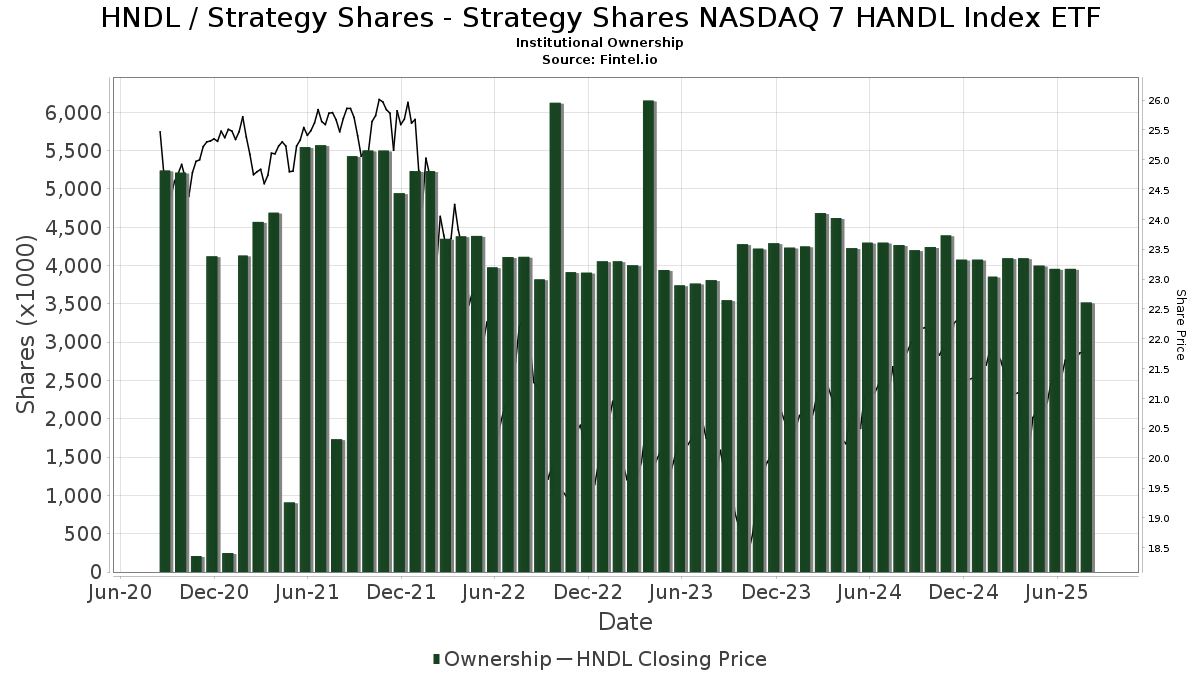
Institutionelt ejerskab og aktionærer
Strategy Shares - Strategy Shares NASDAQ 7 HANDL Index ETF (US:HNDL) har 101 institutionelle ejere og aktionærer, der har indsendt 13D/G- eller 13F-formularer til Securities Exchange Commission (SEC). Disse institutioner har i alt 3,128,320 aktier. Største aktionærer omfatter LPL Financial LLC, Cambridge Investment Research Advisors, Inc., Advisor Group Holdings, Inc., Summit Financial, LLC, Private Advisor Group, LLC, Cetera Investment Advisers, Newbridge Financial Services Group, Inc., Berger Financial Group, Inc, Creative Planning, and Larson Financial Group LLC .
Strategy Shares - Strategy Shares NASDAQ 7 HANDL Index ETF (NasdaqGM:HNDL) institutionel ejerskabsstruktur viser aktuelle positioner i virksomheden efter institutioner og fonde, samt seneste ændringer i positionsstørrelse. Større aktionærer kan omfatte individuelle investorer, investeringsforeninger, hedgefonde eller institutioner. Skema 13D angiver, at investoren besidder (eller besidder) mere end 5 % af virksomheden og har til hensigt (eller har til hensigt at) aktivt at forfølge en ændring i forretningsstrategi. Skema 13G indikerer en passiv investering på over 5%.
The share price as of March 31, 2026 is 21,84 / share. Previously, on April 1, 2025, the share price was 21,08 / share. This represents an increase of 3,61% over that period.
Fondens stemningsscore
Fund Sentiment Score (fka Ownership Accumulation Score) finder de aktier, der bliver mest købt af fonde. Det er resultatet af en sofistikeret, multi-faktor kvantitativ model, der identificerer virksomheder med de højeste niveauer af institutionel akkumulering. Scoringsmodellen bruger en kombination af den samlede stigning i oplyste ejere, ændringerne i porteføljeallokeringer i disse ejere og andre målinger. Tallet går fra 0 til 100, hvor højere tal indikerer et højere niveau af akkumulering for sine jævnaldrende, og 50 er gennemsnittet.
Opdateringsfrekvens: Dagligt
Se Ownership Explorer, som giver en liste over højest rangerende virksomheder.
AI+ Ask Fintel’s AI assistant about Strategy Shares - Strategy Shares NASDAQ 7 HANDL Index ETF.
Select a question to share a public post with an AI-crafted answer.
Thinking of good questions…
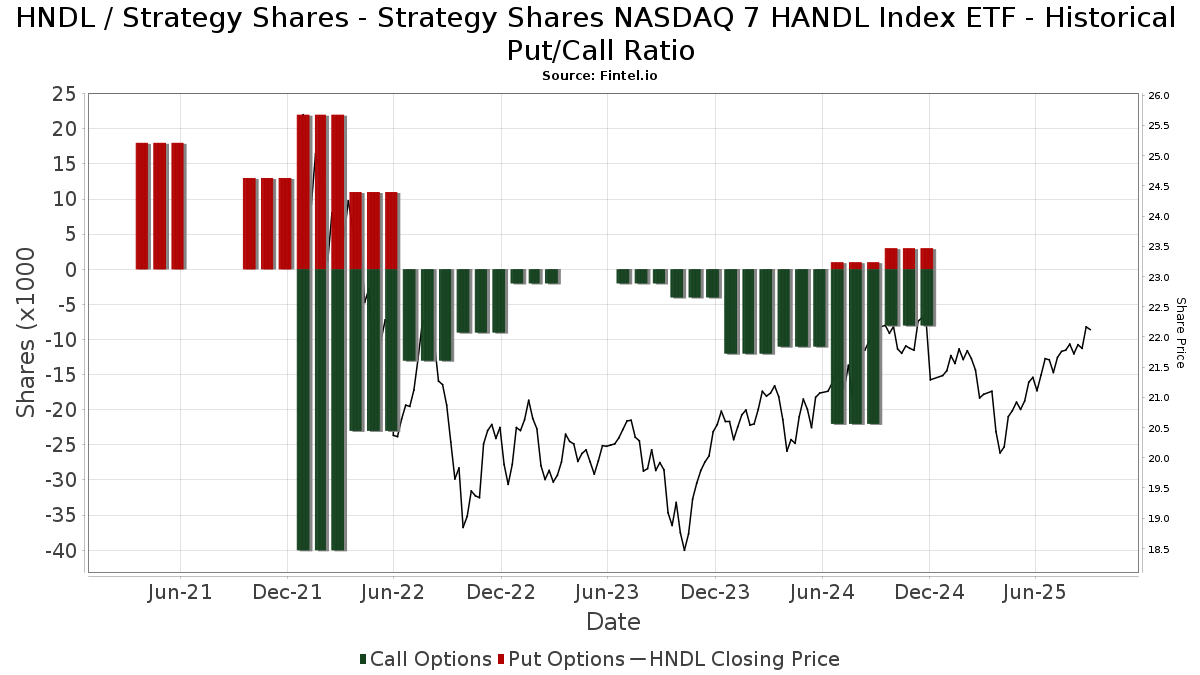
Institutionel Put/Call-forhold
Ud over at indberette standardaktie- og gældsudstedelser skal institutter med mere end 100 mill. aktiver under forvaltning også oplyse deres put- og call-optionsbeholdninger. Da salgsoptioner generelt indikerer negativ stemning, og købsoptioner indikerer positiv stemning, kan vi få en fornemmelse af den overordnede institutionelle stemning ved at plotte forholdet mellem put og kald. Diagrammet til højre viser det historiske put/call-forhold for dette instrument.
Brug af Put/Call Ratio som en indikator for investorernes stemning overvinder en af de vigtigste mangler ved at bruge totalt institutionelt ejerskab, som er, at en betydelig mængde af aktiver under forvaltning investeres passivt for at spore indekser. Passivt forvaltede fonde køber typisk ikke optioner, så indikatoren for put/call-forholdet følger mere nøje følelsen af aktivt forvaltede fonde.
13F og NPORT arkivering
Detaljer om 13F-arkivering er gratis. Detaljer om NP-ansøgninger kræver et premium-medlemskab. Grønne rækker angiver nye positioner. Røde rækker angiver lukkede positioner. Klik på linket ikon for at se den fulde transaktionshistorik.
Opgrader
for at låse premium-data op og eksportere til Excel ![]() .
.
| Fil dato | Kilde | Investor | Type | Gennemsnitlig pris (Øst) |
Aktier | Δ Aktier (%) |
Rapporteret Værdi ($1000) |
Δ Værdi (%) |
Port Alloc (%) |
|
|---|---|---|---|---|---|---|---|---|---|---|
| 2026-01-26 | 13F | Nations Financial Group Inc, /ia/ /adv | 16.278 | -0,91 | 358 | -1,92 | ||||
| 2026-02-13 | 13F | Gts Securities Llc | 41.599 | 916 | ||||||
| 2026-02-17 | 13F | Advisory Services Network, LLC | 0 | -100,00 | 0 | |||||
| 2026-02-18 | 13F | Caitlin John, LLC | 145 | -38,30 | 3 | -40,00 | ||||
| 2026-01-13 | 13F | Cadent Capital Advisors, LLC | 0 | -100,00 | 0 | |||||
| 2026-02-02 | 13F | Cornerstone Planning Group LLC | 40 | -40,30 | 1 | -100,00 | ||||
| 2026-02-11 | 13F | Vermillion Wealth Management, Inc. | 500 | 0,00 | 11 | 0,00 | ||||
| 2026-02-17 | 13F | Regal Investment Advisors LLC | 10.839 | 239 | ||||||
| 2026-02-05 | 13F | Allworth Financial LP | 8.278 | 0,60 | 182 | -0,55 | ||||
| 2026-01-28 | 13F | Geneos Wealth Management Inc. | 1.300 | 0,00 | 29 | 0,00 | ||||
| 2026-02-17 | 13F | Cetera Investment Advisers | 105.799 | -21,01 | 2.330 | -21,95 | ||||
| 2026-02-11 | 13F | Janney Montgomery Scott LLC | 13.483 | 37,06 | 0 | |||||
| 2026-02-04 | 13F | BEAM Asset Management, LLC | 23.483 | 1,40 | 517 | 0,39 | ||||
| 2026-01-20 | 13F | Accel Wealth Management | 21.462 | -8,66 | 473 | -9,75 | ||||
| 2026-01-02 | 13F | Insight Wealth Strategies, LLC | 0 | -100,00 | 0 | |||||
| 2025-11-13 | 13F | Bokf, Na | 0 | -100,00 | 0 | -100,00 | ||||
| 2026-01-21 | 13F | Sowell Financial Services LLC | 40.189 | 0,08 | 885 | -1,12 | ||||
| 2026-02-13 | 13F | Wells Fargo & Company/mn | 1 | 0 | ||||||
| 2026-02-09 | 13F | Harbour Investments, Inc. | 38.774 | -4,74 | 854 | -5,85 | ||||
| 2026-02-11 | 13F | Capital Analysts, Inc. | 276 | 0,00 | 0 | |||||
| 2026-01-29 | 13F | Nbc Securities, Inc. | 3.710 | 0,00 | 82 | -1,22 | ||||
| 2026-02-17 | 13F | Royal Bank Of Canada | 400 | -60,00 | 9 | -59,09 | ||||
| 2026-01-06 | 13F | Investors Research Corp | 503 | 0,00 | 11 | 0,00 | ||||
| 2026-01-22 | 13F | Glass Jacobson Investment Advisors llc | 155 | 0,00 | 3 | 0,00 | ||||
| 2026-02-10 | 13F | Envestnet Asset Management Inc | 33.880 | -5,99 | 746 | -6,98 | ||||
| 2026-02-12 | 13F | Summit Financial, LLC | 173.508 | 9,45 | 3.821 | 8,15 | ||||
| 2026-01-23 | 13F | Bellevue Asset Management, Llc | 350 | 0,00 | 8 | 0,00 | ||||
| 2026-02-12 | 13F | CIBC Private Wealth Group, LLC | 215 | 1,42 | 5 | 0,00 | ||||
| 2026-01-27 | 13F | Berger Financial Group, Inc | 96.529 | -7,94 | 2.126 | -9,03 | ||||
| 2026-01-07 | 13F | Massmutual Trust Co Fsb/adv | 9.857 | 0,00 | 217 | -0,91 | ||||
| 2026-02-06 | 13F | VSM Wealth Advisory, LLC | 480 | 30,79 | 11 | 25,00 | ||||
| 2026-02-06 | 13F | Larson Financial Group LLC | 60.740 | 7,52 | 1.337 | 6,28 | ||||
| 2026-01-29 | 13F | St Germain D J Co Inc | 700 | 0,00 | 15 | 0,00 | ||||
| 2025-10-23 | 13F | Ferguson Wellman Capital Management, Inc | 0 | -100,00 | 0 | |||||
| 2026-02-13 | 13F | Mml Investors Services, Llc | 60.342 | 0,51 | 1.329 | -0,67 | ||||
| 2026-02-12 | 13F | Hrt Financial Lp | 11.303 | -48,59 | 0 | |||||
| 2026-02-12 | 13F | Wedbush Securities Inc | 9.191 | 0 | ||||||
| 2026-02-17 | 13F | Equitable Holdings, Inc. | 10.349 | 0,53 | 228 | -0,87 | ||||
| 2026-02-12 | 13F | Johnson Financial Group, Inc. | 972 | 0,00 | 21 | 0,00 | ||||
| 2026-02-11 | 13F | Commonwealth Retirement Investments LLC | 500 | 11 | ||||||
| 2026-01-22 | 13F | Vision Financial Markets Llc | 517 | 1,77 | 11 | 0,00 | ||||
| 2025-11-14 | 13F | Bank Of America Corp /de/ | 0 | -100,00 | 0 | |||||
| 2026-01-15 | 13F | OxenFree Capital LLC | 43.989 | 1,81 | 969 | -0,21 | ||||
| 2026-01-23 | 13F | Private Wealth Management Group, LLC | 852 | 0,00 | 19 | 0,00 | ||||
| 2026-02-03 | 13F | RFG Advisory, LLC | 44.309 | -15,09 | 976 | -16,09 | ||||
| 2026-01-09 | 13F | Dynamic Advisor Solutions LLC | 18.050 | 0,33 | 397 | -0,75 | ||||
| 2026-02-05 | 13F | IMG Wealth Management, Inc. | 6.289 | -9,29 | 138 | -10,39 | ||||
| 2026-01-29 | 13F | Quent Capital, LLC | 3 | 0,00 | 0 | |||||
| 2026-02-06 | 13F | Advisory Alpha, LLC | 0 | -100,00 | 0 | |||||
| 2026-02-02 | 13F | Mutual Advisors, LLC | 12.000 | 0,00 | 264 | -1,12 | ||||
| 2026-02-05 | 13F | Sequent Planning LLC | 10.577 | -12,98 | 233 | -14,07 | ||||
| 2026-02-11 | 13F | Strategic Advocates LLC | 104 | 1,96 | 2 | 0,00 | ||||
| 2026-02-04 | 13F | Ameritas Advisory Services, LLC | 0 | -100,00 | 0 | -100,00 | ||||
| 2026-02-17 | 13F | SageView Advisory Group, LLC | 4.875 | 107 | ||||||
| 2026-02-18 | 13F | GWM Advisors LLC | 28.425 | -8,66 | 626 | -9,81 | ||||
| 2026-02-13 | 13F | MAI Capital Management | 2 | -99,89 | 0 | -100,00 | ||||
| 2026-02-09 | 13F | Huntington National Bank | 7 | 0,00 | ||||||
| 2026-02-03 | 13F | We Are One Seven, LLC | 12.099 | -0,21 | 266 | -1,48 | ||||
| 2026-02-18 | 13F | Garton & Associates Financial Advisors LLC | 1.125 | 25 | ||||||
| 2026-01-21 | 13F | Newbridge Financial Services Group, Inc. | 103.750 | 4,92 | 2.285 | 3,68 | ||||
| 2026-02-10 | 13F/A | Northwestern Mutual Wealth Management Co | 119 | 3 | ||||||
| 2026-02-13 | 13F | Arkadios Wealth Advisors | 14.196 | 3,63 | 313 | 2,30 | ||||
| 2026-01-13 | 13F | CoreCap Advisors, LLC | 10.881 | 0,00 | 240 | -1,24 | ||||
| 2026-02-06 | 13F | GPS Wealth Strategies Group, LLC | 0 | -100,00 | 0 | |||||
| 2025-10-17 | 13F | Retireful, LLC | 0 | -100,00 | 0 | |||||
| 2025-11-14 | 13F | WNY Asset Management, LLC | 10.431 | -1,67 | 232 | 1,31 | ||||
| 2025-10-16 | 13F | PFS Partners, LLC | 0 | -100,00 | 0 | |||||
| 2026-01-30 | 13F | North Star Investment Management Corp. | 500 | 0,00 | 11 | 0,00 | ||||
| 2026-02-13 | 13F | Asset Allocation Strategies LLC | 16.801 | -3,52 | 370 | -4,65 | ||||
| 2026-01-14 | 13F | Wealthcare Advisory Partners LLC | 10.288 | -24,02 | 227 | -24,92 | ||||
| 2026-02-12 | 13F | Federation des caisses Desjardins du Quebec | 275 | 0,00 | 6 | 0,00 | ||||
| 2026-01-14 | 13F | Spire Wealth Management | 9.367 | -36,74 | 206 | -37,39 | ||||
| 2026-01-23 | 13F | Farther Finance Advisors, LLC | 9.150 | -4,29 | 201 | -5,19 | ||||
| 2026-02-05 | 13F | Cambridge Investment Research Advisors, Inc. | 405.816 | 4,35 | 9 | 0,00 | ||||
| 2026-01-30 | 13F | Us Bancorp \de\ | 0 | -100,00 | 0 | |||||
| 2025-11-06 | 13F | Stratos Wealth Partners, LTD. | 0 | -100,00 | 0 | -100,00 | ||||
| 2026-01-29 | 13F | Sanctuary Advisors, LLC | 37.370 | -3,46 | 823 | -4,64 | ||||
| 2026-02-04 | 13F | Fourth Dimension Wealth, LLC | 5 | 0,00 | 0 | |||||
| 2026-02-17 | 13F | Private Advisor Group, LLC | 114.984 | -1,59 | 2.532 | -2,77 | ||||
| 2026-02-12 | 13F | Commonwealth Equity Services, Llc | 45.661 | -7,54 | 1.005 | 100.400,00 | ||||
| 2026-02-06 | 13F | Pnc Financial Services Group, Inc. | 1.590 | 35 | ||||||
| 2026-02-12 | 13F | Hollencrest Capital Management | 975 | 0,00 | 21 | 0,00 | ||||
| 2026-02-17 | 13F | Cape Investment Advisory, Inc. | 200 | 4 | ||||||
| 2026-01-05 | 13F | Noble Wealth Management PBC | 817 | 0,00 | 18 | -5,56 | ||||
| 2026-02-06 | 13F | HighTower Advisors, LLC | 21.811 | 0,11 | 480 | -1,03 | ||||
| 2026-02-03 | 13F | Koshinski Asset Management, Inc. | 9.666 | 213 | ||||||
| 2026-02-06 | 13F | Creative Financial Designs Inc /adv | 1 | 0,00 | 0 | |||||
| 2026-02-20 | 13F | Sunbelt Securities, Inc. | 400 | 0,00 | 9 | 0,00 | ||||
| 2026-02-17 | 13F | Raymond James Financial Inc | 9.181 | 202 | ||||||
| 2026-02-11 | 13F | LPL Financial LLC | 767.283 | -0,06 | 16.896 | -1,22 | ||||
| 2026-02-14 | 13F | Rockefeller Capital Management L.P. | 510 | 1,59 | 11 | 0,00 | ||||
| 2026-01-20 | 13F | Coastal Investment Advisors, Inc. | 11.827 | 14,14 | 260 | 13,04 | ||||
| 2026-01-30 | 13F | Jackson Hole Capital Partners, LLC | 15.000 | 330 | ||||||
| 2026-02-06 | 13F | IFP Advisors, Inc | 599 | -33,44 | 13 | -35,00 | ||||
| 2026-01-16 | 13F | Ronald Blue Trust, Inc. | 25 | 0,00 | 1 | |||||
| 2026-02-12 | 13F | BRYN MAWR TRUST Co | 1.610 | 0,00 | 35 | 0,00 | ||||
| 2026-02-13 | 13F | Aptus Capital Advisors, LLC | 2.102 | 0,00 | 46 | 0,00 | ||||
| 2026-02-17 | 13F | Susquehanna International Group, Llp | 47.586 | 254,06 | 1.048 | 250,17 | ||||
| 2026-02-17 | 13F | Mercer Global Advisors Inc /adv | 19.339 | -54,05 | 426 | -54,64 | ||||
| 2026-02-11 | 13F | J.w. Cole Advisors, Inc. | 42.598 | 0,16 | 640 | -32,52 | ||||
| 2026-02-17 | 13F | Citadel Advisors Llc | 9.691 | 213 | ||||||
| 2026-01-30 | 13F | Urban Wealth Management, LLC | 0 | -100,00 | 0 | |||||
| 2026-02-12 | 13F | Jane Street Group, Llc | 18.178 | -27,09 | 400 | -27,93 | ||||
| 2026-02-09 | 13F | Wellington Shields & Co., LLC | 15.290 | 337 | ||||||
| 2026-01-12 | 13F | Meadowbrook Wealth Management, LLC | 10.100 | 0,00 | 222 | -1,33 | ||||
| 2026-01-26 | 13F | Asset Dedication, LLC | 565 | 0,00 | 12 | 0,00 | ||||
| 2025-11-07 | 13F | Atticus Wealth Management, Llc | 0 | -100,00 | 0 | -100,00 | ||||
| 2025-11-14 | 13F | Old Mission Capital Llc | 0 | -100,00 | 0 | |||||
| 2026-02-13 | 13F | Kestra Advisory Services, LLC | 0 | -100,00 | 0 | |||||
| 2026-02-05 | 13F | AlphaCore Capital LLC | 0 | 0 | ||||||
| 2026-02-05 | 13F | Western Wealth Management, LLC | 14.605 | 56,79 | 322 | 55,07 | ||||
| 2026-02-17 | 13F | Creative Planning | 69.413 | 0,57 | 1.528 | -0,59 | ||||
| 2026-01-23 | 13F | Assetmark, Inc | 128 | 1.180,00 | 3 | |||||
| 2026-01-27 | 13F | Institute for Wealth Management, LLC. | 0 | -100,00 | 0 | |||||
| 2026-02-23 | 13F | Virtu Financial LLC | 0 | -100,00 | 0 | |||||
| 2025-11-12 | 13F | Park Square Financial Group, LLC | 0 | -100,00 | 0 | |||||
| 2026-02-11 | 13F | Jpmorgan Chase & Co | 35.191 | -3,77 | 775 | -4,91 | ||||
| 2026-02-12 | 13F | Steward Partners Investment Advisory, Llc | 462 | 0,00 | 10 | 0,00 | ||||
| 2026-01-26 | 13F | Cwm, Llc | 14.773 | 0,01 | 0 | |||||
| 2026-02-17 | 13F | Advisor Group Holdings, Inc. | 206.404 | 0,90 | 4.545 | 0,31 | ||||
| 2026-02-17 | 13F | Fmr Llc | 725 | 130,16 | 16 | 114,29 | ||||
| 2026-01-29 | 13F | UBS Group AG | 631 | -68,70 | 14 | -70,45 | ||||
| 2026-02-13 | 13F | Morgan Stanley | 10.104 | -19,04 | 222 | -20,14 |