Grundlæggende statistik
| Institutionelle ejere | 86 total, 86 long only, 0 short only, 0 long/short - change of 4,88% MRQ |
| Gennemsnitlig porteføljeallokering | 0.2793 % - change of -8,49% MRQ |
| Institutionelle aktier (lange) | 11.974.476 (ex 13D/G) - change of 0,60MM shares 5,30% MRQ |
| Institutionel værdi (lang) | $ 426.979 USD ($1000) |
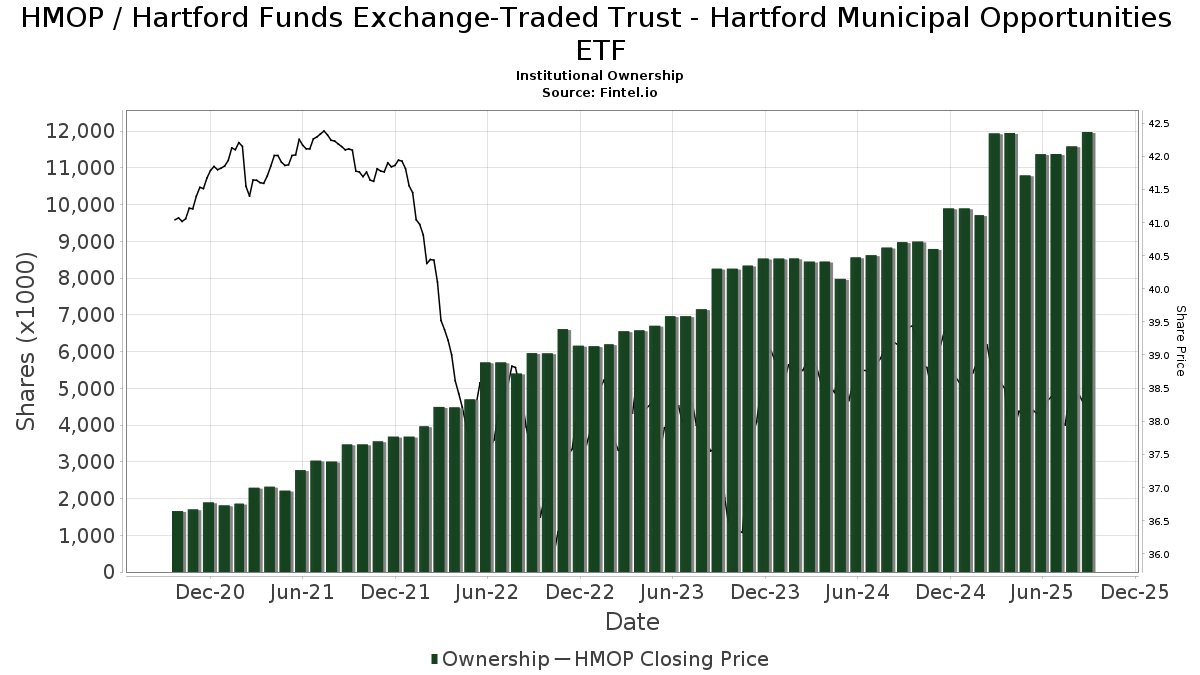
Institutionelt ejerskab og aktionærer
Hartford Funds Exchange-Traded Trust - Hartford Municipal Opportunities ETF (US:HMOP) har 86 institutionelle ejere og aktionærer, der har indsendt 13D/G- eller 13F-formularer til Securities Exchange Commission (SEC). Disse institutioner har i alt 11,974,476 aktier. Største aktionærer omfatter Northwestern Mutual Wealth Management Co, HighTower Advisors, LLC, Raymond James Financial Inc, Bank Of America Corp /de/, Steward Partners Investment Advisory, Llc, LPL Financial LLC, Goldstein Advisors, LLC, Legacy Wealth Management, Inc, Apollon Wealth Management, LLC, and Colony Group, LLC .
Hartford Funds Exchange-Traded Trust - Hartford Municipal Opportunities ETF (ARCA:HMOP) institutionel ejerskabsstruktur viser aktuelle positioner i virksomheden efter institutioner og fonde, samt seneste ændringer i positionsstørrelse. Større aktionærer kan omfatte individuelle investorer, investeringsforeninger, hedgefonde eller institutioner. Skema 13D angiver, at investoren besidder (eller besidder) mere end 5 % af virksomheden og har til hensigt (eller har til hensigt at) aktivt at forfølge en ændring i forretningsstrategi. Skema 13G indikerer en passiv investering på over 5%.
The share price as of September 5, 2025 is 38,57 / share. Previously, on September 9, 2024, the share price was 39,26 / share. This represents a decline of 1,76% over that period.
Fondens stemningsscore
Fund Sentiment Score (fka Ownership Accumulation Score) finder de aktier, der bliver mest købt af fonde. Det er resultatet af en sofistikeret, multi-faktor kvantitativ model, der identificerer virksomheder med de højeste niveauer af institutionel akkumulering. Scoringsmodellen bruger en kombination af den samlede stigning i oplyste ejere, ændringerne i porteføljeallokeringer i disse ejere og andre målinger. Tallet går fra 0 til 100, hvor højere tal indikerer et højere niveau af akkumulering for sine jævnaldrende, og 50 er gennemsnittet.
Opdateringsfrekvens: Dagligt
Se Ownership Explorer, som giver en liste over højest rangerende virksomheder.
Institutionel Put/Call-forhold
Ud over at indberette standardaktie- og gældsudstedelser skal institutter med mere end 100 mill. aktiver under forvaltning også oplyse deres put- og call-optionsbeholdninger. Da salgsoptioner generelt indikerer negativ stemning, og købsoptioner indikerer positiv stemning, kan vi få en fornemmelse af den overordnede institutionelle stemning ved at plotte forholdet mellem put og kald. Diagrammet til højre viser det historiske put/call-forhold for dette instrument.
Brug af Put/Call Ratio som en indikator for investorernes stemning overvinder en af de vigtigste mangler ved at bruge totalt institutionelt ejerskab, som er, at en betydelig mængde af aktiver under forvaltning investeres passivt for at spore indekser. Passivt forvaltede fonde køber typisk ikke optioner, så indikatoren for put/call-forholdet følger mere nøje følelsen af aktivt forvaltede fonde.
13F og NPORT arkivering
Detaljer om 13F-arkivering er gratis. Detaljer om NP-ansøgninger kræver et premium-medlemskab. Grønne rækker angiver nye positioner. Røde rækker angiver lukkede positioner. Klik på linket ikon for at se den fulde transaktionshistorik.
Opgrader
for at låse premium-data op og eksportere til Excel ![]() .
.
| Fil dato | Kilde | Investor | Type | Gennemsnitlig pris (Øst) |
Aktier | Δ Aktier (%) |
Rapporteret Værdi ($1000) |
Δ Værdi (%) |
Port Alloc (%) |
|
|---|---|---|---|---|---|---|---|---|---|---|
| 2025-07-08 | 13F | Richard P Slaughter Associates Inc | 35.827 | 159,58 | 1.371 | 158,68 | ||||
| 2025-04-15 | 13F | Central Valley Advisors, Llc | 0 | -100,00 | 0 | |||||
| 2025-07-28 | 13F | Naviter Wealth, LLC | 0 | -100,00 | 0 | |||||
| 2025-08-01 | 13F | Envestnet Asset Management Inc | 139.916 | 39,53 | 5.356 | 38,91 | ||||
| 2025-08-04 | 13F | Amplius Wealth Advisors, LLC | 25.055 | -29,28 | 959 | -29,59 | ||||
| 2025-08-12 | 13F | OneAscent Financial Services LLC | 8.422 | 0,00 | 0 | |||||
| 2025-08-12 | 13F | Putnam Fl Investment Management Co | 5.601 | 0,00 | 214 | -0,47 | ||||
| 2025-08-11 | 13F | Avantax Planning Partners, Inc. | 157.679 | 563,21 | 6.036 | 560,28 | ||||
| 2025-08-05 | 13F | Sigma Planning Corp | 14.190 | 53,31 | 543 | 52,96 | ||||
| 2025-07-18 | 13F | Vicus Capital | 10.813 | -11,59 | 414 | -12,13 | ||||
| 2025-08-14 | 13F | Abound Financial, Llc | 0 | -100,00 | 0 | |||||
| 2025-07-31 | 13F | West Michigan Advisors, Llc | 5.856 | -2,04 | 225 | -2,61 | ||||
| 2025-08-14 | 13F | Comerica Bank | 3.802 | -58,00 | 146 | -58,33 | ||||
| 2025-08-14 | 13F | UBS Group AG | 282 | 11 | ||||||
| 2025-07-01 | 13F | Stonehearth Capital Management, LLC | 27.120 | 14,01 | 1.038 | 13,57 | ||||
| 2025-07-17 | 13F | Fifth Third Securities, Inc. | 33.266 | 32,61 | 1.273 | 32,05 | ||||
| 2025-08-07 | 13F | Verus Capital Partners, Llc | 9.498 | 364 | ||||||
| 2025-08-12 | 13F | RiverFront Investment Group, LLC | 81.341 | 14,24 | 3.114 | 13,74 | ||||
| 2025-07-25 | 13F | Landmark Wealth Management, LLC | 58.517 | -1,09 | 2 | 0,00 | ||||
| 2025-07-30 | 13F | Retirement Planning Group | 49.381 | 310,14 | 1.890 | 309,09 | ||||
| 2025-08-08 | 13F | Avantax Advisory Services, Inc. | 67.049 | -3,03 | 2.567 | -3,46 | ||||
| 2025-08-01 | 13F/A | GGM Financials LLC | 92.069 | 461,50 | 3.524 | 459,37 | ||||
| 2025-08-13 | 13F | Cresset Asset Management, LLC | 0 | -100,00 | 0 | |||||
| 2025-07-14 | 13F | Friday Financial | 6.443 | 0,00 | 247 | -0,40 | ||||
| 2025-08-12 | 13F | J.w. Cole Advisors, Inc. | 39.675 | 1.519 | ||||||
| 2025-04-24 | 13F | Legacy CG, LLC | 0 | -100,00 | 0 | -100,00 | ||||
| 2025-07-17 | 13F | HB Wealth Management, LLC | 5.645 | -11,52 | 216 | -11,84 | ||||
| 2025-08-12 | 13F | Steward Partners Investment Advisory, Llc | 721.130 | 2,62 | 27.605 | 2,17 | ||||
| 2025-07-21 | 13F | Sterling Investment Counsel, LLC | 40.701 | -75,08 | 1.558 | -75,18 | ||||
| 2025-08-07 | 13F | Donaldson Capital Management, Llc | 19.138 | 0,00 | 733 | -0,41 | ||||
| 2025-07-16 | 13F | Magnus Financial Group LLC | 31.762 | -3,24 | 1.216 | -3,72 | ||||
| 2025-07-09 | 13F | Thrive Wealth Management, LLC | 46.227 | 78,81 | 1.770 | 77,97 | ||||
| 2025-07-22 | 13F | Wealthcare Advisory Partners LLC | 159.290 | -40,52 | 6.098 | -40,78 | ||||
| 2025-07-29 | 13F | Stratos Wealth Partners, LTD. | 25.707 | 6,30 | 984 | 5,92 | ||||
| 2025-08-13 | 13F | Jones Financial Companies Lllp | 91.943 | 77,17 | 3.517 | 76,59 | ||||
| 2025-07-17 | 13F | Janney Montgomery Scott LLC | 149.650 | 2,51 | 6 | 0,00 | ||||
| 2025-07-17 | 13F | Johnson & White Wealth Management, LLC | 215.286 | 5,60 | 8 | 14,29 | ||||
| 2025-08-11 | 13F | Private Advisor Group, LLC | 30.978 | 78,28 | 1.186 | 77,40 | ||||
| 2025-08-12 | 13F | LPL Financial LLC | 546.833 | 45,96 | 20.933 | 45,32 | ||||
| 2025-07-17 | 13F | Montis Financial, LLC | 110.161 | -27,08 | 4.217 | -27,41 | ||||
| 2025-08-14 | 13F | Bank Of America Corp /de/ | 790.665 | 8,33 | 30.267 | 7,85 | ||||
| 2025-07-29 | 13F | Madison Wealth Partners, Inc | 7.411 | 0,00 | 284 | -0,35 | ||||
| 2025-07-22 | 13F | Strid Group, LLC | 89.403 | 1,28 | 3.422 | 0,85 | ||||
| 2025-08-14 | 13F | GWM Advisors LLC | 48.748 | -8,65 | 1.866 | -9,02 | ||||
| 2025-07-14 | 13F | Armstrong Advisory Group, Inc | 10.500 | 0,00 | 402 | -0,99 | ||||
| 2025-08-12 | 13F | Cornerstone Wealth Management, LLC | 36.549 | 18,03 | 1.399 | 17,56 | ||||
| 2025-07-31 | 13F | Cambridge Investment Research Advisors, Inc. | 32.214 | 3,39 | 1 | 0,00 | ||||
| 2025-07-17 | 13F | ERn Financial, LLC | 205.122 | -1,26 | 7.852 | -1,69 | ||||
| 2025-07-29 | 13F | Consilio Wealth Advisors, Llc | 115.349 | -6,36 | 4.412 | -6,84 | ||||
| 2025-05-15 | 13F | Creative Planning | 0 | -100,00 | 0 | |||||
| 2025-07-29 | 13F | Crux Wealth Advisors | 73.411 | -2,51 | 2.810 | -2,94 | ||||
| 2025-08-13 | 13F | Northwestern Mutual Wealth Management Co | 1.513.178 | 22,31 | 57.924 | 21,77 | ||||
| 2025-08-15 | 13F | Captrust Financial Advisors | 30.537 | -39,33 | 1.169 | -39,64 | ||||
| 2025-08-12 | 13F | Proequities, Inc. | 0 | 0 | ||||||
| 2025-08-15 | 13F | Kestra Advisory Services, LLC | 116.443 | -25,49 | 4.457 | -25,83 | ||||
| 2025-07-30 | 13F | Bleakley Financial Group, LLC | 32.895 | -35,69 | 1.259 | -35,96 | ||||
| 2025-08-13 | 13F | Sepio Capital, LP | 109.274 | -1,63 | 4.183 | -2,06 | ||||
| 2025-08-14 | 13F | Mariner, LLC | 128.551 | -2,92 | 4.921 | -3,36 | ||||
| 2025-07-14 | 13F | GAMMA Investing LLC | 28.917 | -21,71 | 1.107 | -22,11 | ||||
| 2025-07-29 | 13F | Goldstein Advisors, LLC | 505.155 | -5,99 | 19.337 | -6,41 | ||||
| 2025-08-14 | 13F | Jane Street Group, Llc | 51.923 | 25,10 | 1.988 | 24,58 | ||||
| 2025-08-04 | 13F | Pensionmark Financial Group, Llc | 94.893 | -29,17 | 3.633 | -29,49 | ||||
| 2025-07-15 | 13F | Signet Financial Management, Llc | 21.953 | -11,32 | 840 | -11,67 | ||||
| 2025-07-31 | 13F | Buckingham Strategic Partners | 9.291 | -0,04 | 356 | -0,56 | ||||
| 2025-08-14 | 13F | Colony Group, LLC | 369.887 | 2,14 | 14.159 | 1,69 | ||||
| 2025-05-15 | 13F | Tower Research Capital LLC (TRC) | 0 | -100,00 | 0 | |||||
| 2025-08-13 | 13F | Bernardo Wealth Planning LLC | 121.210 | -7,15 | 5 | -20,00 | ||||
| 2025-07-14 | 13F | Masso Torrence Wealth Management Inc. | 26.390 | 6,67 | 1.010 | 6,20 | ||||
| 2025-08-08 | 13F | Advyzon Investment Management, LLC | 18.764 | -11,98 | 718 | -12,33 | ||||
| 2025-09-04 | 13F/A | Advisor Group Holdings, Inc. | 116.127 | 9,65 | 4.446 | 9,18 | ||||
| 2025-07-30 | 13F | Princeton Global Asset Management LLC | 6.043 | 80,93 | 231 | 80,47 | ||||
| 2025-08-12 | 13F | Argent Trust Co | 8.387 | 321 | ||||||
| 2025-07-17 | 13F | Legacy Wealth Management, Inc | 501.436 | -2,23 | 19.195 | -2,67 | ||||
| 2025-04-30 | 13F | Axxcess Wealth Management, Llc | 0 | -100,00 | 0 | |||||
| 2025-07-25 | 13F | Apollon Financial, LLC | 41.411 | 1.585 | ||||||
| 2025-07-28 | 13F | Cornerstone Wealth Group, LLC | 32.322 | 1.237 | ||||||
| 2025-08-06 | 13F | Commonwealth Equity Services, Llc | 136.533 | -14,33 | 5 | -16,67 | ||||
| 2025-08-14 | 13F | Royal Bank Of Canada | 86.124 | -32,14 | 3.297 | -32,44 | ||||
| 2025-08-06 | 13F | Longview Financial Advisors LLC | 3.030 | 0,00 | 116 | -0,86 | ||||
| 2025-08-14 | 13F | Wells Fargo & Company/mn | 621 | 24 | ||||||
| 2025-04-22 | 13F | Hill Island Financial Llc | 0 | -100,00 | 0 | |||||
| 2025-07-22 | 13F | Merit Financial Group, LLC | 81.514 | -11,13 | 3.120 | -11,51 | ||||
| 2025-08-11 | 13F | HighTower Advisors, LLC | 1.358.488 | -18,12 | 52.003 | -18,48 | ||||
| 2025-07-25 | 13F | Apollon Wealth Management, LLC | 413.669 | 15.835 | ||||||
| 2025-08-13 | 13F | Flow Traders U.s. Llc | 22.529 | 287,23 | 1 | |||||
| 2025-08-14 | 13F | Old Mission Capital Llc | 14.586 | 558 | ||||||
| 2025-07-18 | 13F | Truist Financial Corp | 0 | -100,00 | 0 | |||||
| 2025-08-05 | 13F | Westside Investment Management, Inc. | 27.679 | -9,42 | 1.060 | -9,87 | ||||
| 2025-08-12 | 13F | Jpmorgan Chase & Co | 100.724 | 39,67 | 3.856 | 39,07 | ||||
| 2025-08-15 | 13F | Morgan Stanley | 882 | 3,16 | 34 | 3,13 | ||||
| 2025-08-08 | 13F | Cetera Investment Advisers | 70.535 | -2,17 | 2.700 | -2,60 | ||||
| 2025-05-12 | 13F | Fmr Llc | 0 | -100,00 | 0 | |||||
| 2025-08-13 | 13F | Capital Analysts, Inc. | 18.226 | 0,09 | 1 | |||||
| 2025-07-28 | 13F | Harbour Investments, Inc. | 4.442 | 3,04 | 170 | 3,03 | ||||
| 2025-08-14 | 13F | Raymond James Financial Inc | 1.186.316 | 3,66 | 45.412 | 3,20 | ||||
| 2025-08-04 | 13F | Savvy Advisors, Inc. | 23.817 | 912 | ||||||
| 2025-07-14 | 13F | AdvisorNet Financial, Inc | 6.759 | 0,06 | 259 | -0,39 | ||||
| 2025-08-14 | 13F | Mml Investors Services, Llc | 57.390 | 4,80 | 2 | 0,00 |