Grundlæggende statistik
| Institutionelle ejere | 85 total, 85 long only, 0 short only, 0 long/short - change of 18,06% MRQ |
| Gennemsnitlig porteføljeallokering | 1.0994 % - change of -14,08% MRQ |
| Institutionelle aktier (lange) | 49.123.609 (ex 13D/G) - change of -1,73MM shares -3,40% MRQ |
| Institutionel værdi (lang) | $ 4.142.297 USD ($1000) |
Institutionelt ejerskab og aktionærer
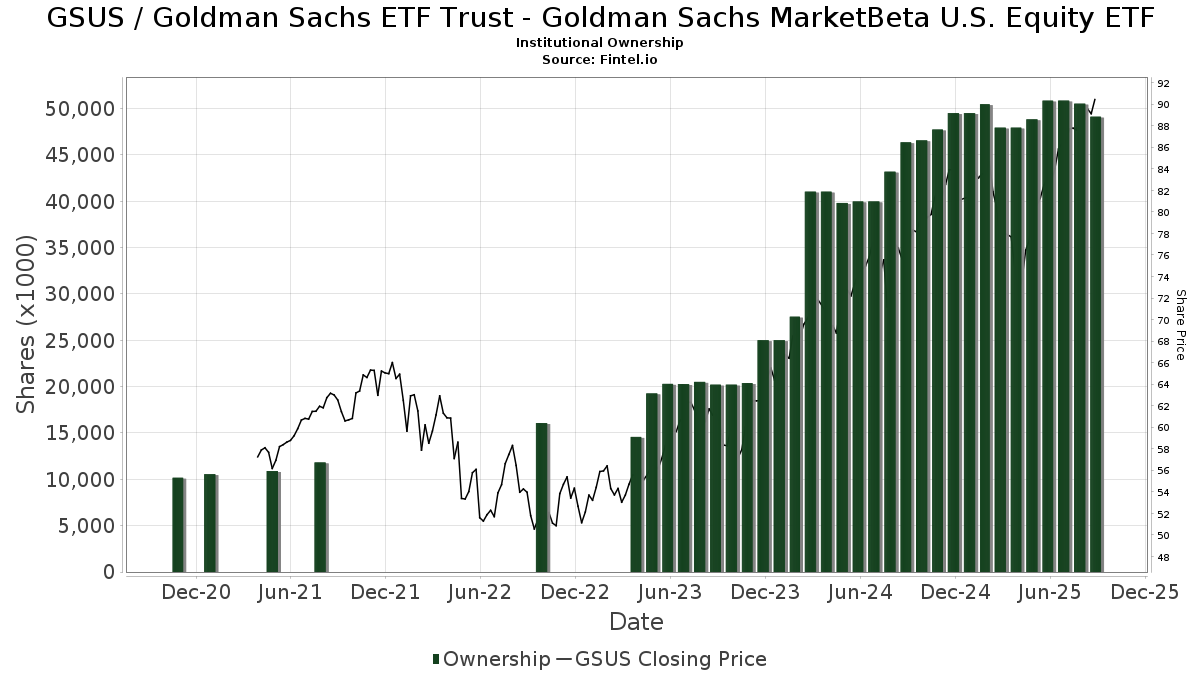
Goldman Sachs ETF Trust - Goldman Sachs MarketBeta U.S. Equity ETF (US:GSUS) har 85 institutionelle ejere og aktionærer, der har indsendt 13D/G- eller 13F-formularer til Securities Exchange Commission (SEC). Disse institutioner har i alt 49,123,609 aktier. Største aktionærer omfatter Goldman Sachs Group Inc, GGMBX - Goldman Sachs Global Managed Beta Fund Institutional Shares, LPL Financial LLC, Envestnet Asset Management Inc, GGSIX - Goldman Sachs Growth Strategy Portfolio Institutional, GOIIX - Goldman Sachs Growth and Income Strategy Portfolio Institutional, Principal Securities, Inc., Morgan Stanley, GAPIX - Goldman Sachs Dynamic Global Equity Fund Institutional, and Cetera Investment Advisers .
Goldman Sachs ETF Trust - Goldman Sachs MarketBeta U.S. Equity ETF (BATS:GSUS) institutionel ejerskabsstruktur viser aktuelle positioner i virksomheden efter institutioner og fonde, samt seneste ændringer i positionsstørrelse. Større aktionærer kan omfatte individuelle investorer, investeringsforeninger, hedgefonde eller institutioner. Skema 13D angiver, at investoren besidder (eller besidder) mere end 5 % af virksomheden og har til hensigt (eller har til hensigt at) aktivt at forfølge en ændring i forretningsstrategi. Skema 13G indikerer en passiv investering på over 5%.
The share price as of September 8, 2025 is 89,88 / share. Previously, on September 9, 2024, the share price was 75,02 / share. This represents an increase of 19,80% over that period.
Fondens stemningsscore
Fund Sentiment Score (fka Ownership Accumulation Score) finder de aktier, der bliver mest købt af fonde. Det er resultatet af en sofistikeret, multi-faktor kvantitativ model, der identificerer virksomheder med de højeste niveauer af institutionel akkumulering. Scoringsmodellen bruger en kombination af den samlede stigning i oplyste ejere, ændringerne i porteføljeallokeringer i disse ejere og andre målinger. Tallet går fra 0 til 100, hvor højere tal indikerer et højere niveau af akkumulering for sine jævnaldrende, og 50 er gennemsnittet.
Opdateringsfrekvens: Dagligt
Se Ownership Explorer, som giver en liste over højest rangerende virksomheder.
Institutionel Put/Call-forhold
Ud over at indberette standardaktie- og gældsudstedelser skal institutter med mere end 100 mill. aktiver under forvaltning også oplyse deres put- og call-optionsbeholdninger. Da salgsoptioner generelt indikerer negativ stemning, og købsoptioner indikerer positiv stemning, kan vi få en fornemmelse af den overordnede institutionelle stemning ved at plotte forholdet mellem put og kald. Diagrammet til højre viser det historiske put/call-forhold for dette instrument.
Brug af Put/Call Ratio som en indikator for investorernes stemning overvinder en af de vigtigste mangler ved at bruge totalt institutionelt ejerskab, som er, at en betydelig mængde af aktiver under forvaltning investeres passivt for at spore indekser. Passivt forvaltede fonde køber typisk ikke optioner, så indikatoren for put/call-forholdet følger mere nøje følelsen af aktivt forvaltede fonde.
13F og NPORT arkivering
Detaljer om 13F-arkivering er gratis. Detaljer om NP-ansøgninger kræver et premium-medlemskab. Grønne rækker angiver nye positioner. Røde rækker angiver lukkede positioner. Klik på linket ikon for at se den fulde transaktionshistorik.
Opgrader
for at låse premium-data op og eksportere til Excel ![]() .
.
| Fil dato | Kilde | Investor | Type | Gennemsnitlig pris (Øst) |
Aktier | Δ Aktier (%) |
Rapporteret Værdi ($1000) |
Δ Værdi (%) |
Port Alloc (%) |
|
|---|---|---|---|---|---|---|---|---|---|---|
| 2025-07-24 | 13F | Robertson Stephens Wealth Management, LLC | 293.346 | -24,87 | 25.102 | -16,40 | ||||
| 2025-05-15 | 13F | Two Sigma Securities, Llc | 0 | -100,00 | 0 | -100,00 | ||||
| 2025-08-19 | NP | GAPIX - Goldman Sachs Dynamic Global Equity Fund Institutional | 738.355 | -1,50 | 63.181 | 9,61 | ||||
| 2025-08-14 | 13F | Hurley Capital, LLC | 1.618 | 80,38 | 138 | 100,00 | ||||
| 2025-08-14 | 13F | Herold Advisors, Inc. | 3.368 | 0,00 | 288 | 11,63 | ||||
| 2025-08-15 | 13F | Kestra Advisory Services, LLC | 5.120 | -15,41 | 438 | -5,81 | ||||
| 2025-08-11 | 13F | Regal Investment Advisors LLC | 23.086 | -5,03 | 1.975 | 5,67 | ||||
| 2025-08-12 | 13F | Steward Partners Investment Advisory, Llc | 2.894 | 0,00 | 248 | 11,26 | ||||
| 2025-08-14 | 13F | Citadel Advisors Llc | 56.516 | 29,56 | 4.836 | 44,19 | ||||
| 2025-08-19 | NP | GIPIX - Goldman Sachs Balanced Strategy Portfolio Institutional | 409.872 | -8,80 | 35.073 | 1,48 | ||||
| 2025-08-06 | 13F | Commonwealth Equity Services, Llc | 50.565 | 4,14 | 4 | 33,33 | ||||
| 2025-08-05 | 13F | Bank of New York Mellon Corp | 78.040 | -0,46 | 6.678 | 10,75 | ||||
| 2025-07-24 | 13F | Blair William & Co/il | 600 | 0,00 | 51 | 10,87 | ||||
| 2025-07-18 | 13F | Consolidated Portfolio Review Corp | 23.309 | 1.995 | ||||||
| 2025-08-12 | 13F | Global Retirement Partners, LLC | 25.560 | 6,73 | 2.187 | 13,02 | ||||
| 2025-07-30 | 13F | Syntegra Private Wealth Group, LLC | 54.486 | 57,55 | 4.662 | 75,33 | ||||
| 2025-08-11 | 13F | Principal Securities, Inc. | 1.118.621 | 10,64 | 95.720 | 17,13 | ||||
| 2025-07-31 | 13F | Cambridge Investment Research Advisors, Inc. | 4.707 | 0 | ||||||
| 2025-08-19 | 13F | National Asset Management, Inc. | 5.050 | 29,52 | 432 | 37,14 | ||||
| 2025-08-14 | 13F | Royal Bank Of Canada | 2.810 | 240 | ||||||
| 2025-05-14 | 13F | Redwood Investment Management, Llc | 0 | -100,00 | 0 | |||||
| 2025-07-28 | 13F | Axxcess Wealth Management, Llc | 0 | -100,00 | 0 | |||||
| 2025-08-14 | 13F | Bank Of America Corp /de/ | 6.295 | -92,02 | 539 | -91,13 | ||||
| 2025-08-06 | 13F | AE Wealth Management LLC | 211 | 18 | ||||||
| 2025-08-14 | 13F | Qube Research & Technologies Ltd | 494 | 42 | ||||||
| 2025-05-27 | NP | GOLDMAN SACHS VARIABLE INSURANCE TRUST - Goldman Sachs Multi-Strategy Alternatives Portfolio Institutional Shares | 19.283 | -38,85 | 1.483 | -41,86 | ||||
| 2025-08-13 | 13F | Northwestern Mutual Wealth Management Co | 271 | 0,00 | 23 | 15,00 | ||||
| 2025-08-14 | 13F | Wells Fargo & Company/mn | 758 | -64,71 | 65 | -61,21 | ||||
| 2025-08-15 | 13F | Tower Research Capital LLC (TRC) | 6.065 | 519 | ||||||
| 2025-08-14 | 13F | Two Sigma Investments, Lp | 38.800 | 3.320 | ||||||
| 2025-08-14 | 13F | Integrated Wealth Concepts LLC | 46.842 | 3,94 | 4.008 | 15,67 | ||||
| 2025-08-19 | NP | GOIIX - Goldman Sachs Growth and Income Strategy Portfolio Institutional | 1.293.285 | -5,98 | 110.666 | 4,62 | ||||
| 2025-08-08 | 13F | Cetera Investment Advisers | 625.358 | -2,44 | 53.512 | 8,55 | ||||
| 2025-08-12 | 13F | LPL Financial LLC | 5.731.534 | 4,33 | 490.447 | 16,10 | ||||
| 2025-08-14 | 13F | CoreCap Advisors, LLC | 433.894 | 1,59 | 37.128 | 13,04 | ||||
| 2025-08-14 | 13F | Stonehaven Wealth & Tax Solutions, Llc | 11.276 | -14,99 | 965 | -5,49 | ||||
| 2025-07-10 | 13F | Wealth Enhancement Advisory Services, Llc | 2.487 | -13,41 | 215 | -4,87 | ||||
| 2025-07-14 | 13F | Sowell Financial Services LLC | 11.029 | 944 | ||||||
| 2025-07-28 | 13F | Harbour Investments, Inc. | 91 | -43,83 | 8 | -41,67 | ||||
| 2025-04-09 | 13F | Merit Financial Group, LLC | 0 | -100,00 | 0 | |||||
| 2025-08-04 | 13F | Atria Investments Llc | 3.115 | -1,42 | 267 | 9,92 | ||||
| 2025-08-01 | 13F | Envestnet Asset Management Inc | 2.823.268 | 2,17 | 241.587 | 13,69 | ||||
| 2025-08-14 | 13F | Susquehanna International Group, Llp | 26.127 | -23,82 | 2.236 | -15,24 | ||||
| 2025-07-25 | 13F | Envestnet Portfolio Solutions, Inc. | 458.939 | -3,99 | 39.271 | 6,83 | ||||
| 2025-08-14 | 13F | LifePlan Investment Advisors, Inc. | 74.348 | 36,74 | 6.362 | 52,14 | ||||
| 2025-08-14 | 13F | Comerica Bank | 1.336 | 0,00 | 114 | 11,76 | ||||
| 2025-08-15 | 13F | Morgan Stanley | 1.034.901 | 2,99 | 88.557 | 14,60 | ||||
| 2025-07-18 | 13F | SMI Advisory Services, LLC | 2.683 | 0,00 | 232 | 24,86 | ||||
| 2025-07-18 | 13F | Bartlett & Co. Wealth Management Llc | 18 | 0,00 | 2 | 0,00 | ||||
| 2025-08-14 | 13F | Great Valley Advisor Group, Inc. | 5.471 | -48,57 | 468 | -42,72 | ||||
| 2025-08-19 | NP | GGSIX - Goldman Sachs Growth Strategy Portfolio Institutional | 1.855.427 | -10,34 | 158.769 | -0,23 | ||||
| 2025-07-22 | 13F | Beacon Financial Advisory LLC | 8.463 | 82,67 | 724 | 103,37 | ||||
| 2025-08-07 | 13F | Allworth Financial LP | 1.956 | 0,15 | 167 | 13,61 | ||||
| 2025-08-14 | 13F | Ameriprise Financial Inc | 6.933 | -74,80 | 593 | -71,96 | ||||
| 2025-07-15 | 13F | Optima Capital Llc | 4.790 | 0,00 | 410 | 11,14 | ||||
| 2025-08-14 | 13F | Goldman Sachs Group Inc | 17.241.688 | -7,86 | 1.475.371 | 2,53 | ||||
| 2025-07-24 | 13F | Mainstay Capital Management Llc /adv | 4.734 | 405 | ||||||
| 2025-08-14 | 13F | Fmr Llc | 3.707 | 13,99 | 317 | 26,80 | ||||
| 2025-08-13 | 13F | StoneX Group Inc. | 0 | -100,00 | 0 | -100,00 | ||||
| 2025-08-14 | 13F | Ausdal Financial Partners, Inc. | 8.567 | -0,05 | 733 | 11,23 | ||||
| 2025-07-23 | 13F | Sax Wealth Advisors, Llc | 13.666 | 1.169 | ||||||
| 2025-07-16 | 13F | Perigon Wealth Management, LLC | 13.872 | -3,35 | 1.187 | 7,62 | ||||
| 2025-07-29 | 13F | Private Trust Co Na | 2.105 | 232,54 | 180 | 275,00 | ||||
| 2025-07-18 | 13F | Lockerman Financial Group, Inc. | 3.682 | 315 | ||||||
| 2025-08-14 | 13F | UBS Group AG | 1.452 | 16.033,33 | 124 | |||||
| 2025-07-17 | 13F | Worth Financial Advisory Group, LLC | 14.124 | 14,82 | 1.209 | 27,83 | ||||
| 2025-09-04 | 13F/A | Advisor Group Holdings, Inc. | 65.074 | -21,09 | 5.569 | -12,19 | ||||
| 2025-07-21 | NP | GGMBX - Goldman Sachs Global Managed Beta Fund Institutional Shares | 13.813.165 | -0,62 | 1.126.049 | -1,07 | ||||
| 2025-08-06 | 13F | Bensler, LLC | 6.412 | 43,00 | 549 | 59,30 | ||||
| 2025-04-15 | 13F | Accurate Wealth Management, LLC | 0 | -100,00 | 0 | |||||
| 2025-08-11 | 13F | Perennial Investment Advisors, LLC | 14.643 | 2,47 | 1.253 | 14,12 | ||||
| 2025-04-14 | 13F | Farther Finance Advisors, LLC | 0 | -100,00 | 0 | |||||
| 2025-07-17 | 13F/A | Capital Investment Advisors, LLC | 3.913 | 0,00 | 335 | 11,33 | ||||
| 2025-07-25 | 13F | Cwm, Llc | 180 | -42,86 | 0 | |||||
| 2025-08-12 | 13F | Jpmorgan Chase & Co | 1.367 | -21,80 | 117 | -13,43 | ||||
| 2025-08-27 | 13F/A | Brinker Capital Investments, LLC | 39.036 | 3,58 | 3.340 | 15,25 | ||||
| 2025-08-04 | 13F | Assetmark, Inc | 76 | 7 | ||||||
| 2025-08-04 | 13F | Arkadios Wealth Advisors | 3.560 | 0,28 | 305 | 11,76 | ||||
| 2025-08-14 | 13F | Keebeck Wealth Management, LLC | 108.039 | 9.245 | ||||||
| 2025-08-13 | 13F | GeoWealth Management, LLC | 2.360 | 202 | ||||||
| 2025-07-21 | 13F | Quent Capital, LLC | 0 | -100,00 | 0 | |||||
| 2025-08-12 | 13F | Proequities, Inc. | 0 | 0 | ||||||
| 2025-08-04 | 13F | Savvy Advisors, Inc. | 2.461 | 211 | ||||||
| 2025-08-11 | 13F | Blue Bell Private Wealth Management, Llc | 19 | 0,00 | 2 | 0,00 | ||||
| 2025-08-11 | 13F | Private Advisor Group, LLC | 13.722 | -2,47 | 1.174 | 8,60 | ||||
| 2025-07-25 | 13F | Atria Wealth Solutions, Inc. | 50.297 | -58,67 | 4.304 | -54,01 | ||||
| 2025-08-15 | 13F | Equitable Holdings, Inc. | 58.796 | -31,65 | 5.031 | -23,95 | ||||
| 2025-08-14 | 13F | GWM Advisors LLC | 73.532 | 2,07 | 6.292 | 13,57 | ||||
| 2025-05-15 | 13F/A | Orion Portfolio Solutions, LLC | 37.686 | 29,96 | 2.898 | 23,69 | ||||
| 2025-08-14 | 13F | Jane Street Group, Llc | 0 | -100,00 | 0 | |||||
| 2025-08-13 | 13F | Maia Wealth LLC | 43.764 | -7,67 | 3.745 | 6,55 | ||||
| 2025-08-15 | 13F | Lantern Wealth Advisors, LLC | 7.013 | -7,50 | 600 | -1,96 | ||||
| 2025-08-12 | 13F | O'shaughnessy Asset Management, Llc | 310 | 27 | ||||||
| 2025-07-21 | 13F | Patriot Financial Group Insurance Agency, LLC | 7.025 | -6,02 | 601 | 4,70 | ||||
| 2025-08-14 | 13F | Raymond James Financial Inc | 29.891 | 4,28 | 2.558 | 16,02 |