Grundlæggende statistik
| Institutionelle ejere | 121 total, 121 long only, 0 short only, 0 long/short - change of 30,11% MRQ |
| Gennemsnitlig porteføljeallokering | 0.4742 % - change of -0,66% MRQ |
| Institutionelle aktier (lange) | 9.297.339 (ex 13D/G) - change of 2,74MM shares 41,88% MRQ |
| Institutionel værdi (lang) | $ 556.680 USD ($1000) |
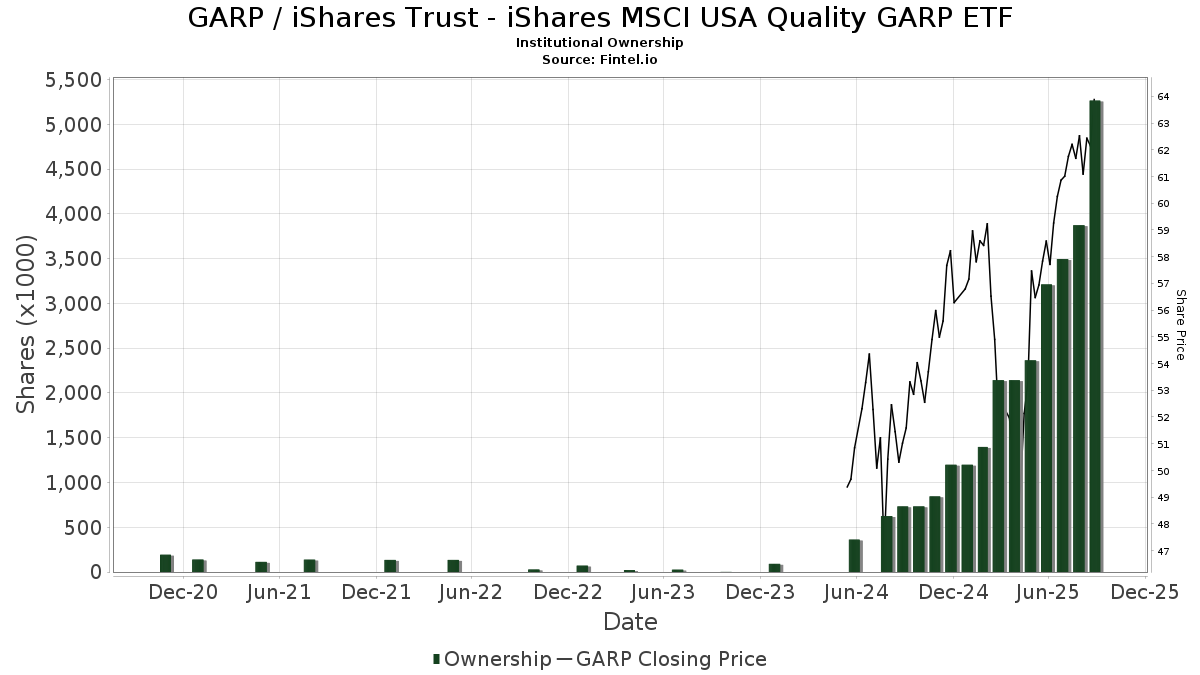
Institutionelt ejerskab og aktionærer
iShares Trust - iShares MSCI USA Quality GARP ETF (US:GARP) har 121 institutionelle ejere og aktionærer, der har indsendt 13D/G- eller 13F-formularer til Securities Exchange Commission (SEC). Disse institutioner har i alt 9,297,339 aktier. Største aktionærer omfatter LPL Financial LLC, Cambridge Investment Research Advisors, Inc., Cetera Investment Advisers, Landaas & Co /wi /adv, Raymond James Financial Inc, Bank Of America Corp /de/, Envestnet Asset Management Inc, Great Valley Advisor Group, Inc., Commonwealth Equity Services, Llc, and Park National Corp /oh/ .
iShares Trust - iShares MSCI USA Quality GARP ETF (BATS:GARP) institutionel ejerskabsstruktur viser aktuelle positioner i virksomheden efter institutioner og fonde, samt seneste ændringer i positionsstørrelse. Større aktionærer kan omfatte individuelle investorer, investeringsforeninger, hedgefonde eller institutioner. Skema 13D angiver, at investoren besidder (eller besidder) mere end 5 % af virksomheden og har til hensigt (eller har til hensigt at) aktivt at forfølge en ændring i forretningsstrategi. Skema 13G indikerer en passiv investering på over 5%.
The share price as of March 6, 2026 is 66,39 / share. Previously, on March 10, 2025, the share price was 51,44 / share. This represents an increase of 29,06% over that period.
Fondens stemningsscore
Fund Sentiment Score (fka Ownership Accumulation Score) finder de aktier, der bliver mest købt af fonde. Det er resultatet af en sofistikeret, multi-faktor kvantitativ model, der identificerer virksomheder med de højeste niveauer af institutionel akkumulering. Scoringsmodellen bruger en kombination af den samlede stigning i oplyste ejere, ændringerne i porteføljeallokeringer i disse ejere og andre målinger. Tallet går fra 0 til 100, hvor højere tal indikerer et højere niveau af akkumulering for sine jævnaldrende, og 50 er gennemsnittet.
Opdateringsfrekvens: Dagligt
Se Ownership Explorer, som giver en liste over højest rangerende virksomheder.
AI+ Ask Fintel’s AI assistant about iShares Trust - iShares MSCI USA Quality GARP ETF.
Select a question to share a public post with an AI-crafted answer.
Thinking of good questions…
Institutionel Put/Call-forhold
Ud over at indberette standardaktie- og gældsudstedelser skal institutter med mere end 100 mill. aktiver under forvaltning også oplyse deres put- og call-optionsbeholdninger. Da salgsoptioner generelt indikerer negativ stemning, og købsoptioner indikerer positiv stemning, kan vi få en fornemmelse af den overordnede institutionelle stemning ved at plotte forholdet mellem put og kald. Diagrammet til højre viser det historiske put/call-forhold for dette instrument.
Brug af Put/Call Ratio som en indikator for investorernes stemning overvinder en af de vigtigste mangler ved at bruge totalt institutionelt ejerskab, som er, at en betydelig mængde af aktiver under forvaltning investeres passivt for at spore indekser. Passivt forvaltede fonde køber typisk ikke optioner, så indikatoren for put/call-forholdet følger mere nøje følelsen af aktivt forvaltede fonde.
13F og NPORT arkivering
Detaljer om 13F-arkivering er gratis. Detaljer om NP-ansøgninger kræver et premium-medlemskab. Grønne rækker angiver nye positioner. Røde rækker angiver lukkede positioner. Klik på linket ikon for at se den fulde transaktionshistorik.
Opgrader
for at låse premium-data op og eksportere til Excel ![]() .
.
| Fil dato | Kilde | Investor | Type | Gennemsnitlig pris (Øst) |
Aktier | Δ Aktier (%) |
Rapporteret Værdi ($1000) |
Δ Værdi (%) |
Port Alloc (%) |
|
|---|---|---|---|---|---|---|---|---|---|---|
| 2026-01-08 | 13F | Wealth Enhancement Advisory Services, Llc | 6.336 | 63,30 | 445 | 72,76 | ||||
| 2026-01-22 | 13F | Vista Investment Partners Ii, Llc | 0 | -100,00 | 0 | |||||
| 2026-02-11 | 13F | LPL Financial LLC | 1.315.966 | 29,51 | 89.617 | 34,36 | ||||
| 2026-02-10 | 13F | Calton & Associates, Inc. | 27.747 | 37,85 | 1.890 | 43,00 | ||||
| 2026-02-17 | 13F | Susquehanna International Group, Llp | 6.935 | 472 | ||||||
| 2026-01-14 | 13F | Nova Wealth Management, Inc. | 7.771 | -6,60 | 529 | -3,11 | ||||
| 2025-11-07 | 13F | Atticus Wealth Management, Llc | 0 | -100,00 | 0 | |||||
| 2026-01-28 | 13F | Fischer Investment Strategies, Llc | 7.425 | 506 | ||||||
| 2026-02-06 | 13F | Csenge Advisory Group | 4.935 | 0,00 | 336 | 4,02 | ||||
| 2026-02-13 | 13F | Kane Investment Management, Inc. | 6.267 | 3,31 | 427 | 7,04 | ||||
| 2026-02-12 | 13F | Principal Securities, Inc. | 99.458 | 16,80 | 6.773 | 21,18 | ||||
| 2026-01-23 | 13F | Gilbert Capital Group, Inc. | 40.666 | 2.769 | ||||||
| 2026-02-13 | 13F | Kestra Advisory Services, LLC | 0 | -100,00 | 0 | |||||
| 2026-01-13 | 13F | Synergy Financial Management, LLC | 0 | -100,00 | 0 | -100,00 | ||||
| 2026-02-09 | 13F | Kingsview Wealth Management, LLC | 7.447 | -4,76 | 507 | -1,17 | ||||
| 2026-01-13 | 13F | LongView Wealth Management | 23.793 | 25,54 | 1.669 | 34,16 | ||||
| 2026-02-09 | 13F | Arq Wealth Advisors, Llc | 223.117 | 6,97 | 15.194 | 10,98 | ||||
| 2026-01-07 | 13F | Stonebridge Wealth Management, LLC | 29.889 | -13,77 | 2.035 | -10,55 | ||||
| 2026-01-23 | 13F | Optima Capital Llc | 58.935 | 4.013 | ||||||
| 2026-01-23 | 13F | Assetmark, Inc | 618 | 42 | ||||||
| 2026-02-17 | 13F | Raymond James Financial Inc | 437.642 | 144,25 | 29.803 | 153,41 | ||||
| 2026-01-26 | 13F | Nations Financial Group Inc, /ia/ /adv | 20.377 | 115,58 | 1.388 | 123,71 | ||||
| 2026-01-26 | 13F | Merit Financial Group, LLC | 55.718 | 3.794 | ||||||
| 2026-02-11 | 13F | Comprehensive Financial Planning, Inc./PA | 1.816 | 124 | ||||||
| 2026-02-06 | 13F | Global Retirement Partners, LLC | 3.163 | 13,94 | 215 | 18,13 | ||||
| 2026-02-13 | 13F | Stifel Financial Corp | 205.800 | -9,29 | 14.015 | -5,89 | ||||
| 2025-10-07 | 13F | EWG Elevate Inc. | 23.426 | -3,39 | 1.538 | 4,99 | ||||
| 2026-02-10 | 13F | Foundations Investment Advisors, LLC | 19.596 | 4,45 | 1.334 | 8,37 | ||||
| 2026-01-30 | 13F | Sigma Planning Corp | 0 | -100,00 | 0 | |||||
| 2026-01-28 | 13F | Planned Solutions, Inc. | 235.258 | 1,94 | 16.021 | 5,76 | ||||
| 2026-01-20 | 13F | Stratos Wealth Advisors, LLC | 10.378 | 707 | ||||||
| 2026-02-17 | 13F | Tower Research Capital LLC (TRC) | 0 | -100,00 | 0 | |||||
| 2026-01-15 | 13F | Saxony Capital Management, LLC | 12.663 | 100,78 | 862 | 108,72 | ||||
| 2026-01-30 | 13F | Bogart Wealth, LLC | 1.200 | 0,00 | 82 | 3,85 | ||||
| 2026-01-23 | 13F | Avion Wealth | 34 | 0 | ||||||
| 2026-03-02 | 13F | Sankala Group LLC | 561 | 38 | ||||||
| 2026-02-05 | 13F | Disciplined Investments, LLC | 16.766 | 0,00 | 1.142 | 3,73 | ||||
| 2026-02-13 | 13F | Mml Investors Services, Llc | 248.106 | 345,86 | 16.896 | 362,62 | ||||
| 2026-01-27 | 13F | Ring Mountain Capital, LLC | 3.214 | 0,22 | 0 | |||||
| 2026-02-17 | 13F | LaSalle St. Investment Advisors, LLC | 21.892 | 20,96 | 1 | 0,00 | ||||
| 2026-02-10 | 13F | Marshall & Sterling Wealth Advisors Inc. | 67.468 | 1,41 | 4.595 | 5,32 | ||||
| 2026-02-04 | 13F | D'Orazio & Associates, Inc. | 152.367 | 14,97 | 10.376 | 19,29 | ||||
| 2026-02-06 | 13F | Cedar Wealth Management, LLC | 24.408 | 148,93 | 1.662 | 158,48 | ||||
| 2026-02-11 | 13F | Janney Montgomery Scott LLC | 4.125 | 0 | ||||||
| 2026-01-12 | 13F | Archer Investment Management, LLC | 8.767 | 597 | ||||||
| 2026-02-17 | 13F | Royal Bank Of Canada | 241 | -96,99 | 16 | -96,95 | ||||
| 2026-01-23 | 13F | Valley National Advisers Inc | 230.248 | 5,31 | 16 | 7,14 | ||||
| 2026-02-06 | 13F | Larson Financial Group LLC | 1.434 | -4,91 | 98 | -2,02 | ||||
| 2026-02-02 | 13F | Fifth Third Bancorp | 78 | 5 | ||||||
| 2026-02-12 | 13F | Jane Street Group, Llc | 0 | -100,00 | 0 | |||||
| 2026-02-19 | 13F | CI Private Wealth, LLC | 6.000 | 409 | ||||||
| 2026-02-13 | 13F | B&D White Capital Company, LLC | 203.048 | 0,76 | 13.828 | 4,54 | ||||
| 2026-02-04 | 13F | Win Advisors, Inc | 48.301 | 3.289 | ||||||
| 2026-02-12 | 13F | Great Valley Advisor Group, Inc. | 329.905 | 1.027,65 | 22.467 | 1.070,10 | ||||
| 2026-02-09 | 13F | Harbour Investments, Inc. | 6.535 | -21,17 | 445 | -18,20 | ||||
| 2026-01-15 | 13F | Trust Co | 51 | 3 | ||||||
| 2026-02-17 | 13F | Advisory Services Network, LLC | 0 | -100,00 | 0 | |||||
| 2026-02-02 | 13F | Truist Financial Corp | 50.958 | 3,75 | 3.470 | 7,63 | ||||
| 2026-02-17 | 13F | Bank Of America Corp /de/ | 359.262 | 9,44 | 24.466 | 13,54 | ||||
| 2026-01-30 | 13F | Wagner Wealth Management, Llc | 2.288 | 0,00 | 156 | 3,33 | ||||
| 2026-02-09 | 13F | Leavell Investment Management, Inc. | 20.677 | 23,05 | 1.408 | 27,65 | ||||
| 2026-02-23 | 13F | Sonoma Allocations LLC | 16.349 | 20,92 | 1.145 | 28,54 | ||||
| 2026-02-19 | 13F | Atomi Financial Group, Inc. | 6.940 | 473 | ||||||
| 2026-02-11 | 13F | Flagship Wealth Advisors, Llc | 7.500 | 0,00 | 511 | 3,66 | ||||
| 2026-02-12 | 13F | Financial Network Wealth Management LLC | 147.659 | 1,87 | 10 | 11,11 | ||||
| 2026-01-26 | 13F | Cwm, Llc | 661 | 6,27 | 0 | |||||
| 2026-02-11 | 13F | Gwn Securities Inc. | 5.520 | -1,74 | 376 | 1,63 | ||||
| 2026-02-17 | 13F | Two Sigma Securities, Llc | 7.875 | 536 | ||||||
| 2026-02-11 | 13F | Jpmorgan Chase & Co | 4.327 | 102,39 | 295 | 110,00 | ||||
| 2026-02-18 | 13F | GWM Advisors LLC | 2.446 | 80,78 | 167 | 88,64 | ||||
| 2026-02-05 | 13F | High Note Wealth, LLC | 1.126 | 77 | ||||||
| 2026-02-10 | 13F | Root Financial Partners, LLC | 0 | -100,00 | 0 | |||||
| 2026-02-06 | 13F | HighTower Advisors, LLC | 158.448 | -2,00 | 10.790 | 1,68 | ||||
| 2026-01-28 | 13F | Key Client Fiduciary Advisors, LLC | 3.725 | 254 | ||||||
| 2026-02-10 | 13F | Envestnet Asset Management Inc | 340.758 | 136,00 | 23.206 | 144,86 | ||||
| 2026-01-29 | 13F | UBS Group AG | 2.238 | 80,19 | 152 | 87,65 | ||||
| 2026-02-10 | 13F/A | Northwestern Mutual Wealth Management Co | 168.198 | 139,87 | 11.454 | 148,89 | ||||
| 2026-02-11 | 13F | Wealthgarden F.s. Llc | 0 | -100,00 | 0 | |||||
| 2026-02-05 | 13F | Cambridge Investment Research Advisors, Inc. | 529.616 | 7,97 | 36 | 12,50 | ||||
| 2026-02-10 | 13F | Gw Henssler & Associates Ltd | 60.038 | 4.089 | ||||||
| 2026-02-13 | 13F | Aptus Capital Advisors, LLC | 44 | 3 | ||||||
| 2026-01-22 | 13F | Glass Jacobson Investment Advisors llc | 159 | 0,00 | 11 | 0,00 | ||||
| 2026-02-10 | 13F | CIBC World Markets Inc. | 10.270 | -5,14 | 699 | -1,55 | ||||
| 2026-02-12 | 13F | Steward Partners Investment Advisory, Llc | 500 | -95,01 | 34 | -94,83 | ||||
| 2026-02-13 | 13F | Wells Fargo & Company/mn | 1.665 | 33,63 | 113 | 39,51 | ||||
| 2026-01-23 | 13F | Farther Finance Advisors, LLC | 75 | 5 | ||||||
| 2026-02-02 | 13F | Holistic Planning, LLC | 25.203 | 1.716 | ||||||
| 2026-02-06 | 13F | GPS Wealth Strategies Group, LLC | 0 | -100,00 | 0 | |||||
| 2026-01-12 | 13F | Certified Advisory Corp | 35.745 | 2.434 | ||||||
| 2026-01-29 | 13F | Concord Wealth Partners | 17 | 0,00 | 1 | 0,00 | ||||
| 2026-01-05 | 13F | Park National Corp /oh/ | 295.367 | 1,15 | 20.114 | 4,94 | ||||
| 2026-02-19 | 13F | Mcguire Capital Advisors Inc | 10 | 1 | ||||||
| 2026-02-11 | 13F | Capital Analysts, Inc. | 158.511 | 11 | ||||||
| 2026-02-10 | 13F | Thoroughbred Financial Services, Llc | 19.849 | 5,63 | 1 | 0,00 | ||||
| 2026-01-26 | 13F | JNBA Financial Advisors | 16 | 1 | ||||||
| 2026-02-13 | 13F | First Trust Advisors Lp | 77.430 | 1,75 | 5.273 | 5,55 | ||||
| 2026-02-17 | 13F | Fmr Llc | 1.849 | 14,56 | 126 | 19,05 | ||||
| 2026-02-11 | 13F | Buckingham Strategic Partners | 4.043 | 275 | ||||||
| 2026-02-13 | 13F | Golden State Wealth Management, LLC | 11.050 | 9,43 | 753 | 13,60 | ||||
| 2026-01-09 | 13F | Dynamic Advisor Solutions LLC | 18.764 | 0,15 | 1.278 | 3,91 | ||||
| 2026-01-21 | 13F | Landaas & Co /wi /adv | 443.970 | 3,74 | 30.236 | 7,62 | ||||
| 2026-02-09 | 13F | Keating Financial Advisory Services, Inc. | 14.303 | 974 | ||||||
| 2025-11-10 | 13F | Signature Securities Group Corporation | 0 | -100,00 | 0 | |||||
| 2026-02-12 | 13F | Commonwealth Equity Services, Llc | 296.793 | -8,41 | 20.212 | 96.142,86 | ||||
| 2026-02-17 | 13F | Cetera Investment Advisers | 488.804 | 6,08 | 33.288 | 10,05 | ||||
| 2026-02-17 | 13F | Creative Planning | 5.761 | 0,10 | 392 | 3,98 | ||||
| 2026-01-21 | 13F | Newbridge Financial Services Group, Inc. | 18 | 0,00 | 1 | 0,00 | ||||
| 2026-01-14 | 13F | Keystone Global Partners, LLC | 85.805 | 5.843 | ||||||
| 2026-02-05 | 13F | WJ Wealth Management, LLC | 56.263 | -1,15 | 3.832 | -2,22 | ||||
| 2026-01-14 | 13F | Spire Wealth Management | 11.816 | 2,19 | 805 | 6,07 | ||||
| 2026-01-29 | 13F | Kestra Private Wealth Services, Llc | 62.392 | 3,60 | 4.249 | 7,46 | ||||
| 2026-02-10 | 13F | Adapt Wealth Advisors, Llc | 18.959 | 21,86 | 1.291 | 26,44 | ||||
| 2026-02-13 | 13F | Flow Traders U.s. Llc | 8.072 | 1 | ||||||
| 2025-11-14 | 13F | Citadel Advisors Llc | 0 | -100,00 | 0 | |||||
| 2026-02-12 | 13F | Bank Of Montreal /can/ | 973 | 180,40 | 66 | 200,00 | ||||
| 2026-02-13 | 13F | Integrated Wealth Concepts LLC | 0 | -100,00 | 0 | |||||
| 2025-11-14 | 13F | Mount Yale Investment Advisors, LLC | 0 | -100,00 | 0 | -100,00 | ||||
| 2026-01-29 | 13F | Comerica Bank | 109 | 7 | ||||||
| 2026-02-13 | 13F | Morgan Stanley | 266.021 | 26.602.000,00 | 18.116 | |||||
| 2026-02-26 | 13F | TD Capital Management LLC | 340 | 0,00 | 23 | 4,55 | ||||
| 2026-02-05 | 13F | Allworth Financial LP | 488 | 33 | ||||||
| 2026-01-05 | 13F | Garrett Investment Advisors LLC | 86.919 | 23,87 | 5.919 | 28,53 | ||||
| 2026-02-09 | 13F | Prospera Financial Services Inc | 4.127 | 281 | ||||||
| 2026-01-09 | 13F | Breakwater Capital Group | 9.122 | 621 | ||||||
| 2026-02-13 | 13F | Itau Unibanco Holding S.A. | 0 | -100,00 | 0 | -100,00 | ||||
| 2026-01-26 | 13F | Milestones Private Investment Advisors LLC | 58.042 | -7,37 | 3.953 | -3,91 | ||||
| 2026-01-21 | 13F | Lakeshore Capital Group, Inc. | 105.324 | 3,57 | 7.173 | 7,46 | ||||
| 2026-02-17 | 13F | Trexquant Investment LP | 3.103 | 211 | ||||||
| 2026-02-17 | 13F | Advisor Group Holdings, Inc. | 187.534 | 19,85 | 12.771 | 30,31 | ||||
| 2026-02-17 | 13F | Aqr Capital Management Llc | 4.487 | 306 | ||||||
| 2026-02-17 | 13F | Equitable Holdings, Inc. | 39.452 | 47,75 | 2.687 | 53,31 | ||||
| 2026-01-29 | 13F | D.a. Davidson & Co. | 3.870 | -2,03 | 264 | 1,54 | ||||
| 2026-02-10 | 13F | Goldman Sachs Group Inc | 187.223 | 2.984,91 | 12.750 | 3.103,27 | ||||
| 2026-02-10 | 13F | Bank of New York Mellon Corp | 5.930 | 404 | ||||||
| 2026-02-10 | 13F | Keyvantage Wealth, Llc | 8.997 | -6,37 | 613 | -2,86 | ||||
| 2026-02-12 | 13F | Rossby Financial, LCC | 12 | 0,00 | 1 | |||||
| 2026-01-08 | 13F | MKT Advisors LLC | 7.243 | 501 |