Grundlæggende statistik
| Institutionelle ejere | 98 total, 98 long only, 0 short only, 0 long/short - change of 3,09% MRQ |
| Gennemsnitlig porteføljeallokering | 0.0802 % - change of 1,27% MRQ |
| Institutionelle aktier (lange) | 4.786.203 (ex 13D/G) - change of -0,38MM shares -7,32% MRQ |
| Institutionel værdi (lang) | $ 146.269 USD ($1000) |
Institutionelt ejerskab og aktionærer
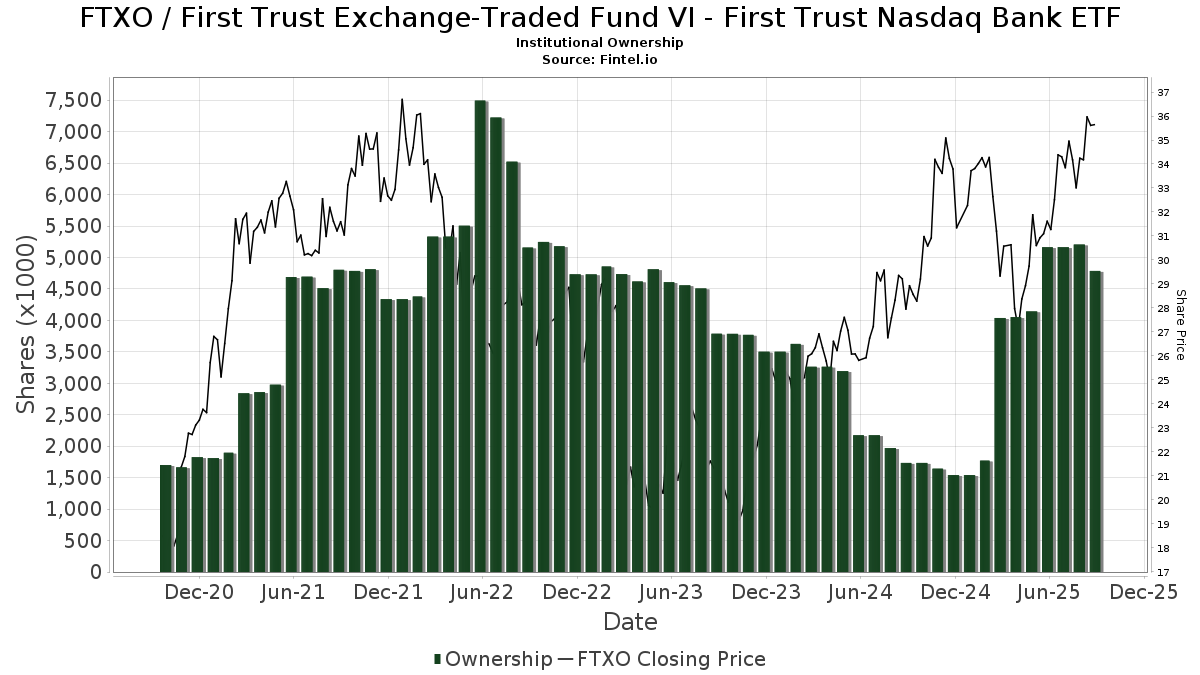
First Trust Exchange-Traded Fund VI - First Trust Nasdaq Bank ETF (US:FTXO) har 98 institutionelle ejere og aktionærer, der har indsendt 13D/G- eller 13F-formularer til Securities Exchange Commission (SEC). Disse institutioner har i alt 4,786,203 aktier. Største aktionærer omfatter LPL Financial LLC, Morgan Stanley, Envestnet Asset Management Inc, Wells Fargo & Company/mn, UBS Group AG, TradeWell Securities, LLC., Wagner Wealth Management, Llc, Royal Bank Of Canada, Raymond James Financial Inc, and Bank Of America Corp /de/ .
First Trust Exchange-Traded Fund VI - First Trust Nasdaq Bank ETF (NasdaqGM:FTXO) institutionel ejerskabsstruktur viser aktuelle positioner i virksomheden efter institutioner og fonde, samt seneste ændringer i positionsstørrelse. Større aktionærer kan omfatte individuelle investorer, investeringsforeninger, hedgefonde eller institutioner. Skema 13D angiver, at investoren besidder (eller besidder) mere end 5 % af virksomheden og har til hensigt (eller har til hensigt at) aktivt at forfølge en ændring i forretningsstrategi. Skema 13G indikerer en passiv investering på over 5%.
The share price as of September 12, 2025 is 35,92 / share. Previously, on September 16, 2024, the share price was 28,63 / share. This represents an increase of 25,45% over that period.
Fondens stemningsscore
Fund Sentiment Score (fka Ownership Accumulation Score) finder de aktier, der bliver mest købt af fonde. Det er resultatet af en sofistikeret, multi-faktor kvantitativ model, der identificerer virksomheder med de højeste niveauer af institutionel akkumulering. Scoringsmodellen bruger en kombination af den samlede stigning i oplyste ejere, ændringerne i porteføljeallokeringer i disse ejere og andre målinger. Tallet går fra 0 til 100, hvor højere tal indikerer et højere niveau af akkumulering for sine jævnaldrende, og 50 er gennemsnittet.
Opdateringsfrekvens: Dagligt
Se Ownership Explorer, som giver en liste over højest rangerende virksomheder.
Institutionel Put/Call-forhold
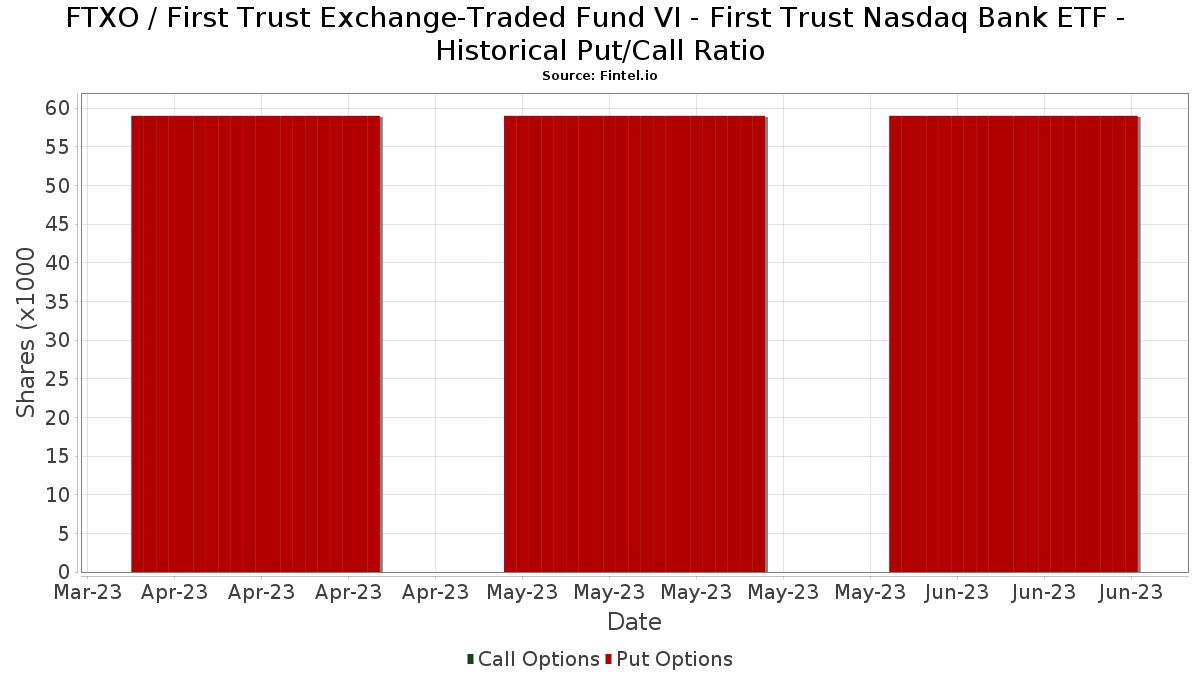
Ud over at indberette standardaktie- og gældsudstedelser skal institutter med mere end 100 mill. aktiver under forvaltning også oplyse deres put- og call-optionsbeholdninger. Da salgsoptioner generelt indikerer negativ stemning, og købsoptioner indikerer positiv stemning, kan vi få en fornemmelse af den overordnede institutionelle stemning ved at plotte forholdet mellem put og kald. Diagrammet til højre viser det historiske put/call-forhold for dette instrument.
Brug af Put/Call Ratio som en indikator for investorernes stemning overvinder en af de vigtigste mangler ved at bruge totalt institutionelt ejerskab, som er, at en betydelig mængde af aktiver under forvaltning investeres passivt for at spore indekser. Passivt forvaltede fonde køber typisk ikke optioner, så indikatoren for put/call-forholdet følger mere nøje følelsen af aktivt forvaltede fonde.
13F og NPORT arkivering
Detaljer om 13F-arkivering er gratis. Detaljer om NP-ansøgninger kræver et premium-medlemskab. Grønne rækker angiver nye positioner. Røde rækker angiver lukkede positioner. Klik på linket ikon for at se den fulde transaktionshistorik.
Opgrader
for at låse premium-data op og eksportere til Excel ![]() .
.
| Fil dato | Kilde | Investor | Type | Gennemsnitlig pris (Øst) |
Aktier | Δ Aktier (%) |
Rapporteret Værdi ($1000) |
Δ Værdi (%) |
Port Alloc (%) |
|
|---|---|---|---|---|---|---|---|---|---|---|
| 2025-08-15 | 13F | Morgan Stanley | 611.211 | -33,12 | 20.188 | -27,33 | ||||
| 2025-08-11 | 13F | Principal Securities, Inc. | 5.016 | 12,92 | 166 | 17,02 | ||||
| 2025-08-13 | 13F | Transce3nd, LLC | 89 | 0,00 | 3 | 0,00 | ||||
| 2025-08-08 | 13F | Hartland & Co., LLC | 3.077 | 102 | ||||||
| 2025-07-17 | 13F | Wagner Wealth Management, Llc | 166.630 | 4,98 | 5.504 | 14,05 | ||||
| 2025-07-31 | 13F | Cambridge Investment Research Advisors, Inc. | 112.216 | 29,49 | 4 | 50,00 | ||||
| 2025-08-12 | 13F | LPL Financial LLC | 617.552 | 17,27 | 20.398 | 27,42 | ||||
| 2025-08-27 | 13F/A | Brinker Capital Investments, LLC | 26.115 | -1,17 | 863 | 7,35 | ||||
| 2025-07-31 | 13F | Topsail Wealth Management, LLC | 400 | -33,33 | 13 | -27,78 | ||||
| 2025-08-11 | 13F | Citigroup Inc | 700 | 23 | ||||||
| 2025-08-04 | 13F | Creative Financial Designs Inc /adv | 3.613 | 6,14 | 119 | 15,53 | ||||
| 2025-05-15 | 13F/A | Orion Portfolio Solutions, LLC | 26.424 | 0,48 | 803 | -3,95 | ||||
| 2025-08-06 | 13F | Commonwealth Equity Services, Llc | 19.719 | 16,72 | 1 | |||||
| 2025-08-13 | 13F | Virtue Capital Management, LLC | 0 | -100,00 | 0 | |||||
| 2025-05-14 | 13F | Bnp Paribas Arbitrage, Sa | 0 | -100,00 | 0 | |||||
| 2025-08-14 | 13F | Citadel Advisors Llc | 13.443 | 444 | ||||||
| 2025-07-08 | 13F | Nbc Securities, Inc. | 1.334 | -4,58 | 0 | |||||
| 2025-08-13 | 13F | Icapital Wealth Llc | 7.361 | 0,00 | 243 | 8,97 | ||||
| 2025-08-14 | 13F | Sherman Asset Management, Inc. | 870 | 0,00 | 29 | 7,69 | ||||
| 2025-07-28 | 13F | RFG Advisory, LLC | 7.359 | 2,12 | 243 | 10,96 | ||||
| 2025-08-12 | 13F | CIBC Private Wealth Group, LLC | 53 | 2 | ||||||
| 2025-08-12 | 13F | Proequities, Inc. | 0 | 0 | ||||||
| 2025-07-08 | 13F | Arlington Trust Co LLC | 0 | -100,00 | 0 | |||||
| 2025-08-12 | 13F | OneAscent Financial Services LLC | 23.477 | 7,47 | 1 | |||||
| 2025-08-14 | 13F | Guardian Wealth Advisors, Llc / Nc | 40 | 0,00 | 1 | 0,00 | ||||
| 2025-08-07 | 13F | Private Advisory Group LLC | 0 | -100,00 | 0 | |||||
| 2025-07-25 | 13F | Atria Wealth Solutions, Inc. | 12.332 | -22,98 | 407 | -16,26 | ||||
| 2025-07-31 | 13F | Nilsine Partners, LLC | 38.540 | 1,24 | 1.273 | 9,94 | ||||
| 2025-08-14 | 13F | Royal Bank Of Canada | 162.608 | -25,59 | 5.371 | -19,15 | ||||
| 2025-08-01 | 13F | Envestnet Asset Management Inc | 360.429 | 0,90 | 11.905 | 9,62 | ||||
| 2025-08-14 | 13F | UBS Group AG | 239.481 | -15,61 | 7.910 | -8,31 | ||||
| 2025-08-13 | 13F/A | StoneX Group Inc. | 7.283 | -50,81 | 212 | -46,17 | ||||
| 2025-08-06 | 13F | Prospera Financial Services Inc | 51.896 | 0,07 | 1.714 | 8,76 | ||||
| 2025-08-04 | 13F | Pensionmark Financial Group, Llc | 37.450 | 19,62 | 1.237 | 29,97 | ||||
| 2025-04-28 | 13F | DAVENPORT & Co LLC | 0 | -100,00 | 0 | |||||
| 2025-08-04 | 13F | Spire Wealth Management | 50 | 0,00 | 2 | 0,00 | ||||
| 2025-08-14 | 13F | Wells Fargo & Company/mn | 277.505 | -19,66 | 9.166 | -12,70 | ||||
| 2025-07-17 | 13F | Janney Montgomery Scott LLC | 107.053 | -7,71 | 4 | 0,00 | ||||
| 2025-08-14 | 13F | Comerica Bank | 962 | 4,34 | 32 | 10,71 | ||||
| 2025-08-14 | 13F | Raymond James Financial Inc | 162.326 | -34,33 | 5.362 | -28,64 | ||||
| 2025-08-13 | 13F | Continuum Advisory, LLC | 0 | -100,00 | 0 | |||||
| 2025-08-14 | 13F | Susquehanna International Group, Llp | 9.579 | -82,80 | 316 | -81,33 | ||||
| 2025-08-12 | 13F | SRS Capital Advisors, Inc. | 100 | 0,00 | 3 | 0,00 | ||||
| 2025-05-09 | 13F | CoreCap Advisors, LLC | 0 | -100,00 | 0 | |||||
| 2025-08-06 | 13F | RFG - Bristol Wealth Advisors, LLC | 0 | -100,00 | 0 | |||||
| 2025-08-15 | 13F | Tower Research Capital LLC (TRC) | 13.397 | 602,52 | 443 | 675,44 | ||||
| 2025-09-04 | 13F/A | Advisor Group Holdings, Inc. | 38.805 | 8,96 | 1.267 | 17,10 | ||||
| 2025-07-24 | 13F | IFP Advisors, Inc | 39.926 | -2,30 | 1.319 | 6,12 | ||||
| 2025-07-28 | 13F | BRYN MAWR TRUST Co | 207 | 0,00 | 7 | 0,00 | ||||
| 2025-08-11 | 13F | NewEdge Wealth, LLC | 18.772 | -2,33 | 614 | 4,97 | ||||
| 2025-08-11 | 13F | Aptus Capital Advisors, LLC | 40 | 0,00 | 1 | 0,00 | ||||
| 2025-07-02 | 13F | HBW Advisory Services LLC | 7.888 | 5,72 | 261 | 15,04 | ||||
| 2025-08-08 | 13F | Avantax Advisory Services, Inc. | 15.563 | 514 | ||||||
| 2025-08-18 | 13F | Geneos Wealth Management Inc. | 1.212 | 0,00 | 40 | 11,11 | ||||
| 2025-07-18 | 13F | Truist Financial Corp | 106.834 | 0,05 | 3.529 | 8,72 | ||||
| 2025-07-30 | 13F | BlueChip Wealth Advisors LLC | 6.764 | 0,00 | 223 | 8,78 | ||||
| 2025-08-05 | 13F | Bank of New York Mellon Corp | 36.500 | -1,68 | 1.206 | 6,83 | ||||
| 2025-08-14 | 13F | Goldman Sachs Group Inc | 22.821 | 13,54 | 754 | 23,24 | ||||
| 2025-08-07 | 13F | Resources Investment Advisors, LLC. | 0 | -100,00 | 0 | |||||
| 2025-08-14 | 13F | Fmr Llc | 55 | 0,00 | 2 | 0,00 | ||||
| 2025-05-02 | 13F | Capital A Wealth Management, LLC | 0 | -100,00 | 0 | |||||
| 2025-08-12 | 13F | Steward Partners Investment Advisory, Llc | 1.378 | 135,96 | 46 | 164,71 | ||||
| 2025-08-12 | 13F | MAI Capital Management | 460 | 0,00 | 15 | 15,38 | ||||
| 2025-08-13 | 13F | Gateway Wealth Partners, LLC | 28.750 | -2,66 | 950 | 5,80 | ||||
| 2025-08-20 | 13F/A | Coppell Advisory Solutions LLC | 19.000 | -44,01 | 624 | -36,97 | ||||
| 2025-08-15 | 13F | Equitable Holdings, Inc. | 13.121 | -12,05 | 433 | -4,42 | ||||
| 2025-07-21 | 13F | Ameritas Advisory Services, LLC | 184 | 6 | ||||||
| 2025-08-06 | 13F | AE Wealth Management LLC | 35.922 | -19,61 | 1.187 | -12,67 | ||||
| 2025-08-13 | 13F | Flow Traders U.s. Llc | 60.055 | 2 | ||||||
| 2025-08-14 | 13F | Stifel Financial Corp | 25.761 | -13,68 | 851 | -6,28 | ||||
| 2025-07-16 | 13F | American National Bank | 94 | 0,00 | 3 | 50,00 | ||||
| 2025-07-28 | 13F | Harbour Investments, Inc. | 10.762 | 4,78 | 355 | 13,78 | ||||
| 2025-07-23 | 13F | Element Wealth, LLC | 21.905 | 724 | ||||||
| 2025-08-14 | 13F | Transamerica Financial Advisors, Inc. | 152 | 0,00 | 5 | |||||
| 2025-05-16 | 13F/A | Kestra Investment Management, LLC | 0 | -100,00 | 0 | |||||
| 2025-08-14 | 13F | Pinnacle Family Advisors, LLC | 6.605 | 218 | ||||||
| 2025-08-14 | 13F | Mpwm Advisory Solutions, Llc | 0 | 0 | ||||||
| 2025-07-24 | 13F | Us Bancorp \de\ | 6.396 | 211 | ||||||
| 2025-07-15 | 13F | FLP Wealth Management, LLC | 0 | -100,00 | 0 | |||||
| 2025-08-15 | 13F | Puff Wealth Management, Llc | 28.465 | -11,46 | 940 | -3,79 | ||||
| 2025-07-14 | 13F | AdvisorNet Financial, Inc | 158 | 37,39 | 5 | 66,67 | ||||
| 2025-08-04 | 13F | Assetmark, Inc | 141.526 | 21,95 | 4.675 | 32,52 | ||||
| 2025-07-15 | 13F | Traction Financial Partners, LLC | 6.663 | 220 | ||||||
| 2025-04-30 | 13F | TradeWell Securities, LLC. | 218.597 | -3,22 | 6.645 | -7,50 | ||||
| 2025-08-06 | 13F | First Horizon Advisors, Inc. | 676 | 0,00 | 22 | 10,00 | ||||
| 2025-08-11 | 13F | Synergy Investment Management, LLC | 0 | -100,00 | 0 | |||||
| 2025-08-14 | 13F | Benjamin Edwards Inc | 45.491 | 21,57 | 1.503 | 32,10 | ||||
| 2025-07-07 | 13F | Thurston, Springer, Miller, Herd & Titak, Inc. | 1.065 | -21,98 | 35 | -14,63 | ||||
| 2025-08-14 | 13F | GWM Advisors LLC | 23.915 | 13,48 | 790 | 23,28 | ||||
| 2025-08-05 | 13F | Sigma Planning Corp | 0 | -100,00 | 0 | |||||
| 2025-07-29 | 13F | International Assets Investment Management, Llc | 9.688 | -0,41 | 320 | 8,14 | ||||
| 2025-08-05 | 13F | EPG Wealth Management LLC | 0 | -100,00 | 0 | -100,00 | ||||
| 2025-08-14 | 13F | Bank Of America Corp /de/ | 158.051 | -27,80 | 5.220 | -21,55 | ||||
| 2025-08-14 | 13F | Snowden Capital Advisors LLC | 32.942 | -6,42 | 1.088 | 1,68 | ||||
| 2025-07-10 | 13F | Wealth Enhancement Advisory Services, Llc | 11.781 | -12,60 | 409 | 0,00 | ||||
| 2025-08-07 | 13F | PFG Advisors | 65.703 | 22,56 | 2.170 | 33,21 | ||||
| 2025-07-25 | 13F | Cwm, Llc | 439 | 36,34 | 0 | |||||
| 2025-08-08 | 13F | Cetera Investment Advisers | 148.399 | 11,94 | 4.902 | 21,61 | ||||
| 2025-07-25 | 13F | Envestnet Portfolio Solutions, Inc. | 17.003 | -32,69 | 562 | -26,86 | ||||
| 2025-05-14 | 13F | Huntington National Bank | 2 | 0,00 | ||||||
| 2025-08-05 | 13F | Key FInancial Inc | 82 | 0,00 | 3 | 0,00 | ||||
| 2025-08-14 | 13F | Mml Investors Services, Llc | 12.002 | -19,76 | 0 | |||||
| 2025-07-30 | 13F | D.a. Davidson & Co. | 17.678 | 0,86 | 584 | 9,59 | ||||
| 2025-08-13 | 13F | Baird Financial Group, Inc. | 0 | -100,00 | 0 | |||||
| 2025-08-15 | 13F | Kestra Advisory Services, LLC | 60.839 | 6,26 | 2.009 | 15,46 | ||||
| 2025-07-17 | 13F | Sound Income Strategies, LLC | 0 | 0 | ||||||
| 2025-04-10 | 13F | Secure Asset Management, LLC | 0 | -100,00 | 0 | -100,00 | ||||
| 2025-08-12 | 13F | Global Retirement Partners, LLC | 6.413 | 758,50 | 212 | 817,39 | ||||
| 2025-08-04 | 13F | Atria Investments Llc | 31.134 | 9,67 | 1.028 | 19,12 | ||||
| 2025-07-14 | 13F | Park Avenue Securities Llc | 0 | -100,00 | 0 | |||||
| 2025-07-14 | 13F | Iams Wealth Management, Llc | 35.836 | -3,78 | 1.184 | 4,51 | ||||
| 2025-08-05 | 13F | GPS Wealth Strategies Group, LLC | 530 | 0,00 | 18 | 6,25 | ||||
| 2025-08-08 | 13F | Larson Financial Group LLC | 1.638 | 0,18 | 54 | 10,20 | ||||
| 2025-05-12 | 13F | Independent Advisor Alliance | 0 | -100,00 | 0 | |||||
| 2025-08-08 | 13F | Emerald Investment Partners, Llc | 440 | 0,00 | 15 | 7,69 | ||||
| 2025-08-01 | 13F | Rossby Financial, LCC | 348 | 3,26 | 11 | 22,22 | ||||
| 2025-05-14 | 13F | Jane Street Group, Llc | 0 | -100,00 | 0 | |||||
| 2025-08-14 | 13F | Two Sigma Investments, Lp | 45.100 | 1.490 | ||||||
| 2025-08-14 | 13F | Great Valley Advisor Group, Inc. | 9.479 | 4,18 | 313 | 13,41 | ||||
| 2025-08-06 | 13F | Decker Retirement Planning Inc. | 4 | 0,00 | 0 | |||||
| 2025-08-14 | 13F | Qube Research & Technologies Ltd | 46 | 0,00 | 2 | 0,00 | ||||
| 2025-08-13 | 13F | Alerus Financial Na | 450 | 15 |