Grundlæggende statistik
| Institutionelle ejere | 157 total, 157 long only, 0 short only, 0 long/short - change of -0,63% MRQ |
| Gennemsnitlig porteføljeallokering | 0.3039 % - change of -18,22% MRQ |
| Institutionelle aktier (lange) | 25.606.205 (ex 13D/G) - change of 0,31MM shares 1,24% MRQ |
| Institutionel værdi (lang) | $ 755.138 USD ($1000) |
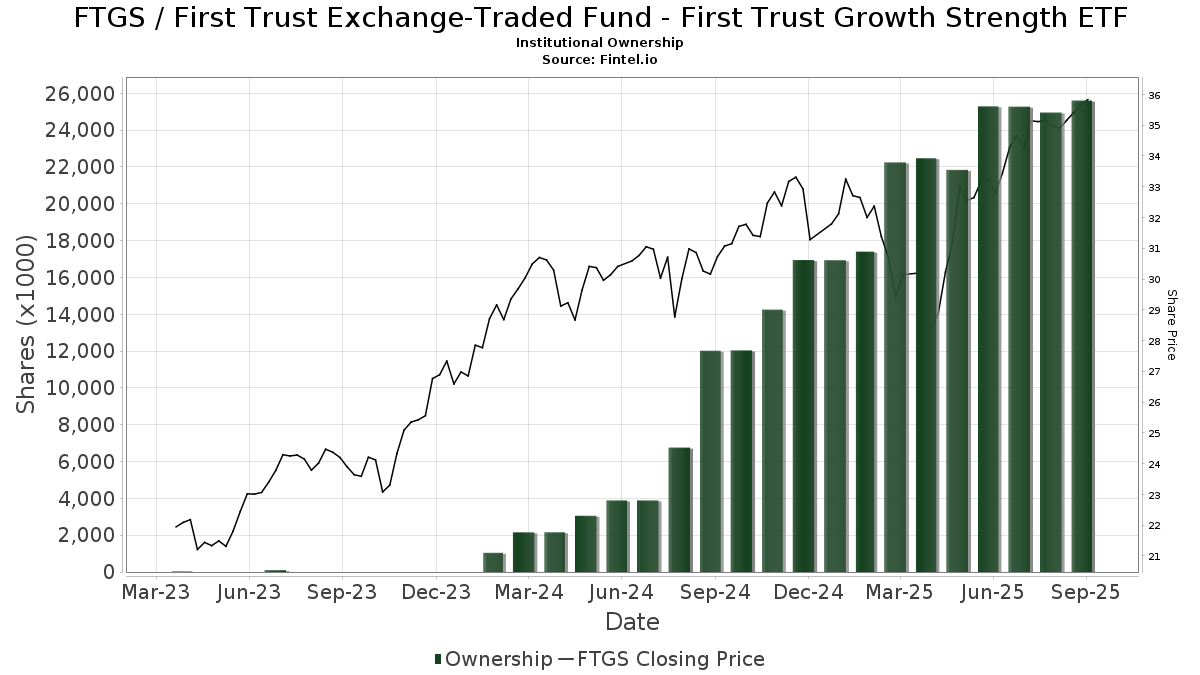
Institutionelt ejerskab og aktionærer
First Trust Exchange-Traded Fund - First Trust Growth Strength ETF (US:FTGS) har 157 institutionelle ejere og aktionærer, der har indsendt 13D/G- eller 13F-formularer til Securities Exchange Commission (SEC). Disse institutioner har i alt 25,606,205 aktier. Største aktionærer omfatter LPL Financial LLC, Cwm, Llc, Envestnet Asset Management Inc, Cetera Investment Advisers, Raymond James Financial Inc, Kestra Advisory Services, LLC, Cambridge Investment Research Advisors, Inc., Commonwealth Equity Services, Llc, Morgan Stanley, and Advisor Group Holdings, Inc. .
First Trust Exchange-Traded Fund - First Trust Growth Strength ETF (NasdaqGM:FTGS) institutionel ejerskabsstruktur viser aktuelle positioner i virksomheden efter institutioner og fonde, samt seneste ændringer i positionsstørrelse. Større aktionærer kan omfatte individuelle investorer, investeringsforeninger, hedgefonde eller institutioner. Skema 13D angiver, at investoren besidder (eller besidder) mere end 5 % af virksomheden og har til hensigt (eller har til hensigt at) aktivt at forfølge en ændring i forretningsstrategi. Skema 13G indikerer en passiv investering på over 5%.
The share price as of September 12, 2025 is 35,86 / share. Previously, on September 16, 2024, the share price was 30,79 / share. This represents an increase of 16,45% over that period.
Fondens stemningsscore
Fund Sentiment Score (fka Ownership Accumulation Score) finder de aktier, der bliver mest købt af fonde. Det er resultatet af en sofistikeret, multi-faktor kvantitativ model, der identificerer virksomheder med de højeste niveauer af institutionel akkumulering. Scoringsmodellen bruger en kombination af den samlede stigning i oplyste ejere, ændringerne i porteføljeallokeringer i disse ejere og andre målinger. Tallet går fra 0 til 100, hvor højere tal indikerer et højere niveau af akkumulering for sine jævnaldrende, og 50 er gennemsnittet.
Opdateringsfrekvens: Dagligt
Se Ownership Explorer, som giver en liste over højest rangerende virksomheder.
Institutionel Put/Call-forhold
Ud over at indberette standardaktie- og gældsudstedelser skal institutter med mere end 100 mill. aktiver under forvaltning også oplyse deres put- og call-optionsbeholdninger. Da salgsoptioner generelt indikerer negativ stemning, og købsoptioner indikerer positiv stemning, kan vi få en fornemmelse af den overordnede institutionelle stemning ved at plotte forholdet mellem put og kald. Diagrammet til højre viser det historiske put/call-forhold for dette instrument.
Brug af Put/Call Ratio som en indikator for investorernes stemning overvinder en af de vigtigste mangler ved at bruge totalt institutionelt ejerskab, som er, at en betydelig mængde af aktiver under forvaltning investeres passivt for at spore indekser. Passivt forvaltede fonde køber typisk ikke optioner, så indikatoren for put/call-forholdet følger mere nøje følelsen af aktivt forvaltede fonde.
13F og NPORT arkivering
Detaljer om 13F-arkivering er gratis. Detaljer om NP-ansøgninger kræver et premium-medlemskab. Grønne rækker angiver nye positioner. Røde rækker angiver lukkede positioner. Klik på linket ikon for at se den fulde transaktionshistorik.
Opgrader
for at låse premium-data op og eksportere til Excel ![]() .
.
| Fil dato | Kilde | Investor | Type | Gennemsnitlig pris (Øst) |
Aktier | Δ Aktier (%) |
Rapporteret Værdi ($1000) |
Δ Værdi (%) |
Port Alloc (%) |
|
|---|---|---|---|---|---|---|---|---|---|---|
| 2025-07-17 | 13F | Wagner Wealth Management, Llc | 135 | -44,90 | 5 | -42,86 | ||||
| 2025-05-15 | 13F/A | Orion Portfolio Solutions, LLC | 5.436 | -95,20 | 925 | -74,04 | ||||
| 2025-07-16 | 13F | Perigon Wealth Management, LLC | 8.012 | -27,24 | 274 | -16,51 | ||||
| 2025-08-01 | 13F | Rossby Financial, LCC | 2.634 | 0,69 | 90 | 15,38 | ||||
| 2025-07-11 | 13F | Kapstone Financial Advisors LLC | 48.827 | -4,04 | 1.669 | 10,31 | ||||
| 2025-07-15 | 13F | EWG Elevate Inc. | 176.659 | -0,45 | 6.040 | 14,40 | ||||
| 2025-08-14 | 13F | Jane Street Group, Llc | 0 | -100,00 | 0 | |||||
| 2025-08-11 | 13F | Synergy Investment Management, LLC | 0 | -100,00 | 0 | |||||
| 2025-08-14 | 13F | Susquehanna International Group, Llp | 58.099 | 1.986 | ||||||
| 2025-07-01 | 13F | Park National Corp /oh/ | 320.732 | -4,48 | 10.966 | 9,77 | ||||
| 2025-08-14 | 13F | Clg Llc | 62.148 | -14,95 | 2.125 | -2,30 | ||||
| 2025-07-17 | 13F | Barry Investment Advisors, LLC | 17.873 | 0,67 | 611 | 15,72 | ||||
| 2025-08-07 | 13F | Kestra Private Wealth Services, Llc | 180.025 | 5,10 | 6.155 | 20,80 | ||||
| 2025-08-08 | 13F | Kingsview Wealth Management, LLC | 50.715 | -49,64 | 1.734 | -42,16 | ||||
| 2025-08-04 | 13F | Creative Financial Designs Inc /adv | 22.660 | 0,23 | 775 | 15,18 | ||||
| 2025-08-13 | 13F | Transce3nd, LLC | 333 | -21,83 | 11 | -8,33 | ||||
| 2025-08-14 | 13F | Wells Fargo & Company/mn | 52.642 | 2.234,46 | 1.800 | 2.585,07 | ||||
| 2025-07-14 | 13F | Iams Wealth Management, Llc | 115.100 | 0,69 | 3.935 | 15,74 | ||||
| 2025-07-28 | 13F | Harbour Investments, Inc. | 88.749 | 3,03 | 3.034 | 18,42 | ||||
| 2025-08-14 | 13F | Raymond James Financial Inc | 1.189.754 | -0,21 | 40.678 | 14,69 | ||||
| 2025-05-01 | 13F | Quest 10 Wealth Builders, Inc. | 340 | -8,85 | 10 | -9,09 | ||||
| 2025-08-08 | 13F | Cetera Investment Advisers | 1.238.254 | 9,72 | 42.336 | 26,09 | ||||
| 2025-07-09 | 13F | Tounjian Advisory Partners, Llc | 458.528 | -0,94 | 13.641 | -0,94 | ||||
| 2025-08-12 | 13F | Global Retirement Partners, LLC | 20.184 | 9,40 | 690 | 19,17 | ||||
| 2025-08-13 | 13F | Baird Financial Group, Inc. | 173.594 | 2,86 | 5.935 | 18,23 | ||||
| 2025-08-14 | 13F | Goldman Sachs Group Inc | 44.527 | 31,27 | 1.522 | 50,84 | ||||
| 2025-08-18 | 13F | N.E.W. Advisory Services LLC | 1.531 | -99,50 | 52 | -99,43 | ||||
| 2025-07-25 | 13F | Envestnet Portfolio Solutions, Inc. | 27.547 | -65,91 | 942 | -60,84 | ||||
| 2025-07-29 | 13F | International Assets Investment Management, Llc | 22.116 | 5,23 | 756 | 20,96 | ||||
| 2025-07-30 | 13F | D.a. Davidson & Co. | 299.921 | -2,51 | 10.254 | 12,04 | ||||
| 2025-08-07 | 13F | PFG Advisors | 19.152 | -41,46 | 655 | -32,79 | ||||
| 2025-07-23 | 13F | RiverTree Advisors, LLC | 141.617 | -34,08 | 4.842 | -24,25 | ||||
| 2025-07-18 | 13F | Truist Financial Corp | 46.596 | -46,89 | 1.593 | -38,97 | ||||
| 2025-07-14 | 13F | Park Avenue Securities Llc | 60.221 | 2 | ||||||
| 2025-08-11 | 13F | Nations Financial Group Inc, /ia/ /adv | 63.792 | 5,90 | 2.181 | 21,71 | ||||
| 2025-07-23 | 13F | Morey & Quinn Wealth Partners, LLC | 17.934 | 57,40 | 613 | 81,36 | ||||
| 2025-08-07 | 13F | PCG Wealth Advisors, LLC | 0 | -100,00 | 0 | |||||
| 2025-08-14 | 13F | Wiley Bros.-aintree Capital, Llc | 9.698 | 10,29 | 344 | 62,56 | ||||
| 2025-07-15 | 13F | tru Independence LLC | 6.005 | 205 | ||||||
| 2025-08-12 | 13F | CIBC Private Wealth Group, LLC | 407 | 14 | ||||||
| 2025-08-06 | 13F | AE Wealth Management LLC | 117.753 | -32,58 | 4.026 | -22,54 | ||||
| 2025-07-24 | 13F | IFP Advisors, Inc | 117.509 | -8,97 | 4.018 | 4,61 | ||||
| 2025-08-14 | 13F | Stonehaven Wealth & Tax Solutions, Llc | 7.272 | 249 | ||||||
| 2025-07-30 | 13F/A | KPP Advisory Services LLC | 198.514 | 2,43 | 6.787 | 17,73 | ||||
| 2025-07-10 | 13F | Secure Asset Management, LLC | 0 | -100,00 | 0 | |||||
| 2025-04-17 | 13F | American Institute for Advanced Investment Management, LLP | 0 | -100,00 | 0 | -100,00 | ||||
| 2025-07-22 | 13F | DAVENPORT & Co LLC | 6.670 | -1,88 | 228 | 12,87 | ||||
| 2025-08-04 | 13F | Atria Investments Llc | 101.904 | 3,09 | 3.484 | 18,50 | ||||
| 2025-08-06 | 13F | Golden State Wealth Management, LLC | 52.337 | -0,14 | 1.789 | 14,75 | ||||
| 2025-08-12 | 13F | OneAscent Financial Services LLC | 72.960 | -52,42 | 2 | -50,00 | ||||
| 2025-08-13 | 13F | Proactive Wealth Strategies LLC | 60.300 | 0,01 | 2 | 100,00 | ||||
| 2025-07-21 | 13F | Clarity Capital Partners LLC | 9.231 | -18,80 | 316 | -6,80 | ||||
| 2025-07-28 | 13F | RFG Advisory, LLC | 27.105 | 2,59 | 927 | 17,96 | ||||
| 2025-08-11 | 13F | Independent Advisor Alliance | 401.875 | 69,13 | 13.740 | 94,37 | ||||
| 2025-08-14 | 13F | Royal Bank Of Canada | 423.428 | 4,74 | 14.477 | 20,37 | ||||
| 2025-04-21 | 13F | PSI Advisors, LLC | 0 | -100,00 | 0 | |||||
| 2025-07-31 | 13F | West Michigan Advisors, Llc | 153.141 | -3,93 | 5.236 | 10,40 | ||||
| 2025-08-11 | 13F | VSM Wealth Advisory, LLC | 503 | 0,00 | 17 | 21,43 | ||||
| 2025-08-12 | 13F | Steward Partners Investment Advisory, Llc | 47.156 | 10,45 | 1.612 | 26,93 | ||||
| 2025-08-13 | 13F | VestGen Advisors, LLC | 93.359 | 35,10 | 3.192 | 55,28 | ||||
| 2025-08-06 | 13F | Moors & Cabot, Inc. | 60.058 | 6,35 | 2.053 | 22,28 | ||||
| 2025-08-06 | 13F | Prospera Financial Services Inc | 454.762 | -0,43 | 15.549 | 14,43 | ||||
| 2025-07-22 | 13F | Merit Financial Group, LLC | 51.548 | -53,79 | 1.762 | -46,90 | ||||
| 2025-07-30 | 13F | BlueChip Wealth Advisors LLC | 16.192 | 0,00 | 554 | 14,97 | ||||
| 2025-07-25 | 13F | We Are One Seven, LLC | 8.634 | 15,35 | 295 | 32,88 | ||||
| 2025-04-29 | 13F | Onyx Bridge Wealth Group LLC | 0 | -100,00 | 0 | |||||
| 2025-07-15 | 13F | Fifth Third Bancorp | 2.185 | 138,80 | 75 | 174,07 | ||||
| 2025-08-13 | 13F | StoneX Group Inc. | 20.768 | 6,31 | 710 | 22,20 | ||||
| 2025-07-14 | 13F | ABLE Financial Group, LLC | 44.929 | 135,43 | 1.536 | 170,90 | ||||
| 2025-07-10 | 13F | Redhawk Wealth Advisors, Inc. | 10.570 | 5,08 | 361 | 20,74 | ||||
| 2025-07-15 | 13F | BKA Wealth Consulting, Inc. | 0 | -100,00 | 0 | |||||
| 2025-08-13 | 13F | Jones Financial Companies Lllp | 150 | 20,00 | 5 | 66,67 | ||||
| 2025-07-25 | 13F | Atria Wealth Solutions, Inc. | 9.284 | -84,93 | 317 | -82,70 | ||||
| 2025-04-21 | 13F | Nelson, Van Denburg & Campbell Wealth Management Group, LLC | 0 | -100,00 | 0 | |||||
| 2025-09-04 | 13F/A | Advisor Group Holdings, Inc. | 665.133 | 9,38 | 22.663 | 25,28 | ||||
| 2025-04-09 | 13F | St Germain D J Co Inc | 0 | -100,00 | 0 | |||||
| 2025-08-12 | 13F | LPL Financial LLC | 5.043.553 | 15,56 | 172.439 | 32,80 | ||||
| 2025-08-14 | 13F | Integrated Wealth Concepts LLC | 513.859 | 3,36 | 17.569 | 18,78 | ||||
| 2025-08-14 | 13F | Benjamin Edwards Inc | 165.244 | 52,74 | 5.650 | 75,54 | ||||
| 2025-08-12 | 13F | Northeast Planning Associates, Inc. / Nh / | 89.127 | 4,71 | 3.047 | 20,34 | ||||
| 2025-08-11 | 13F | NewEdge Wealth, LLC | 52.199 | -27,48 | 1.808 | -15,55 | ||||
| 2025-08-15 | 13F | Fsb Premier Wealth Management, Inc. | 33.912 | 13,67 | 1.159 | 30,67 | ||||
| 2025-05-15 | 13F | Hilltop Holdings Inc. | 0 | -100,00 | 0 | |||||
| 2025-07-31 | 13F | Hobart Private Capital, LLC | 397.189 | -6,23 | 13.580 | 7,76 | ||||
| 2025-08-08 | 13F | Avantax Advisory Services, Inc. | 196.643 | 14,79 | 6.723 | 31,93 | ||||
| 2025-08-08 | 13F | Foundations Investment Advisors, LLC | 26.218 | -6,87 | 896 | 7,05 | ||||
| 2025-08-14 | 13F | Herold Advisors, Inc. | 13.275 | -33,12 | 454 | -23,22 | ||||
| 2025-08-05 | 13F | EPG Wealth Management LLC | 0 | -100,00 | 0 | |||||
| 2025-08-04 | 13F | IFG Advisory, LLC | 56.006 | 16,33 | 1.915 | 33,66 | ||||
| 2025-08-12 | 13F | Proequities, Inc. | 0 | 0 | ||||||
| 2025-08-14 | 13F | Betterment LLC | 24.040 | 150,91 | 1 | |||||
| 2025-07-02 | 13F | HBW Advisory Services LLC | 20.583 | 5,10 | 704 | 20,79 | ||||
| 2025-07-29 | 13F | Private Trust Co Na | 791 | 29,46 | 27 | 50,00 | ||||
| 2025-07-21 | 13F | Ameritas Advisory Services, LLC | 3.742 | 128 | ||||||
| 2025-08-13 | 13F | Northwestern Mutual Wealth Management Co | 897 | 0,00 | 31 | 15,38 | ||||
| 2025-08-08 | 13F | POM Investment Strategies, LLC | 1 | -100,00 | 0 | -100,00 | ||||
| 2025-08-05 | 13F | Bank of New York Mellon Corp | 117.763 | -6,58 | 4.026 | 7,36 | ||||
| 2025-05-02 | 13F | Capital A Wealth Management, LLC | 0 | -100,00 | 0 | |||||
| 2025-07-11 | 13F | Pinnacle Bancorp, Inc. | 2.086 | 0,00 | 71 | 14,52 | ||||
| 2025-08-06 | 13F | Commonwealth Equity Services, Llc | 849.381 | -12,08 | 29 | 3,57 | ||||
| 2025-08-04 | 13F | Daymark Wealth Partners, Llc | 7.924 | 271 | ||||||
| 2025-07-16 | 13F | ORG Partners LLC | 1.000 | -75,00 | 34 | -71,43 | ||||
| 2025-08-14 | 13F | Great Valley Advisor Group, Inc. | 28.272 | -23,47 | 967 | -12,10 | ||||
| 2025-04-30 | 13F | Allworth Financial LP | 0 | -100,00 | 0 | |||||
| 2025-08-11 | 13F | Private Advisor Group, LLC | 336.920 | 0,35 | 11.519 | 15,33 | ||||
| 2025-07-31 | 13F | Oppenheimer & Co Inc | 10.150 | 347 | ||||||
| 2025-08-14 | 13F | Mariner, LLC | 8.150 | -40,18 | 279 | -31,36 | ||||
| 2025-07-22 | 13F | Comprehensive Financial Consultants Institutional, Inc. | 46.920 | -1,47 | 1.604 | 13,28 | ||||
| 2025-08-11 | 13F/A | Purus Wealth Management, LLC | 14.417 | -1,83 | 493 | 12,84 | ||||
| 2025-04-07 | 13F | GAMMA Investing LLC | 0 | -100,00 | 0 | |||||
| 2025-05-16 | 13F/A | Kestra Investment Management, LLC | 0 | -100,00 | 0 | |||||
| 2025-08-15 | 13F | Kestra Advisory Services, LLC | 1.007.030 | 50,95 | 34.430 | 73,48 | ||||
| 2025-08-05 | 13F | Sigma Planning Corp | 117.320 | -40,75 | 4.011 | -31,91 | ||||
| 2025-08-11 | 13F | Aptus Capital Advisors, LLC | 0 | -100,00 | 0 | |||||
| 2025-04-17 | 13F | Janney Montgomery Scott LLC | 0 | -100,00 | 0 | |||||
| 2025-08-05 | 13F | GPS Wealth Strategies Group, LLC | 11.134 | 588,13 | 381 | 691,67 | ||||
| 2025-08-14 | 13F | LaSalle St. Investment Advisors, LLC | 11.445 | 44,13 | 0 | |||||
| 2025-07-15 | 13F | FLP Wealth Management, LLC | 0 | -100,00 | 0 | |||||
| 2025-07-24 | 13F | Us Bancorp \de\ | 680 | 23 | ||||||
| 2025-07-17 | 13F | Albion Financial Group /ut | 5.735 | 0,00 | 196 | 15,29 | ||||
| 2025-07-15 | 13F | LVZ Advisors, Inc. | 106.729 | -0,35 | 3.649 | 14,53 | ||||
| 2025-08-12 | 13F | J.w. Cole Advisors, Inc. | 10.359 | 6,31 | 354 | 22,49 | ||||
| 2025-07-01 | 13F | Private Client Services, Llc | 14.638 | -6,88 | 500 | 7,07 | ||||
| 2025-07-24 | 13F | Costello Asset Management, INC | 0 | -100,00 | 0 | |||||
| 2025-07-11 | 13F | Farther Finance Advisors, LLC | 35.159 | -13,09 | 1.202 | -0,41 | ||||
| 2025-08-04 | 13F | Arkadios Wealth Advisors | 12.574 | 10,55 | 430 | 26,92 | ||||
| 2025-08-05 | 13F | BEAM Asset Management, LLC | 13.809 | 472 | ||||||
| 2025-08-13 | 13F | Gateway Wealth Partners, LLC | 82.263 | -30,85 | 2.813 | -20,54 | ||||
| 2025-07-22 | 13F | Belpointe Asset Management LLC | 49.525 | -29,48 | 1.693 | -18,96 | ||||
| 2025-08-14 | 13F | CoreCap Advisors, LLC | 67.568 | -12,88 | 2.310 | 0,13 | ||||
| 2025-08-13 | 13F | Smith, Moore & Co. | 7.627 | 261 | ||||||
| 2025-05-15 | 13F | Harvest Investment Services, LLC | 0 | -100,00 | 0 | |||||
| 2025-08-04 | 13F | Assetmark, Inc | 408.466 | 13,39 | 13.965 | 30,31 | ||||
| 2025-08-01 | 13F | Envestnet Asset Management Inc | 1.249.526 | 1,70 | 42.721 | 16,88 | ||||
| 2025-07-29 | 13F | Altus Wealth Group LLC | 42.504 | -1,80 | 1.453 | 12,90 | ||||
| 2025-08-13 | 13F | Flow Traders U.s. Llc | 0 | -100,00 | 0 | |||||
| 2025-07-16 | 13F | American National Bank | 363 | 0,00 | 12 | 20,00 | ||||
| 2025-07-24 | 13F | Ronald Blue Trust, Inc. | 86 | 0,00 | 3 | 0,00 | ||||
| 2025-08-13 | 13F | GeoWealth Management, LLC | 11.254 | 10,31 | 385 | 26,73 | ||||
| 2025-08-14 | 13F | Fmr Llc | 605 | -66,05 | 21 | -62,26 | ||||
| 2025-08-01 | 13F | Wealth Watch Advisors, INC | 25.457 | 13,18 | 870 | 30,04 | ||||
| 2025-07-29 | 13F | ODonnell Financial Services, LLC | 489.668 | 0,73 | 16.742 | 15,77 | ||||
| 2025-08-14 | 13F | Pinnacle Family Advisors, LLC | 55.387 | -16,24 | 1.894 | -3,76 | ||||
| 2025-07-21 | 13F | DHJJ Financial Advisors, Ltd. | 23.638 | 0,70 | 808 | 15,76 | ||||
| 2025-07-15 | 13F | Traction Financial Partners, LLC | 25.645 | 877 | ||||||
| 2025-08-13 | 13F | Maia Wealth LLC | 48.798 | -6,12 | 1.668 | 11,27 | ||||
| 2025-08-18 | 13F | Geneos Wealth Management Inc. | 20.782 | 113,35 | 711 | 145,67 | ||||
| 2025-08-11 | 13F | Mach-1 Financial Group, Inc. | 495.620 | 9,35 | 16.945 | 25,67 | ||||
| 2025-07-29 | 13F | Stratos Wealth Partners, LTD. | 14.367 | 82,79 | 491 | 110,73 | ||||
| 2025-08-04 | 13F | Impact Partnership Wealth, LLC | 12.064 | -22,99 | 412 | -11,59 | ||||
| 2025-08-06 | 13F | Legacy Wealth Managment, LLC/ID | 41.600 | 28,86 | 1.422 | 48,13 | ||||
| 2025-08-15 | 13F | Equitable Holdings, Inc. | 42.656 | 336,69 | 1.458 | 402,76 | ||||
| 2025-08-11 | 13F | Principal Securities, Inc. | 11.265 | -7,15 | 385 | 1,32 | ||||
| 2025-08-15 | 13F | Morgan Stanley | 676.790 | 8,14 | 23.139 | 24,28 | ||||
| 2025-08-14 | 13F | Synovus Financial Corp | 59.982 | -13,78 | 2.051 | -0,87 | ||||
| 2025-08-20 | 13F/A | Coppell Advisory Solutions LLC | 48.046 | -49,40 | 1.630 | -43,40 | ||||
| 2025-07-11 | 13F | SILVER OAK SECURITIES, Inc | 9.806 | -9,25 | 335 | 5,02 | ||||
| 2025-08-06 | 13F | Legacy Investment Solutions, LLC | 41.600 | 39,14 | 1.422 | 46,45 | ||||
| 2025-08-14 | 13F | Citadel Advisors Llc | 62.168 | -26,87 | 2.126 | -15,94 | ||||
| 2025-07-23 | 13F | REAP Financial Group, LLC | 2.833 | 0,00 | 97 | 14,29 | ||||
| 2025-08-14 | 13F | GWM Advisors LLC | 193.833 | 0,90 | 6.627 | 15,98 | ||||
| 2025-08-14 | 13F | UBS Group AG | 0 | -100,00 | 0 | |||||
| 2025-07-08 | 13F | Parallel Advisors, LLC | 25 | 1 | ||||||
| 2025-08-12 | 13F | SRS Capital Advisors, Inc. | 2.538 | -59,42 | 87 | -53,76 | ||||
| 2025-08-14 | 13F | Snowden Capital Advisors LLC | 140.413 | -3,35 | 4.801 | 11,06 | ||||
| 2025-08-06 | 13F | RFG - Bristol Wealth Advisors, LLC | 39.063 | 24,70 | 1.336 | 43,39 | ||||
| 2025-08-14 | 13F | Bank Of America Corp /de/ | 1.433 | -26,85 | 49 | -17,24 | ||||
| 2025-08-14 | 13F | Stifel Financial Corp | 554.413 | 18,27 | 18.957 | 35,93 | ||||
| 2025-07-17 | 13F | Centennial Wealth Advisory LLC | 72.133 | 70,67 | 2.466 | 96,18 | ||||
| 2025-05-01 | 13F | Stephens Inc /ar/ | 0 | -100,00 | 0 | |||||
| 2025-07-22 | 13F | Ergawealth Advisors, Inc. | 21.893 | 14,77 | 749 | 31,92 | ||||
| 2025-05-13 | 13F | O'shaughnessy Asset Management, Llc | 0 | -100,00 | 0 | |||||
| 2025-07-08 | 13F | Nbc Securities, Inc. | 3.057 | 0,00 | 0 | |||||
| 2025-08-04 | 13F | Integrity Alliance, Llc. | 0 | -100,00 | 0 | |||||
| 2025-07-25 | 13F | Cwm, Llc | 1.288.291 | 3,56 | 44 | 18,92 | ||||
| 2025-08-11 | 13F | WPG Advisers, LLC | 13.642 | 23,03 | 466 | 41,64 | ||||
| 2025-08-08 | 13F | Petix & Botte Co | 8.250 | 282 | ||||||
| 2025-08-27 | 13F/A | Brinker Capital Investments, LLC | 80.353 | 1.378,16 | 2.747 | 197,29 | ||||
| 2025-07-17 | 13F | San Luis Wealth Advisors LLC | 0 | -100,00 | 0 | |||||
| 2025-07-25 | 13F | Apollon Wealth Management, LLC | 14.882 | -21,24 | 509 | -9,61 | ||||
| 2025-07-21 | 13F | Ameriflex Group, Inc. | 496 | 0,00 | 17 | 14,29 | ||||
| 2025-07-31 | 13F | Cambridge Investment Research Advisors, Inc. | 958.178 | 22,54 | 33 | 39,13 | ||||
| 2025-08-14 | 13F | Mml Investors Services, Llc | 153.702 | -18,04 | 5 | 0,00 | ||||
| 2025-08-11 | 13F | Western Wealth Management, LLC | 29.235 | -5,52 | 1.000 | 8,59 | ||||
| 2025-08-06 | 13F | New Millennium Group LLC | 0 | 0 | ||||||
| 2025-08-08 | 13F | Good Life Advisors, LLC | 207.815 | 10,71 | 7.105 | 27,24 |
Other Listings
| MX:FTGS |