Grundlæggende statistik
| Institutionelle ejere | 122 total, 122 long only, 0 short only, 0 long/short - change of 12,96% MRQ |
| Gennemsnitlig porteføljeallokering | 0.4010 % - change of 33,83% MRQ |
| Institutionelle aktier (lange) | 8.945.534 (ex 13D/G) - change of 1,56MM shares 21,15% MRQ |
| Institutionel værdi (lang) | $ 433.987 USD ($1000) |
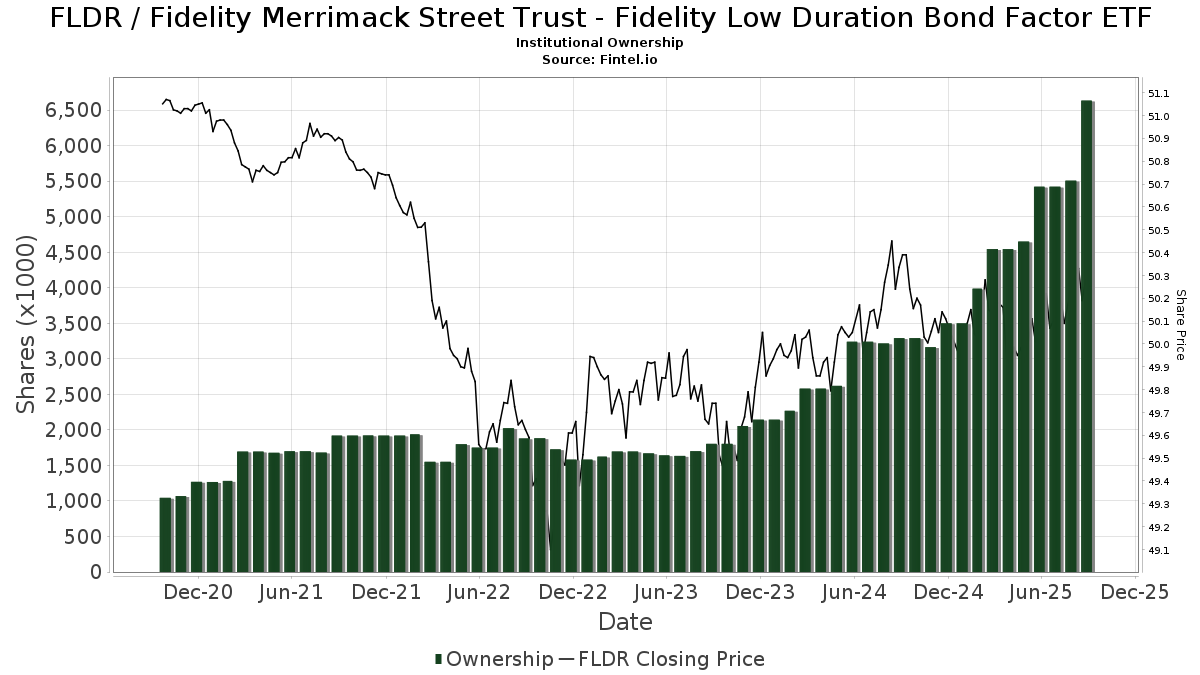
Institutionelt ejerskab og aktionærer
Fidelity Merrimack Street Trust - Fidelity Low Duration Bond Factor ETF (US:FLDR) har 122 institutionelle ejere og aktionærer, der har indsendt 13D/G- eller 13F-formularer til Securities Exchange Commission (SEC). Disse institutioner har i alt 8,945,534 aktier. Største aktionærer omfatter Wells Fargo & Company/mn, Raymond James Financial Inc, Commonwealth Equity Services, Llc, LPL Financial LLC, AE Wealth Management LLC, Morgan Stanley, Financially Speaking Inc, Bank Of America Corp /de/, Goldman Sachs Group Inc, and Mml Investors Services, Llc .
Fidelity Merrimack Street Trust - Fidelity Low Duration Bond Factor ETF (BATS:FLDR) institutionel ejerskabsstruktur viser aktuelle positioner i virksomheden efter institutioner og fonde, samt seneste ændringer i positionsstørrelse. Større aktionærer kan omfatte individuelle investorer, investeringsforeninger, hedgefonde eller institutioner. Skema 13D angiver, at investoren besidder (eller besidder) mere end 5 % af virksomheden og har til hensigt (eller har til hensigt at) aktivt at forfølge en ændring i forretningsstrategi. Skema 13G indikerer en passiv investering på over 5%.
The share price as of March 6, 2026 is 50,25 / share. Previously, on March 10, 2025, the share price was 50,18 / share. This represents an increase of 0,14% over that period.
Fondens stemningsscore
Fund Sentiment Score (fka Ownership Accumulation Score) finder de aktier, der bliver mest købt af fonde. Det er resultatet af en sofistikeret, multi-faktor kvantitativ model, der identificerer virksomheder med de højeste niveauer af institutionel akkumulering. Scoringsmodellen bruger en kombination af den samlede stigning i oplyste ejere, ændringerne i porteføljeallokeringer i disse ejere og andre målinger. Tallet går fra 0 til 100, hvor højere tal indikerer et højere niveau af akkumulering for sine jævnaldrende, og 50 er gennemsnittet.
Opdateringsfrekvens: Dagligt
Se Ownership Explorer, som giver en liste over højest rangerende virksomheder.
AI+ Ask Fintel’s AI assistant about Fidelity Merrimack Street Trust - Fidelity Low Duration Bond Factor ETF.
Select a question to share a public post with an AI-crafted answer.
Thinking of good questions…
Institutionel Put/Call-forhold
Ud over at indberette standardaktie- og gældsudstedelser skal institutter med mere end 100 mill. aktiver under forvaltning også oplyse deres put- og call-optionsbeholdninger. Da salgsoptioner generelt indikerer negativ stemning, og købsoptioner indikerer positiv stemning, kan vi få en fornemmelse af den overordnede institutionelle stemning ved at plotte forholdet mellem put og kald. Diagrammet til højre viser det historiske put/call-forhold for dette instrument.
Brug af Put/Call Ratio som en indikator for investorernes stemning overvinder en af de vigtigste mangler ved at bruge totalt institutionelt ejerskab, som er, at en betydelig mængde af aktiver under forvaltning investeres passivt for at spore indekser. Passivt forvaltede fonde køber typisk ikke optioner, så indikatoren for put/call-forholdet følger mere nøje følelsen af aktivt forvaltede fonde.

13F og NPORT arkivering
Detaljer om 13F-arkivering er gratis. Detaljer om NP-ansøgninger kræver et premium-medlemskab. Grønne rækker angiver nye positioner. Røde rækker angiver lukkede positioner. Klik på linket ikon for at se den fulde transaktionshistorik.
Opgrader
for at låse premium-data op og eksportere til Excel ![]() .
.
| Fil dato | Kilde | Investor | Type | Gennemsnitlig pris (Øst) |
Aktier | Δ Aktier (%) |
Rapporteret Værdi ($1000) |
Δ Værdi (%) |
Port Alloc (%) |
|
|---|---|---|---|---|---|---|---|---|---|---|
| 2026-01-23 | 13F | Andrew Hill Investment Advisors, Inc. | 13.061 | -8,38 | 656 | -8,25 | ||||
| 2026-02-17 | 13F | Citadel Advisors Llc | 0 | -100,00 | 0 | |||||
| 2026-02-17 | 13F | Main Street Financial Solutions, LLC | 7.970 | 1,14 | 400 | 1,27 | ||||
| 2026-01-14 | 13F | Eastern Bank | 0 | -100,00 | 0 | |||||
| 2026-02-20 | 13F | Sunbelt Securities, Inc. | 132 | -18,01 | 7 | -25,00 | ||||
| 2026-02-09 | 13F | TradeWell Securities, LLC. | 30.790 | 11,68 | 1.547 | 11,62 | ||||
| 2026-01-21 | 13F | Prime Capital Investment Advisors, LLC | 164.055 | 17,29 | 8.240 | 17,36 | ||||
| 2026-01-28 | 13F | Geneos Wealth Management Inc. | 564 | -79,09 | 28 | -79,26 | ||||
| 2026-02-11 | 13F | Jpmorgan Chase & Co | 2.568 | 45,74 | 129 | 46,59 | ||||
| 2026-02-17 | 13F | Royal Bank Of Canada | 116.737 | 16,03 | 5.864 | 16,10 | ||||
| 2025-11-12 | 13F | Harbour Investments, Inc. | 0 | -100,00 | 0 | |||||
| 2026-01-26 | 13F | JNBA Financial Advisors | 155 | 1,31 | 8 | 0,00 | ||||
| 2026-01-29 | 13F | Huntleigh Advisors, Inc. | 114.180 | -2,64 | 5.735 | -2,58 | ||||
| 2026-02-11 | 13F | J.w. Cole Advisors, Inc. | 5.118 | -15,49 | 257 | -15,46 | ||||
| 2026-01-29 | 13F | Quest 10 Wealth Builders, Inc. | 23 | 0,00 | 1 | 0,00 | ||||
| 2026-02-13 | 13F | Flow Traders U.s. Llc | 47.483 | 457,31 | 2 | |||||
| 2026-02-13 | 13F | Citigroup Inc | 1.915 | 96 | ||||||
| 2026-01-20 | 13F | Stratos Wealth Partners, LTD. | 7.290 | 0,93 | 366 | 1,10 | ||||
| 2026-01-27 | 13F | Revisor Wealth Management LLC | 8.858 | 445 | ||||||
| 2026-01-20 | 13F | Savvy Advisors, Inc. | 14.746 | 741 | ||||||
| 2025-11-07 | 13F | Riverstone Advisors, LLC | 0 | -100,00 | 0 | -100,00 | ||||
| 2026-02-13 | 13F | Kestra Advisory Services, LLC | 0 | -100,00 | 0 | |||||
| 2026-01-28 | 13F | WPG Advisers, LLC | 3.294 | 165 | ||||||
| 2026-02-10 | 13F/A | Northwestern Mutual Wealth Management Co | 1.799 | 122,65 | 90 | 125,00 | ||||
| 2026-01-21 | 13F | Seed Wealth Management, Inc. | 8.700 | 0,00 | 437 | 0,23 | ||||
| 2026-02-12 | 13F | Rossby Financial, LCC | 29 | 0,00 | 1 | 0,00 | ||||
| 2026-02-17 | 13F | Snowden Capital Advisors LLC | 71.800 | 8,79 | 3.621 | 8,84 | ||||
| 2026-02-17 | 13F | Creative Planning | 0 | -100,00 | 0 | |||||
| 2026-01-29 | 13F | Kestra Private Wealth Services, Llc | 19.859 | -0,89 | 997 | -0,80 | ||||
| 2026-02-02 | 13F | Addison Capital Co | 4.479 | 0,00 | 225 | 0,00 | ||||
| 2026-02-12 | 13F | Commonwealth Equity Services, Llc | 644.156 | 46,96 | 32.356 | 146.968,18 | ||||
| 2026-02-17 | 13F | Seldon Capital Lp | 6.552 | -18,86 | 329 | -18,77 | ||||
| 2026-02-13 | 13F | SRS Capital Advisors, Inc. | 23 | 1 | ||||||
| 2026-02-13 | 13F | Wells Fargo & Company/mn | 1.023.685 | 2,92 | 51.420 | 2,98 | ||||
| 2026-02-03 | 13F | Grimes & Company, Inc. | 8.219 | 1,14 | 413 | 1,23 | ||||
| 2026-01-27 | 13F | Elevated Capital Advisors, LLC | 1.756 | 88 | ||||||
| 2026-02-10 | 13F | Foundations Investment Advisors, LLC | 165.588 | 13,55 | 8.318 | 13,62 | ||||
| 2026-02-10 | 13F | Financially Speaking Inc | 349.000 | 223,80 | 17.530 | 224,03 | ||||
| 2026-01-30 | 13F | Strategic Blueprint, LLC | 40.449 | 47,26 | 2.032 | 47,39 | ||||
| 2026-02-13 | 13F | Mml Investors Services, Llc | 265.044 | -11,68 | 13.313 | -11,63 | ||||
| 2026-01-07 | 13F | Lakeridge Wealth Management LLC | 67.619 | 9,08 | 3.396 | 9,16 | ||||
| 2026-01-29 | 13F | Virtus Wealth Solutions LLC | 13.173 | 2,80 | 662 | 2,80 | ||||
| 2026-01-16 | 13F | West Branch Capital LLC | 2.355 | 0,99 | 118 | 0,85 | ||||
| 2026-01-26 | 13F | Decker Retirement Planning Inc. | 0 | -100,00 | 0 | |||||
| 2026-02-17 | 13F | Raymond James Financial Inc | 776.443 | 25,70 | 39.001 | 25,78 | ||||
| 2026-02-10 | 13F | Root Financial Partners, LLC | 422 | 111,00 | 21 | 110,00 | ||||
| 2026-02-10 | 13F | Goldman Sachs Group Inc | 272.283 | 13.677 | ||||||
| 2026-02-06 | 13F | IFP Advisors, Inc | 1.321 | -33,25 | 66 | -33,33 | ||||
| 2026-02-06 | 13F | Global Retirement Partners, LLC | 6.504 | 1,15 | 327 | 1,24 | ||||
| 2026-01-16 | 13F | Genesee Capital Advisors, LLC | 16.522 | 4,35 | 830 | 4,41 | ||||
| 2026-01-29 | 13F | UBS Group AG | 172.452 | -0,13 | 8.662 | -0,07 | ||||
| 2026-02-17 | 13F | Advisory Services Network, LLC | 7.444 | 46,13 | 374 | 46,27 | ||||
| 2026-01-13 | 13F | LongView Wealth Management | 7.604 | 33,71 | 382 | 34,04 | ||||
| 2026-01-26 | 13F | Cottage Street Advisors LLC | 47.462 | 115,68 | 2.384 | 115,85 | ||||
| 2026-01-26 | 13F | Lowery Thomas, Llc | 74.451 | 7,80 | 3.740 | 7,85 | ||||
| 2026-01-21 | 13F | Planning Directions Inc | 113.546 | -4,58 | 5.703 | -4,52 | ||||
| 2025-11-14 | 13F | Hrt Financial Lp | 0 | -100,00 | 0 | |||||
| 2026-02-13 | 13F | WealthTrust Axiom LLC | 158.401 | 26,72 | 7.957 | 26,79 | ||||
| 2026-01-29 | 13F | Comerica Bank | 954 | -7,56 | 48 | -7,84 | ||||
| 2026-01-07 | 13F | Tounjian Advisory Partners, Llc | 14.504 | -1,71 | 729 | -1,62 | ||||
| 2025-11-10 | 13F | GGM Financials LLC | 0 | -100,00 | 0 | -100,00 | ||||
| 2026-02-17 | 13F | Fmr Llc | 4.197 | 33,62 | 211 | 33,76 | ||||
| 2026-02-03 | 13F | McIlrath & Eck, LLC | 427 | -48,24 | 21 | -48,78 | ||||
| 2026-02-04 | 13F | Tsfg, Llc | 99 | 2,06 | 0 | |||||
| 2026-02-09 | 13F | Prospera Financial Services Inc | 7.386 | -0,63 | 371 | -0,80 | ||||
| 2025-09-26 | 13F | Capital A Wealth Management, LLC | 71 | 2.266,67 | 4 | |||||
| 2026-02-04 | 13F | Liberty Wealth Management Llc | 6.519 | 0,90 | 327 | 0,93 | ||||
| 2026-02-09 | 13F | Parkside Investments, LLC | 6.500 | 30,00 | 326 | 29,88 | ||||
| 2026-02-05 | 13F | Flavin Financial Services, Inc. | 27.857 | 11,95 | 1.399 | 12,01 | ||||
| 2026-01-29 | 13F | Howard Wealth Management, Llc | 50.663 | 33,32 | 2.545 | 33,40 | ||||
| 2026-01-05 | 13F | GK Wealth Management LLC | 4.429 | 222 | ||||||
| 2026-02-13 | 13F | Morgan Stanley | 371.438 | 1,80 | 18.657 | 1,86 | ||||
| 2026-02-02 | 13F | Oppenheimer & Co Inc | 4.193 | -45,09 | 211 | -45,17 | ||||
| 2025-11-25 | 13F | Briaud Financial Planning, Inc | 0 | -100,00 | 0 | |||||
| 2026-02-11 | 13F | Cedar Point Capital Partners, LLC | 126.328 | 5,06 | 6.345 | 5,12 | ||||
| 2026-02-17 | 13F | Susquehanna International Group, Llp | 10.234 | 514 | ||||||
| 2026-01-16 | 13F | Herbst Group, Llc | 47.600 | 19,75 | 2.391 | 19,80 | ||||
| 2026-02-13 | 13F | Planwiser Financial, Llc | 109.018 | 5.476 | ||||||
| 2026-01-23 | 13F | Farther Finance Advisors, LLC | 2.000 | 100 | ||||||
| 2026-01-13 | 13F | Parsons Capital Management Inc/ri | 5.965 | 300 | ||||||
| 2026-02-12 | 13F | Great Lakes Retirement, Inc. | 56.149 | 4,52 | 2.832 | 5,01 | ||||
| 2026-02-04 | 13F | Pensionmark Financial Group, Llc | 34.255 | 1.721 | ||||||
| 2026-02-06 | 13F | Mach-1 Financial Group, Inc. | 9.801 | 492 | ||||||
| 2026-02-12 | 13F | Principal Securities, Inc. | 0 | -100,00 | 0 | |||||
| 2026-01-26 | 13F | AE Wealth Management LLC | 399.536 | 17,49 | 20.069 | 17,56 | ||||
| 2026-02-12 | 13F | Triumph Capital Management | 150 | 0,00 | 8 | 0,00 | ||||
| 2025-11-20 | 13F | Asset Dedication, LLC | 0 | -100,00 | 0 | -100,00 | ||||
| 2026-01-14 | 13F | ORG Partners LLC | 0 | -100,00 | 0 | |||||
| 2026-02-11 | 13F | Schwallier Wealth Management LLC | 47.887 | 2.404 | ||||||
| 2026-02-03 | 13F | Koshinski Asset Management, Inc. | 113.050 | 172,02 | 5.679 | 172,20 | ||||
| 2026-01-22 | 13F | Elm3 Financial Group, LLC | 10.973 | -2,80 | 551 | -2,65 | ||||
| 2026-02-06 | 13F | Tanglewood Legacy Advisors, LLC | 104 | 5 | ||||||
| 2026-01-30 | 13F | Sigma Planning Corp | 4.823 | 242 | ||||||
| 2026-01-14 | 13F | Tradewinds Capital Management, LLC | 0 | -100,00 | 0 | |||||
| 2026-02-17 | 13F | Jones Financial Companies Lllp | 79 | 4 | ||||||
| 2025-11-07 | 13F | Avestar Capital, LLC | 0 | -100,00 | 0 | |||||
| 2026-02-06 | 13F | Kingdom Financial Group LLC. | 10 | -99,93 | 0 | -100,00 | ||||
| 2026-02-13 | 13F | Clarity Asset Management, Inc. | 109 | 1,87 | 5 | 0,00 | ||||
| 2026-01-12 | 13F | Accelerate Investment Advisors LLC | 4.283 | 2,20 | 215 | 2,38 | ||||
| 2026-01-20 | 13F | Sugar Maple Asset Management, LLC | 15.608 | -6,98 | 784 | -6,89 | ||||
| 2026-01-14 | 13F | Kraft, Davis & Associates, LLC | 173.373 | 25,53 | 8.717 | 25,62 | ||||
| 2026-01-15 | 13F | RCS Financial Planning, LLC | 121.192 | 8,13 | 6.112 | 8,20 | ||||
| 2026-02-14 | 13F | Rockefeller Capital Management L.P. | 4.150 | 2.666,67 | 208 | 2.871,43 | ||||
| 2026-02-13 | 13F | Perspective Wealth Advisors Llc | 109.018 | 5.476 | ||||||
| 2026-02-13 | 13F | Tableaux Llc | 131.769 | 60,03 | 2.410 | -41,71 | ||||
| 2026-02-04 | 13F | Meridian Wealth Management, LLC | 45.203 | 2,53 | 2.271 | 2,58 | ||||
| 2026-02-09 | 13F | Shufro Rose & Co Llc | 11.100 | 558 | ||||||
| 2025-11-03 | 13F | Absolute Capital Management, LLC | 0 | -100,00 | 0 | |||||
| 2026-02-05 | 13F | Cambridge Investment Research Advisors, Inc. | 60.002 | -6,80 | 3 | 0,00 | ||||
| 2026-01-14 | 13F | Spire Wealth Management | 185 | 5,71 | 9 | 12,50 | ||||
| 2026-02-06 | 13F | Csenge Advisory Group | 9.596 | 18,64 | 482 | 19,01 | ||||
| 2026-02-06 | 13F | New Millennium Group LLC | 13 | 0,00 | 1 | |||||
| 2026-02-17 | 13F | Cetera Investment Advisers | 65.932 | 1,24 | 3.312 | 1,28 | ||||
| 2026-02-13 | 13F | Mariner, LLC | 84.240 | -1,48 | 4.231 | -1,42 | ||||
| 2025-11-10 | 13F | Colonial Trust Co / SC | 0 | -100,00 | 0 | |||||
| 2026-01-12 | 13F | DAVENPORT & Co LLC | 6.000 | -45,45 | 301 | -45,47 | ||||
| 2026-02-04 | 13F | Anson Capital, Inc. | 11.228 | 1,88 | 564 | 1,81 | ||||
| 2026-02-12 | 13F | Steward Partners Investment Advisory, Llc | 4.450 | -32,06 | 224 | -32,01 | ||||
| 2026-02-06 | 13F | HighTower Advisors, LLC | 83.262 | 19,09 | 4.182 | 19,18 | ||||
| 2026-02-10 | 13F | Envestnet Asset Management Inc | 202.621 | -13,98 | 10.178 | -13,93 | ||||
| 2026-02-17 | 13F | LaSalle St. Investment Advisors, LLC | 8.419 | 0 | ||||||
| 2026-02-04 | 13F | Ameritas Advisory Services, LLC | 0 | -100,00 | 0 | |||||
| 2026-02-12 | 13F | Jane Street Group, Llc | 33.124 | -71,74 | 1.664 | -71,74 | ||||
| 2026-02-13 | 13F/A | New England Private Wealth Advisors LLC | 7.201 | 11,97 | 362 | 12,11 | ||||
| 2026-01-21 | 13F | Sowell Financial Services LLC | 57.865 | 2.907 | ||||||
| 2026-03-03 | 13F | NWF Advisory Services Inc. | 70.881 | -8,26 | 3.560 | -8,20 | ||||
| 2026-01-14 | 13F | Jfs Wealth Advisors, Llc | 1.896 | 1,12 | 95 | 1,06 | ||||
| 2026-01-14 | 13F | Southland Equity Partners LLC | 7.405 | 65,55 | 372 | 65,63 | ||||
| 2026-01-23 | 13F | Guidance Capital, Inc | 10.881 | 0,00 | 547 | -0,18 | ||||
| 2026-02-17 | 13F | Wiley Bros.-aintree Capital, Llc | 11.794 | -4,92 | 592 | -4,82 | ||||
| 2026-02-11 | 13F | LPL Financial LLC | 533.043 | 12,41 | 26.775 | 12,47 | ||||
| 2026-02-11 | 13F | Gwn Securities Inc. | 6.575 | -13,98 | 330 | -13,84 | ||||
| 2026-02-05 | 13F | Allworth Financial LP | 19 | 1 | ||||||
| 2026-02-26 | 13F | TD Capital Management LLC | 6.153 | 1,13 | 309 | 1,31 | ||||
| 2026-02-03 | 13F | Sequoia Financial Advisors, LLC | 6.580 | -13,19 | 331 | -13,16 | ||||
| 2026-02-09 | 13F | Fidelis Capital Partners, LLC | 34.690 | -0,69 | 1.742 | -0,63 | ||||
| 2026-02-03 | 13F | Foronjy Financial Llc | 14.285 | 4,25 | 718 | 4,37 | ||||
| 2026-02-17 | 13F | Advisor Group Holdings, Inc. | 206.882 | 10,40 | 10.401 | 10,57 | ||||
| 2026-02-13 | 13F | Arete Wealth Advisors, LLC | 106.152 | 4,99 | 5 | 0,00 | ||||
| 2026-02-17 | 13F | Bank Of America Corp /de/ | 313.077 | 2,99 | 15.726 | 3,05 |