Grundlæggende statistik
| Institutionelle ejere | 74 total, 74 long only, 0 short only, 0 long/short - change of 2,78% MRQ |
| Gennemsnitlig porteføljeallokering | 0.4976 % - change of 9,98% MRQ |
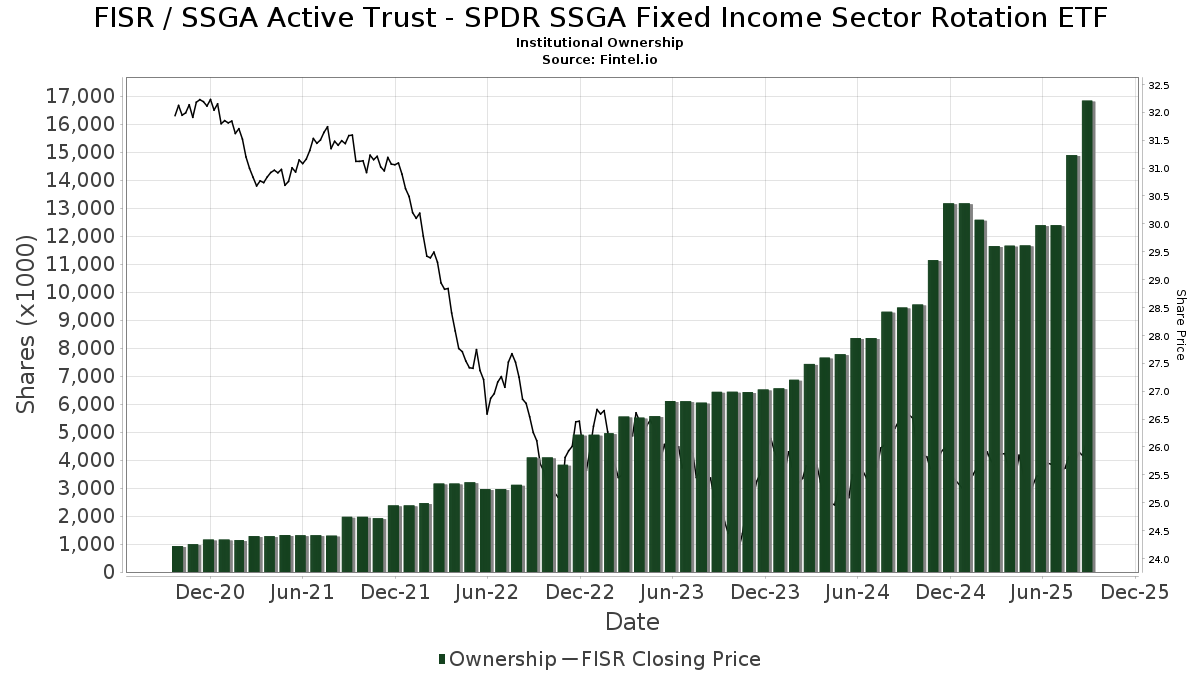
| Institutionelle aktier (lange) | 16.839.815 (ex 13D/G) - change of 4,45MM shares 35,91% MRQ |
| Institutionel værdi (lang) | $ 420.568 USD ($1000) |
Institutionelt ejerskab og aktionærer
SSGA Active Trust - SPDR SSGA Fixed Income Sector Rotation ETF (US:FISR) har 74 institutionelle ejere og aktionærer, der har indsendt 13D/G- eller 13F-formularer til Securities Exchange Commission (SEC). Disse institutioner har i alt 16,839,815 aktier. Største aktionærer omfatter LPL Financial LLC, Envestnet Portfolio Solutions, Inc., Envestnet Asset Management Inc, Aspire Private Capital, LLC, GWM Advisors LLC, Hibernia Wealth Partners, LLC, Austin Private Wealth, LLC, Park Avenue Securities Llc, Raleigh Capital Management Inc., and Landmark Wealth Management, Inc. .
SSGA Active Trust - SPDR SSGA Fixed Income Sector Rotation ETF (ARCA:FISR) institutionel ejerskabsstruktur viser aktuelle positioner i virksomheden efter institutioner og fonde, samt seneste ændringer i positionsstørrelse. Større aktionærer kan omfatte individuelle investorer, investeringsforeninger, hedgefonde eller institutioner. Skema 13D angiver, at investoren besidder (eller besidder) mere end 5 % af virksomheden og har til hensigt (eller har til hensigt at) aktivt at forfølge en ændring i forretningsstrategi. Skema 13G indikerer en passiv investering på over 5%.
The share price as of September 8, 2025 is 26,11 / share. Previously, on September 9, 2024, the share price was 26,59 / share. This represents a decline of 1,80% over that period.
Fondens stemningsscore
Fund Sentiment Score (fka Ownership Accumulation Score) finder de aktier, der bliver mest købt af fonde. Det er resultatet af en sofistikeret, multi-faktor kvantitativ model, der identificerer virksomheder med de højeste niveauer af institutionel akkumulering. Scoringsmodellen bruger en kombination af den samlede stigning i oplyste ejere, ændringerne i porteføljeallokeringer i disse ejere og andre målinger. Tallet går fra 0 til 100, hvor højere tal indikerer et højere niveau af akkumulering for sine jævnaldrende, og 50 er gennemsnittet.
Opdateringsfrekvens: Dagligt
Se Ownership Explorer, som giver en liste over højest rangerende virksomheder.
Institutionel Put/Call-forhold
Ud over at indberette standardaktie- og gældsudstedelser skal institutter med mere end 100 mill. aktiver under forvaltning også oplyse deres put- og call-optionsbeholdninger. Da salgsoptioner generelt indikerer negativ stemning, og købsoptioner indikerer positiv stemning, kan vi få en fornemmelse af den overordnede institutionelle stemning ved at plotte forholdet mellem put og kald. Diagrammet til højre viser det historiske put/call-forhold for dette instrument.
Brug af Put/Call Ratio som en indikator for investorernes stemning overvinder en af de vigtigste mangler ved at bruge totalt institutionelt ejerskab, som er, at en betydelig mængde af aktiver under forvaltning investeres passivt for at spore indekser. Passivt forvaltede fonde køber typisk ikke optioner, så indikatoren for put/call-forholdet følger mere nøje følelsen af aktivt forvaltede fonde.
13F og NPORT arkivering
Detaljer om 13F-arkivering er gratis. Detaljer om NP-ansøgninger kræver et premium-medlemskab. Grønne rækker angiver nye positioner. Røde rækker angiver lukkede positioner. Klik på linket ikon for at se den fulde transaktionshistorik.
Opgrader
for at låse premium-data op og eksportere til Excel ![]() .
.
| Fil dato | Kilde | Investor | Type | Gennemsnitlig pris (Øst) |
Aktier | Δ Aktier (%) |
Rapporteret Værdi ($1000) |
Δ Værdi (%) |
Port Alloc (%) |
|
|---|---|---|---|---|---|---|---|---|---|---|
| 2025-08-06 | 13F | Valtinson Bruner Financial Planning LLC | 33.349 | 331,14 | 862 | 330,50 | ||||
| 2025-08-13 | 13F | Transce3nd, LLC | 5.814 | 101,60 | 150 | 102,70 | ||||
| 2025-07-25 | 13F | Envestnet Portfolio Solutions, Inc. | 3.500.821 | 41,34 | 90.461 | 41,12 | ||||
| 2025-07-18 | 13F | Lockerman Financial Group, Inc. | 84.417 | 22,88 | 2.181 | 22,73 | ||||
| 2025-07-02 | 13F | HBW Advisory Services LLC | 10.465 | 8,45 | 270 | 8,43 | ||||
| 2025-07-17 | 13F | Raleigh Capital Management Inc. | 453.825 | 14,28 | 11.727 | 14,10 | ||||
| 2025-08-29 | 13F | Evolution Wealth Management Inc. | 24 | 1 | ||||||
| 2025-05-14 | 13F | Caitlin John, LLC | 0 | -100,00 | 0 | |||||
| 2025-08-14 | 13F | Smartleaf Asset Management LLC | 4.935 | 538,42 | 127 | 563,16 | ||||
| 2025-08-14 | 13F | Mml Investors Services, Llc | 26.729 | 1 | ||||||
| 2025-08-07 | 13F | Allworth Financial LP | 5.893 | -57,11 | 152 | -56,82 | ||||
| 2025-08-11 | 13F | HighTower Advisors, LLC | 324.287 | 22,21 | 8.380 | 22,02 | ||||
| 2025-07-23 | 13F | True Vision MN LLC | 29.144 | 8,68 | 753 | 8,50 | ||||
| 2025-08-12 | 13F | Richard W. Paul & Associates, LLC | 14.689 | 206,53 | 380 | 205,65 | ||||
| 2025-08-06 | 13F | AE Wealth Management LLC | 134.162 | 27,16 | 3.467 | 26,96 | ||||
| 2025-04-23 | 13F | Walkner Condon Financial Advisors LLC | 0 | -100,00 | 0 | |||||
| 2025-08-14 | 13F | Royal Bank Of Canada | 4.809 | 0,00 | 124 | 0,00 | ||||
| 2025-08-01 | 13F | Austin Private Wealth, LLC | 652.063 | 149,90 | 16.849 | 149,54 | ||||
| 2025-08-14 | 13F | Wells Fargo & Company/mn | 2.130 | 2,65 | 55 | 3,77 | ||||
| 2025-07-07 | 13F | Capital Asset Advisory Services LLC | 18.454 | 28,02 | 475 | 27,08 | ||||
| 2025-08-04 | 13F | Atria Investments Llc | 11.096 | 3,80 | 287 | 3,62 | ||||
| 2025-08-11 | 13F | Principal Securities, Inc. | 19.221 | 339,14 | 497 | 346,85 | ||||
| 2025-08-12 | 13F | Proequities, Inc. | 0 | 0 | ||||||
| 2025-07-22 | 13F | Merit Financial Group, LLC | 19.547 | -28,91 | 505 | -28,97 | ||||
| 2025-04-17 | 13F | Good Life Advisors, LLC | 0 | -100,00 | 0 | |||||
| 2025-07-28 | 13F | Harbour Investments, Inc. | 113.105 | 70,88 | 2.923 | 70,58 | ||||
| 2025-07-14 | 13F | Park Avenue Securities Llc | 517.426 | 38,74 | 13 | 44,44 | ||||
| 2025-08-14 | 13F | Novus Advisors, Llc | 133.562 | 23,66 | 3.451 | 23,47 | ||||
| 2025-07-29 | 13F | Private Trust Co Na | 1.848 | 23,36 | 48 | 23,68 | ||||
| 2025-08-13 | 13F | GeoWealth Management, LLC | 48.375 | 27,87 | 1.250 | 27,68 | ||||
| 2025-05-12 | 13F | Aveo Capital Partners, LLC | 0 | -100,00 | 0 | -100,00 | ||||
| 2025-07-29 | 13F | Stratos Wealth Partners, LTD. | 15.626 | 404 | ||||||
| 2025-08-08 | 13F | Hibernia Wealth Partners, LLC | 692.390 | 94,35 | 17.891 | 94,07 | ||||
| 2025-08-14 | 13F | Susquehanna International Group, Llp | 11.438 | 296 | ||||||
| 2025-08-15 | 13F | Morgan Stanley | 0 | -100,00 | 0 | |||||
| 2025-08-11 | 13F | Outlook Wealth Advisors, LLC | 50.194 | 226,53 | 1.297 | 226,70 | ||||
| 2025-08-12 | 13F | Argent Trust Co | 60.882 | -2,04 | 1.573 | -2,18 | ||||
| 2025-07-31 | 13F | Cambridge Investment Research Advisors, Inc. | 18.524 | 1,42 | 0 | |||||
| 2025-08-12 | 13F | Maripau Wealth Management Llc | 12.084 | 14,26 | 312 | 14,29 | ||||
| 2025-08-13 | 13F | Townsquare Capital Llc | 0 | -100,00 | 0 | |||||
| 2025-08-12 | 13F | LPL Financial LLC | 4.213.386 | 33,02 | 108.874 | 32,81 | ||||
| 2025-08-11 | 13F | Private Advisor Group, LLC | 16.653 | 32,61 | 430 | 32,72 | ||||
| 2025-07-09 | 13F | VisionPoint Advisory Group, LLC | 27.462 | 2,40 | 710 | 2,16 | ||||
| 2025-08-14 | 13F | Raymond James Financial Inc | 15.511 | -0,19 | 401 | -0,50 | ||||
| 2025-07-09 | 13F | Triumph Capital Management | 9.282 | 240 | ||||||
| 2025-05-12 | 13F | Virtu Financial LLC | 0 | -100,00 | 0 | |||||
| 2025-07-15 | 13F | FLP Wealth Management, LLC | 0 | -100,00 | 0 | |||||
| 2025-07-22 | 13F | Aspire Private Capital, LLC | 852.384 | 9,51 | 22.026 | 9,34 | ||||
| 2025-08-14 | 13F | GWM Advisors LLC | 827.243 | 14,73 | 21.376 | 14,55 | ||||
| 2025-05-14 | 13F | Northwestern Mutual Wealth Management Co | 0 | -100,00 | 0 | |||||
| 2025-08-12 | 13F | Absolute Capital Management, LLC | 16.996 | 21,97 | 439 | 21,94 | ||||
| 2025-08-12 | 13F | PKS Advisory Services, LLC | 8.135 | 208 | ||||||
| 2025-08-04 | 13F | Family Wealth Group, LLC | 12.992 | -8,00 | 336 | -8,22 | ||||
| 2025-08-14 | 13F | Mariner, LLC | 8.505 | 0,00 | 220 | -0,45 | ||||
| 2025-07-10 | 13F | Signal Advisors Wealth, LLC | 217.318 | 116,08 | 5.615 | 115,80 | ||||
| 2025-07-23 | 13F | REAP Financial Group, LLC | 59 | 0,00 | 2 | 0,00 | ||||
| 2025-08-05 | 13F | Landmark Wealth Management, Inc. | 446.112 | 67,56 | 11.528 | 67,30 | ||||
| 2025-08-12 | 13F | Change Path, LLC | 123.636 | 72,06 | 3.195 | 71,81 | ||||
| 2025-08-12 | 13F | Quadcap Wealth Management, LLC | 21.704 | 0,00 | 561 | -0,18 | ||||
| 2025-07-11 | 13F | International Private Wealth Advisors LLC | 75.158 | 30,48 | 1.942 | 30,34 | ||||
| 2025-08-14 | 13F | Synovus Financial Corp | 15.605 | 5,80 | 403 | 5,77 | ||||
| 2025-08-11 | 13F | Covestor Ltd | 199 | 93,20 | 0 | |||||
| 2025-07-25 | 13F | Richardson Financial Services Inc. | 4.196 | 35,09 | 108 | 35,00 | ||||
| 2025-08-01 | 13F | FSA Advisors, Inc. | 14.695 | 17,45 | 380 | 17,34 | ||||
| 2025-08-12 | 13F | Global Retirement Partners, LLC | 2.713 | 9,44 | 70 | 12,90 | ||||
| 2025-09-04 | 13F/A | Advisor Group Holdings, Inc. | 8.441 | 521,12 | 218 | 522,86 | ||||
| 2025-04-22 | 13F | Castleview Partners, Llc | 0 | -100,00 | 0 | |||||
| 2025-07-25 | 13F | Atria Wealth Solutions, Inc. | 0 | -100,00 | 0 | |||||
| 2025-08-06 | 13F | Mascagni Wealth Management, Inc. | 7.961 | 0,32 | 206 | 0,00 | ||||
| 2025-07-29 | 13F | Balboa Wealth Partners | 90.923 | 13,79 | 2.349 | 13,64 | ||||
| 2025-07-24 | 13F | MSH Capital Advisors LLC | 9.828 | 17,13 | 254 | 16,59 | ||||
| 2025-08-07 | 13F | Nwam Llc | 10.883 | 0,00 | 279 | -1,07 | ||||
| 2025-08-05 | 13F | Financial Sense Advisors, Inc. | 8.099 | -12,21 | 209 | -12,18 | ||||
| 2025-08-14 | 13F | Hilltop Holdings Inc. | 9.040 | 234 | ||||||
| 2025-07-17 | 13F | Kelly Financial Services LLC | 24.593 | -0,93 | 635 | -1,09 | ||||
| 2025-07-10 | 13F | Global Financial Private Client, LLC | 40.268 | 42,23 | 1.041 | 42,08 | ||||
| 2025-08-04 | 13F | Creative Financial Designs Inc /adv | 9.643 | 46,80 | 249 | 46,47 | ||||
| 2025-08-11 | 13F | Aptus Capital Advisors, LLC | 1.706 | 44 | ||||||
| 2025-07-11 | 13F | Farther Finance Advisors, LLC | 2.688 | 66,96 | 69 | 68,29 | ||||
| 2025-07-29 | 13F | Empirical Asset Management, LLC | 15.674 | 6,48 | 405 | 6,58 | ||||
| 2025-07-14 | 13F | Iams Wealth Management, Llc | 57.138 | 40,84 | 1.476 | 40,71 | ||||
| 2025-08-14 | 13F | Citadel Advisors Llc | 0 | -100,00 | 0 | |||||
| 2025-08-14 | 13F | UBS Group AG | 509 | 13 | ||||||
| 2025-07-28 | 13F | Axxcess Wealth Management, Llc | 226.716 | 14,32 | 5.858 | 14,15 | ||||
| 2025-05-02 | 13F | Capital A Wealth Management, LLC | 119 | -75,36 | 3 | -75,00 | ||||
| 2025-08-01 | 13F | Envestnet Asset Management Inc | 2.354.254 | 35,83 | 60.834 | 35,62 | ||||
| 2025-07-17 | 13F | Worth Financial Advisory Group, LLC | 0 | -100,00 | 0 | |||||
| 2025-07-28 | 13F | Frazier Financial Advisors, LLC | 60 | 0,00 | 2 | 0,00 | ||||
| 2025-08-14 | 13F | Jane Street Group, Llc | 0 | -100,00 | 0 |