Grundlæggende statistik
| Institutionelle ejere | 70 total, 70 long only, 0 short only, 0 long/short - change of 9,23% MRQ |
| Gennemsnitlig porteføljeallokering | 0.1970 % - change of 27,87% MRQ |
| Institutionelle aktier (lange) | 4.281.967 (ex 13D/G) - change of -0,22MM shares -4,87% MRQ |
| Institutionel værdi (lang) | $ 149.147 USD ($1000) |
Institutionelt ejerskab og aktionærer
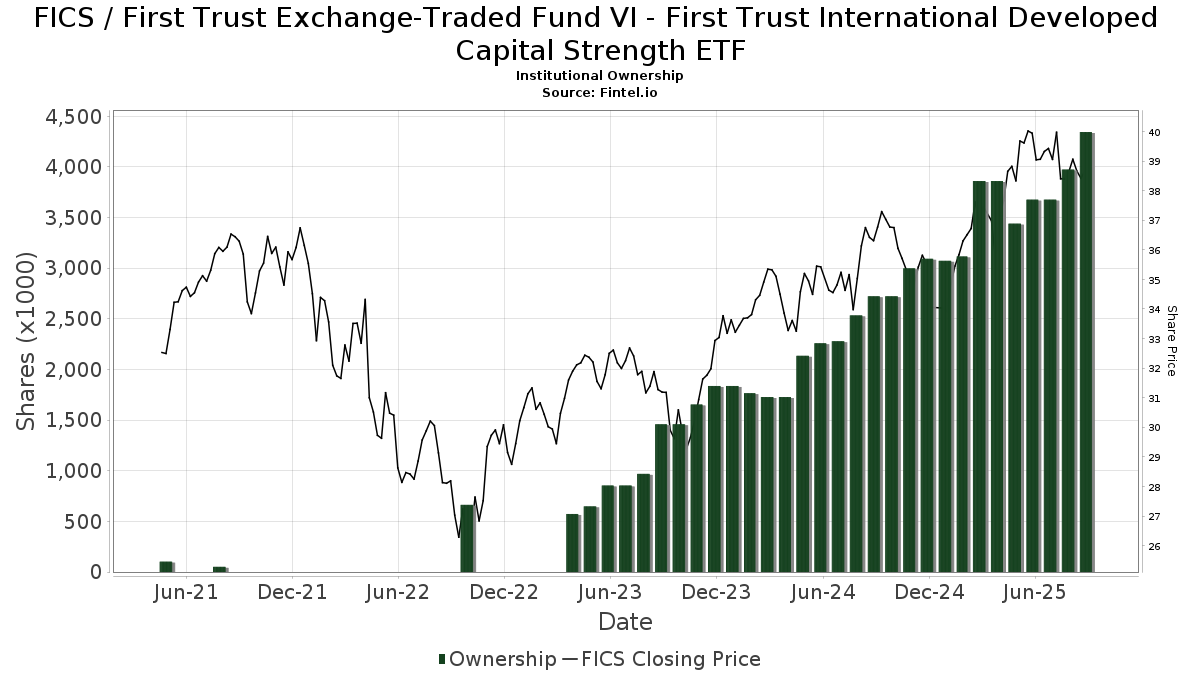
First Trust Exchange-Traded Fund VI - First Trust International Developed Capital Strength ETF (US:FICS) har 70 institutionelle ejere og aktionærer, der har indsendt 13D/G- eller 13F-formularer til Securities Exchange Commission (SEC). Disse institutioner har i alt 4,281,967 aktier. Største aktionærer omfatter LPL Financial LLC, Cetera Investment Advisers, Cwm, Llc, Key FInancial Inc, Chris Bulman Inc, Brookstone Capital Management, Raymond James Financial Inc, Golden State Wealth Management, LLC, Centennial Wealth Advisory LLC, and VestGen Advisors, LLC .
First Trust Exchange-Traded Fund VI - First Trust International Developed Capital Strength ETF (NasdaqGM:FICS) institutionel ejerskabsstruktur viser aktuelle positioner i virksomheden efter institutioner og fonde, samt seneste ændringer i positionsstørrelse. Større aktionærer kan omfatte individuelle investorer, investeringsforeninger, hedgefonde eller institutioner. Skema 13D angiver, at investoren besidder (eller besidder) mere end 5 % af virksomheden og har til hensigt (eller har til hensigt at) aktivt at forfølge en ændring i forretningsstrategi. Skema 13G indikerer en passiv investering på over 5%.
The share price as of March 11, 2026 is 40,01 / share. Previously, on March 12, 2025, the share price was 36,92 / share. This represents an increase of 8,36% over that period.
Fondens stemningsscore
Fund Sentiment Score (fka Ownership Accumulation Score) finder de aktier, der bliver mest købt af fonde. Det er resultatet af en sofistikeret, multi-faktor kvantitativ model, der identificerer virksomheder med de højeste niveauer af institutionel akkumulering. Scoringsmodellen bruger en kombination af den samlede stigning i oplyste ejere, ændringerne i porteføljeallokeringer i disse ejere og andre målinger. Tallet går fra 0 til 100, hvor højere tal indikerer et højere niveau af akkumulering for sine jævnaldrende, og 50 er gennemsnittet.
Opdateringsfrekvens: Dagligt
Se Ownership Explorer, som giver en liste over højest rangerende virksomheder.
AI+ Ask Fintel’s AI assistant about First Trust Exchange-Traded Fund VI - First Trust International Developed Capital Strength ETF.
Select a question to share a public post with an AI-crafted answer.
Thinking of good questions…
Institutionel Put/Call-forhold
Ud over at indberette standardaktie- og gældsudstedelser skal institutter med mere end 100 mill. aktiver under forvaltning også oplyse deres put- og call-optionsbeholdninger. Da salgsoptioner generelt indikerer negativ stemning, og købsoptioner indikerer positiv stemning, kan vi få en fornemmelse af den overordnede institutionelle stemning ved at plotte forholdet mellem put og kald. Diagrammet til højre viser det historiske put/call-forhold for dette instrument.
Brug af Put/Call Ratio som en indikator for investorernes stemning overvinder en af de vigtigste mangler ved at bruge totalt institutionelt ejerskab, som er, at en betydelig mængde af aktiver under forvaltning investeres passivt for at spore indekser. Passivt forvaltede fonde køber typisk ikke optioner, så indikatoren for put/call-forholdet følger mere nøje følelsen af aktivt forvaltede fonde.
13F og NPORT arkivering
Detaljer om 13F-arkivering er gratis. Detaljer om NP-ansøgninger kræver et premium-medlemskab. Grønne rækker angiver nye positioner. Røde rækker angiver lukkede positioner. Klik på linket ikon for at se den fulde transaktionshistorik.
Opgrader
for at låse premium-data op og eksportere til Excel ![]() .
.
| Fil dato | Kilde | Investor | Type | Gennemsnitlig pris (Øst) |
Aktier | Δ Aktier (%) |
Rapporteret Værdi ($1000) |
Δ Værdi (%) |
Port Alloc (%) |
|
|---|---|---|---|---|---|---|---|---|---|---|
| 2026-02-09 | 13F | Key FInancial Inc | 247.020 | 5,48 | 9.908 | 10,28 | ||||
| 2026-01-29 | 13F | Sanctuary Advisors, LLC | 34.164 | 23,02 | 1.370 | 29,37 | ||||
| 2026-02-11 | 13F | J.w. Cole Advisors, Inc. | 6.332 | -10,12 | 254 | -5,60 | ||||
| 2026-02-18 | 13F | GWM Advisors LLC | 31.152 | -25,91 | 1.250 | -22,08 | ||||
| 2026-01-20 | 13F | Midwest Financial Group LLC | 64.793 | -11,62 | 2.599 | -7,08 | ||||
| 2026-02-10 | 13F | Envestnet Asset Management Inc | 47.672 | 4,97 | 1.912 | 10,39 | ||||
| 2025-11-14 | 13F | Gts Securities Llc | 0 | -100,00 | 0 | -100,00 | ||||
| 2026-02-17 | 13F | Citadel Advisors Llc | 0 | -100,00 | 0 | |||||
| 2026-01-20 | 13F | Sovran Advisors, LLC | 9.230 | 0,00 | 372 | 4,51 | ||||
| 2026-02-11 | 13F | Janney Montgomery Scott LLC | 51.696 | 9,93 | 2 | 100,00 | ||||
| 2026-02-17 | 13F | Susquehanna International Group, Llp | 33.398 | 1.340 | ||||||
| 2026-02-12 | 13F | Commonwealth Equity Services, Llc | 55.138 | -0,44 | 2.212 | 110.450,00 | ||||
| 2026-01-23 | 13F | Farther Finance Advisors, LLC | 1.664 | -42,38 | 67 | -40,00 | ||||
| 2026-02-10 | 13F | REAP Financial Group, LLC | 724 | 0,00 | 29 | 7,41 | ||||
| 2026-01-30 | 13F | Us Bancorp \de\ | 1.191 | 0,00 | 48 | 4,44 | ||||
| 2026-01-14 | 13F | Centennial Wealth Advisory LLC | 98.851 | 8,47 | 3.965 | 14,04 | ||||
| 2026-01-26 | 13F | Pursuit Wealth Management LLC | 75.792 | 3.040 | ||||||
| 2026-02-11 | 13F | Ameritas Investment Partners, Inc. | 20.420 | 819 | ||||||
| 2025-11-14 | 13F | Capital Analysts, Inc. | 0 | -100,00 | 0 | |||||
| 2026-02-04 | 13F | Drive Wealth Management, Llc | 17.914 | 14,03 | 719 | 19,87 | ||||
| 2026-01-22 | 13F | Triad Wealth Partners, LLC | 9.615 | 386 | ||||||
| 2026-02-19 | 13F | Claris Financial LLC | 5.440 | 218 | ||||||
| 2026-01-29 | 13F | Nbc Securities, Inc. | 1.643 | 41,64 | 66 | 47,73 | ||||
| 2026-02-17 | 13F | VestGen Advisors, LLC | 88.344 | 3.544 | ||||||
| 2026-01-29 | 13F | Comerica Bank | 11.615 | 0,02 | 466 | 5,20 | ||||
| 2026-02-13 | 13F | Resources Investment Advisors, LLC. | 7.472 | -18,39 | 300 | -14,33 | ||||
| 2026-02-14 | 13F | Rockefeller Capital Management L.P. | 14.150 | -0,70 | 568 | 4,42 | ||||
| 2026-02-17 | 13F | Gladstone Institutional Advisory LLC | 13.742 | 17,62 | 551 | 23,82 | ||||
| 2026-01-26 | 13F | Cwm, Llc | 370.620 | 2,87 | 15 | 7,69 | ||||
| 2026-02-06 | 13F | Northbridge Financial Group, Llc | 34.068 | 1.367 | ||||||
| 2026-02-09 | 13F | Harbour Investments, Inc. | 59.206 | 5,65 | 2.375 | 11,09 | ||||
| 2026-02-17 | 13F | Fmr Llc | 143 | 0,00 | 6 | 0,00 | ||||
| 2026-01-26 | 13F | Private Trust Co Na | 523 | 0,00 | 21 | 5,26 | ||||
| 2026-01-28 | 13F | Barrett & Company, Inc. | 2.000 | 0,00 | 80 | 5,26 | ||||
| 2026-02-13 | 13F | Morgan Stanley | 2.676 | -6,34 | 107 | -0,93 | ||||
| 2026-02-12 | 13F | Steward Partners Investment Advisory, Llc | 3.911 | 157 | ||||||
| 2026-02-17 | 13F | Advisor Group Holdings, Inc. | 47.198 | -72,84 | 1.894 | -71,75 | ||||
| 2026-02-10 | 13F/A | Northwestern Mutual Wealth Management Co | 1.851 | 42,17 | 74 | 51,02 | ||||
| 2026-02-12 | 13F | Jane Street Group, Llc | 78.963 | 156,92 | 3.167 | 170,22 | ||||
| 2026-01-30 | 13F | Sigma Planning Corp | 25.060 | 22,51 | 1.005 | 28,85 | ||||
| 2026-02-12 | 13F | IFC & Insurance Marketing, Inc. | 5.084 | 0 | ||||||
| 2026-01-22 | 13F | Columbia Advisory Partners Llc | 6.759 | -9,83 | 271 | -4,91 | ||||
| 2026-02-12 | 13F | Principal Securities, Inc. | 0 | -100,00 | 0 | |||||
| 2025-11-06 | 13F | Stratos Wealth Partners, LTD. | 0 | -100,00 | 0 | |||||
| 2026-02-06 | 13F | Global Retirement Partners, LLC | 10.772 | -0,50 | 432 | 4,85 | ||||
| 2026-02-12 | 13F | Summit Financial, LLC | 37.162 | 24,04 | 1.491 | 30,47 | ||||
| 2026-02-17 | 13F | Coppell Advisory Solutions LLC | 31.704 | 9,31 | 1.277 | 16,62 | ||||
| 2026-02-05 | 13F | Cambridge Investment Research Advisors, Inc. | 51.629 | 1,82 | 2 | 100,00 | ||||
| 2026-02-06 | 13F | VSM Wealth Advisory, LLC | 410 | 0,00 | 16 | 6,67 | ||||
| 2026-01-29 | 13F | UBS Group AG | 497 | -93,90 | 20 | -93,87 | ||||
| 2026-02-13 | 13F | Kestra Advisory Services, LLC | 4.425 | 177 | ||||||
| 2026-01-26 | 13F | AE Wealth Management LLC | 333 | 270,00 | 13 | 333,33 | ||||
| 2026-02-13 | 13F | SRS Capital Advisors, Inc. | 8.683 | 348 | ||||||
| 2026-01-26 | 13F | Nations Financial Group Inc, /ia/ /adv | 13.068 | -15,86 | 524 | -11,49 | ||||
| 2026-02-13 | 13F | Stifel Financial Corp | 43.199 | 7,37 | 1.733 | 12,91 | ||||
| 2026-01-12 | 13F | World Equity Group, Inc. | 0 | -100,00 | 0 | -100,00 | ||||
| 2026-02-11 | 13F | Gateway Wealth Partners, LLC | 20.524 | 0,35 | 823 | 5,51 | ||||
| 2026-02-10 | 13F | Founders Financial Securities Llc | 8.829 | 17,34 | 354 | 23,78 | ||||
| 2026-02-11 | 13F | LPL Financial LLC | 1.239.451 | 0,07 | 49.715 | 5,23 | ||||
| 2026-02-26 | 13F | TD Capital Management LLC | 2.391 | 0,08 | 96 | 4,40 | ||||
| 2026-01-15 | 13F | Brookstone Capital Management | 166.462 | 4,75 | 6.677 | 10,15 | ||||
| 2025-11-04 | 13F | RiverTree Advisors, LLC | 0 | -100,00 | 0 | |||||
| 2026-02-03 | 13F | International Assets Investment Management, Llc | 5.895 | -13,46 | 236 | -11,94 | ||||
| 2026-02-17 | 13F | Raymond James Financial Inc | 124.812 | -68,49 | 5.006 | -66,87 | ||||
| 2026-01-23 | 13F | DHJJ Financial Advisors, Ltd. | 21.824 | 9,78 | 875 | 15,44 | ||||
| 2026-02-03 | 13F | We Are One Seven, LLC | 15.640 | 179,54 | 627 | 194,37 | ||||
| 2026-02-17 | 13F | Cetera Investment Advisers | 406.386 | 1,71 | 16.300 | 6,96 | ||||
| 2026-02-13 | 13F | Golden State Wealth Management, LLC | 110.525 | 0,92 | 4.433 | 6,13 | ||||
| 2026-02-13 | 13F | Wells Fargo & Company/mn | 0 | -100,00 | 0 | |||||
| 2026-02-12 | 13F | Wedbush Securities Inc | 84.482 | 599,41 | 3 | |||||
| 2026-02-06 | 13F | IFP Advisors, Inc | 6.462 | 126,02 | 259 | 137,61 | ||||
| 2026-02-10 | 13F | Moors & Cabot, Inc. | 32.918 | 6,79 | 1.320 | 12,34 | ||||
| 2026-02-11 | 13F | Jpmorgan Chase & Co | 5.283 | -2,35 | 212 | 2,43 | ||||
| 2025-11-06 | 13F | Ameritas Advisory Services, LLC | 0 | -100,00 | 0 | |||||
| 2026-02-17 | 13F | Private Advisor Group, LLC | 38.477 | 9,48 | 1.543 | 15,15 | ||||
| 2026-02-05 | 13F | Tucker Asset Management Llc | 1.633 | 2,25 | 66 | 8,33 | ||||
| 2026-02-10 | 13F | Foundations Investment Advisors, LLC | 18.479 | 43,66 | 741 | 51,22 | ||||
| 2026-01-14 | 13F | Chris Bulman Inc | 182.135 | 12,15 | 7.306 | 17,94 | ||||
| 2026-02-13 | 13F | Wilkerson Advisory Group LLC | 243 | 10 | ||||||
| 2026-02-10 | 13F | IFG Advisory, LLC | 0 | -100,00 | 0 |