Grundlæggende statistik
| Institutionelle ejere | 55 total, 55 long only, 0 short only, 0 long/short - change of -12,50% MRQ |
| Gennemsnitlig porteføljeallokering | 0.1131 % - change of 23,68% MRQ |
| Institutionelle aktier (lange) | 1.402.365 (ex 13D/G) - change of 0,01MM shares 0,92% MRQ |
| Institutionel værdi (lang) | $ 34.265 USD ($1000) |
Institutionelt ejerskab og aktionærer
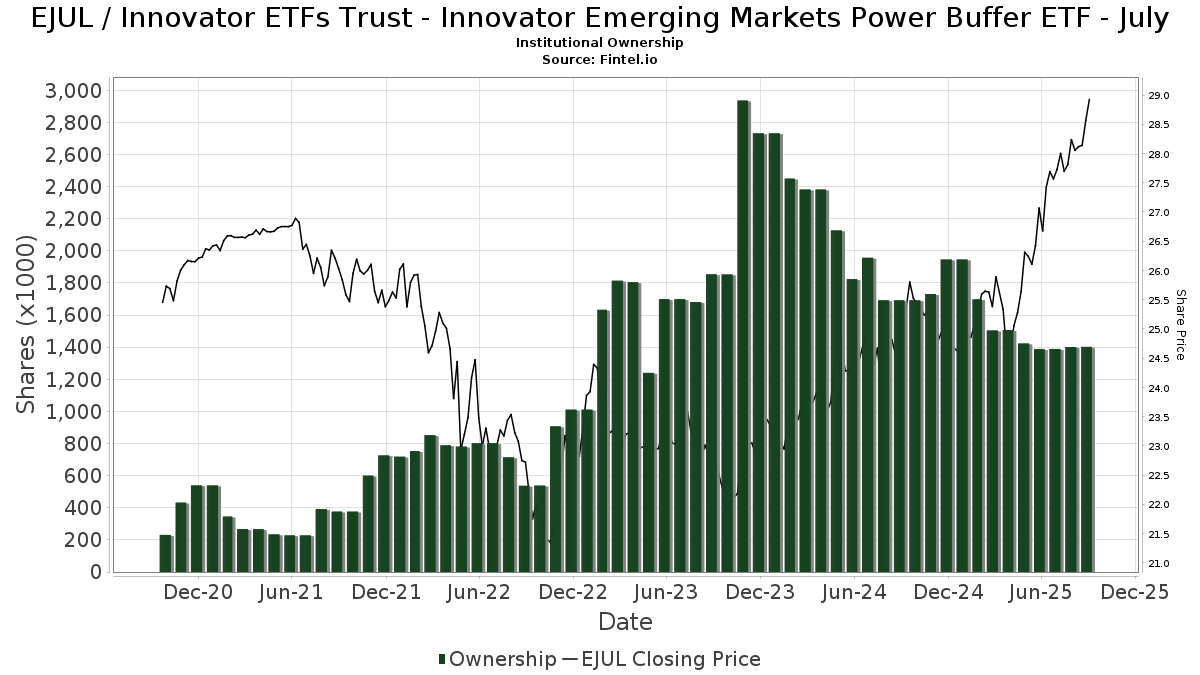
Innovator ETFs Trust - Innovator Emerging Markets Power Buffer ETF - July (US:EJUL) har 55 institutionelle ejere og aktionærer, der har indsendt 13D/G- eller 13F-formularer til Securities Exchange Commission (SEC). Disse institutioner har i alt 1,402,365 aktier. Største aktionærer omfatter Berger Financial Group, Inc, Corrado Advisors, Llc, HFG Wealth Management, LLC, Stratos Wealth Advisors, LLC, Advisor Group Holdings, Inc., Principal Securities, Inc., Kestra Advisory Services, LLC, Commonwealth Equity Services, Llc, Cypress Wealth Services, LLC, and Diligent Investors, LLC .
Innovator ETFs Trust - Innovator Emerging Markets Power Buffer ETF - July (ARCA:EJUL) institutionel ejerskabsstruktur viser aktuelle positioner i virksomheden efter institutioner og fonde, samt seneste ændringer i positionsstørrelse. Større aktionærer kan omfatte individuelle investorer, investeringsforeninger, hedgefonde eller institutioner. Skema 13D angiver, at investoren besidder (eller besidder) mere end 5 % af virksomheden og har til hensigt (eller har til hensigt at) aktivt at forfølge en ændring i forretningsstrategi. Skema 13G indikerer en passiv investering på over 5%.
The share price as of September 12, 2025 is 28,73 / share. Previously, on September 16, 2024, the share price was 24,76 / share. This represents an increase of 16,07% over that period.
Fondens stemningsscore
Fund Sentiment Score (fka Ownership Accumulation Score) finder de aktier, der bliver mest købt af fonde. Det er resultatet af en sofistikeret, multi-faktor kvantitativ model, der identificerer virksomheder med de højeste niveauer af institutionel akkumulering. Scoringsmodellen bruger en kombination af den samlede stigning i oplyste ejere, ændringerne i porteføljeallokeringer i disse ejere og andre målinger. Tallet går fra 0 til 100, hvor højere tal indikerer et højere niveau af akkumulering for sine jævnaldrende, og 50 er gennemsnittet.
Opdateringsfrekvens: Dagligt
Se Ownership Explorer, som giver en liste over højest rangerende virksomheder.
Institutionel Put/Call-forhold
Ud over at indberette standardaktie- og gældsudstedelser skal institutter med mere end 100 mill. aktiver under forvaltning også oplyse deres put- og call-optionsbeholdninger. Da salgsoptioner generelt indikerer negativ stemning, og købsoptioner indikerer positiv stemning, kan vi få en fornemmelse af den overordnede institutionelle stemning ved at plotte forholdet mellem put og kald. Diagrammet til højre viser det historiske put/call-forhold for dette instrument.
Brug af Put/Call Ratio som en indikator for investorernes stemning overvinder en af de vigtigste mangler ved at bruge totalt institutionelt ejerskab, som er, at en betydelig mængde af aktiver under forvaltning investeres passivt for at spore indekser. Passivt forvaltede fonde køber typisk ikke optioner, så indikatoren for put/call-forholdet følger mere nøje følelsen af aktivt forvaltede fonde.
13F og NPORT arkivering
Detaljer om 13F-arkivering er gratis. Detaljer om NP-ansøgninger kræver et premium-medlemskab. Grønne rækker angiver nye positioner. Røde rækker angiver lukkede positioner. Klik på linket ikon for at se den fulde transaktionshistorik.
Opgrader
for at låse premium-data op og eksportere til Excel ![]() .
.
| Fil dato | Kilde | Investor | Type | Gennemsnitlig pris (Øst) |
Aktier | Δ Aktier (%) |
Rapporteret Værdi ($1000) |
Δ Værdi (%) |
Port Alloc (%) |
|
|---|---|---|---|---|---|---|---|---|---|---|
| 2025-08-14 | 13F | Old Mission Capital Llc | 0 | -100,00 | 0 | |||||
| 2025-08-08 | 13F | Cetera Investment Advisers | 44.243 | 0,54 | 1.225 | 10,17 | ||||
| 2025-07-09 | 13F | HFG Wealth Management, LLC | 99.184 | -2,67 | 2.506 | -0,32 | ||||
| 2025-07-10 | 13F | NorthCrest Asset Manangement, LLC | 8.041 | 223 | ||||||
| 2025-08-01 | 13F | Envestnet Asset Management Inc | 23.657 | 57,82 | 655 | 73,02 | ||||
| 2025-07-28 | 13F | Cypress Wealth Services, LLC | 49.367 | 0,00 | 1.366 | 9,54 | ||||
| 2025-08-14 | 13F | Citadel Advisors Llc | 12.371 | -4,42 | 342 | 4,91 | ||||
| 2025-08-12 | 13F | MAI Capital Management | 0 | -100,00 | 0 | |||||
| 2025-08-14 | 13F | Helium Advisors LLC | 20.143 | 0,00 | 558 | 9,65 | ||||
| 2025-07-29 | 13F | Ifrah Financial Services, Inc. | 21.069 | -1,16 | 583 | 8,36 | ||||
| 2025-08-14 | 13F | Sunbelt Securities, Inc. | 2.895 | 1,72 | 71 | 0,00 | ||||
| 2025-05-15 | 13F | Royal Bank Of Canada | 0 | -100,00 | 0 | |||||
| 2025-08-12 | 13F | Tradition Wealth Management, LLC | 19.579 | 0,00 | 542 | 9,51 | ||||
| 2025-08-06 | 13F | AE Wealth Management LLC | 1.085 | 0,00 | 30 | 11,11 | ||||
| 2025-05-19 | 13F | SageView Advisory Group, LLC | 0 | -100,00 | 0 | -100,00 | ||||
| 2025-08-13 | 13F | Capital Analysts, Inc. | 17.678 | -1,59 | 0 | |||||
| 2025-08-14 | 13F | CoreCap Advisors, LLC | 7.406 | 7,26 | 205 | 17,24 | ||||
| 2025-05-12 | 13F | Fmr Llc | 0 | -100,00 | 0 | |||||
| 2025-08-07 | 13F | Resources Investment Advisors, LLC. | 8.000 | 0,00 | 221 | 9,41 | ||||
| 2025-08-14 | 13F | UBS Group AG | 0 | -100,00 | 0 | |||||
| 2025-08-12 | 13F | Steward Partners Investment Advisory, Llc | 7.947 | 5,65 | 220 | 15,26 | ||||
| 2025-08-19 | 13F | Cape Investment Advisory, Inc. | 17.232 | 0,00 | 477 | 9,43 | ||||
| 2025-07-31 | 13F | Whipplewood Advisors, LLC | 3.484 | -87,09 | 96 | 9,09 | ||||
| 2025-07-25 | 13F | Cwm, Llc | 44.090 | -0,79 | 1 | 0,00 | ||||
| 2025-08-08 | 13F | Compass Financial Services Inc | 744 | 0,00 | 21 | 11,11 | ||||
| 2025-07-24 | 13F | Stonebridge Financial Group, LLC | 0 | -100,00 | 0 | |||||
| 2025-07-24 | 13F | IFP Advisors, Inc | 18.769 | -7,06 | 520 | 1,76 | ||||
| 2025-08-14 | 13F | Raymond James Financial Inc | 10.101 | -53,23 | 280 | -48,81 | ||||
| 2025-07-11 | 13F | Farther Finance Advisors, LLC | 1.164 | -41,18 | 32 | -36,00 | ||||
| 2025-07-29 | 13F | Straight Path Wealth Management | 19.675 | 545 | ||||||
| 2025-07-22 | 13F | Berger Financial Group, Inc | 131.279 | -1,28 | 3.634 | 8,16 | ||||
| 2025-08-14 | 13F | Susquehanna International Group, Llp | 0 | -100,00 | 0 | |||||
| 2025-07-17 | 13F | Janney Montgomery Scott LLC | 10.679 | 0,00 | 0 | |||||
| 2025-07-22 | 13F | Diligent Investors, LLC | 45.504 | -2,64 | 1.260 | 6,69 | ||||
| 2025-08-04 | 13F | Prairie Wealth Advisors, Inc. | 13.949 | 0,00 | 386 | 9,66 | ||||
| 2025-07-21 | 13F | Triad Wealth Partners, LLC | 17.433 | 94,80 | 483 | 113,27 | ||||
| 2025-07-28 | 13F | Harbour Investments, Inc. | 0 | -100,00 | 0 | |||||
| 2025-07-10 | 13F | Wealth Enhancement Advisory Services, Llc | 24.713 | 0,00 | 685 | 9,78 | ||||
| 2025-07-25 | 13F | Atria Wealth Solutions, Inc. | 0 | -100,00 | 0 | |||||
| 2025-07-31 | 13F | Cambridge Investment Research Advisors, Inc. | 16.437 | 36,67 | 0 | |||||
| 2025-08-12 | 13F | LPL Financial LLC | 23.326 | 129,84 | 646 | 151,95 | ||||
| 2025-08-12 | 13F | Winnow Wealth Llc | 0 | -100,00 | 0 | -100,00 | ||||
| 2025-07-18 | 13F | Bridge Generations Wealth Management Llc | 23 | 0,00 | 1 | |||||
| 2025-08-11 | 13F | Principal Securities, Inc. | 71.395 | -1,41 | 1.976 | 10,64 | ||||
| 2025-08-13 | 13F | BCJ Capital Management, LLC | 8.789 | -18,69 | 243 | -10,99 | ||||
| 2025-08-12 | 13F | Jacobi Capital Management LLC | 25.154 | 4,78 | 696 | 14,85 | ||||
| 2025-08-05 | 13F | WorthPointe, LLC | 15.448 | 0,00 | 428 | 9,49 | ||||
| 2025-08-15 | 13F | Kestra Advisory Services, LLC | 70.481 | 28,73 | 1.951 | 41,00 | ||||
| 2025-08-07 | 13F | PFG Advisors | 11.905 | 330 | ||||||
| 2025-08-13 | 13F | Northwestern Mutual Wealth Management Co | 1.034 | 29 | ||||||
| 2025-08-14 | 13F | Goldman Sachs Group Inc | 0 | -100,00 | 0 | |||||
| 2025-08-14 | 13F | Benjamin Edwards Inc | 8.618 | 239 | ||||||
| 2025-07-14 | 13F | AdvisorNet Financial, Inc | 391 | 0,00 | 11 | 11,11 | ||||
| 2025-08-07 | 13F | Allworth Financial LP | 149 | 0,00 | 4 | 33,33 | ||||
| 2025-08-13 | 13F | EverSource Wealth Advisors, LLC | 21 | 0,00 | 1 | |||||
| 2025-07-21 | 13F | DHJJ Financial Advisors, Ltd. | 1.665 | 0,00 | 46 | 9,52 | ||||
| 2025-08-01 | 13F | Corrado Advisors, Llc | 120.879 | 38,72 | 3.346 | 51,98 | ||||
| 2025-07-31 | 13F | Schneider Downs Wealth Management Advisors, LP | 10.234 | 283 | ||||||
| 2025-08-08 | 13F | Avantax Advisory Services, Inc. | 23.823 | -7,88 | 659 | 0,92 | ||||
| 2025-08-06 | 13F | Commonwealth Equity Services, Llc | 65.742 | -11,15 | 2 | 0,00 | ||||
| 2025-08-11 | 13F | HighTower Advisors, LLC | 9.862 | 3,84 | 273 | 13,81 | ||||
| 2025-08-06 | 13F | Founders Financial Securities Llc | 9.441 | 261 | ||||||
| 2025-08-12 | 13F | Proequities, Inc. | 0 | 0 | ||||||
| 2025-07-22 | 13F | Global Strategic Investment Solutions, LLC | 24.847 | -15,61 | 688 | -7,54 | ||||
| 2025-07-29 | 13F | Stratos Wealth Advisors, LLC | 84.285 | -1,85 | 2.333 | 7,56 | ||||
| 2025-08-08 | 13F | Capital Investment Advisory Services, LLC | 1.098 | 0,00 | 30 | 11,11 | ||||
| 2025-09-04 | 13F/A | Advisor Group Holdings, Inc. | 77.896 | 16,47 | 2.156 | 27,59 | ||||
| 2025-08-12 | 13F | Jpmorgan Chase & Co | 0 | 0 | ||||||
| 2025-07-25 | 13F | Apollon Wealth Management, LLC | 0 | -100,00 | 0 | |||||
| 2025-08-14 | 13F | Financial Network Wealth Advisors LLC | 0 | -100,00 | 0 | |||||
| 2025-08-11 | 13F | WPWealth LLP | 17.941 | 15,00 | 497 | 25,89 | ||||
| 2025-07-30 | 13F | Onyx Bridge Wealth Group LLC | 0 | -100,00 | 0 | |||||
| 2025-08-14 | 13F | Wells Fargo & Company/mn | 0 | -100,00 | 0 | |||||
| 2025-08-11 | 13F | Atlantic Private Wealth, LLC | 0 | -100,00 | 0 |