Grundlæggende statistik
| Institutionelle ejere | 142 total, 142 long only, 0 short only, 0 long/short - change of 6,62% MRQ |
| Gennemsnitlig porteføljeallokering | 0.0767 % - change of -7,72% MRQ |
| Institutionelle aktier (lange) | 17.589.224 (ex 13D/G) - change of 0,26MM shares 1,50% MRQ |
| Institutionel værdi (lang) | $ 180.878 USD ($1000) |
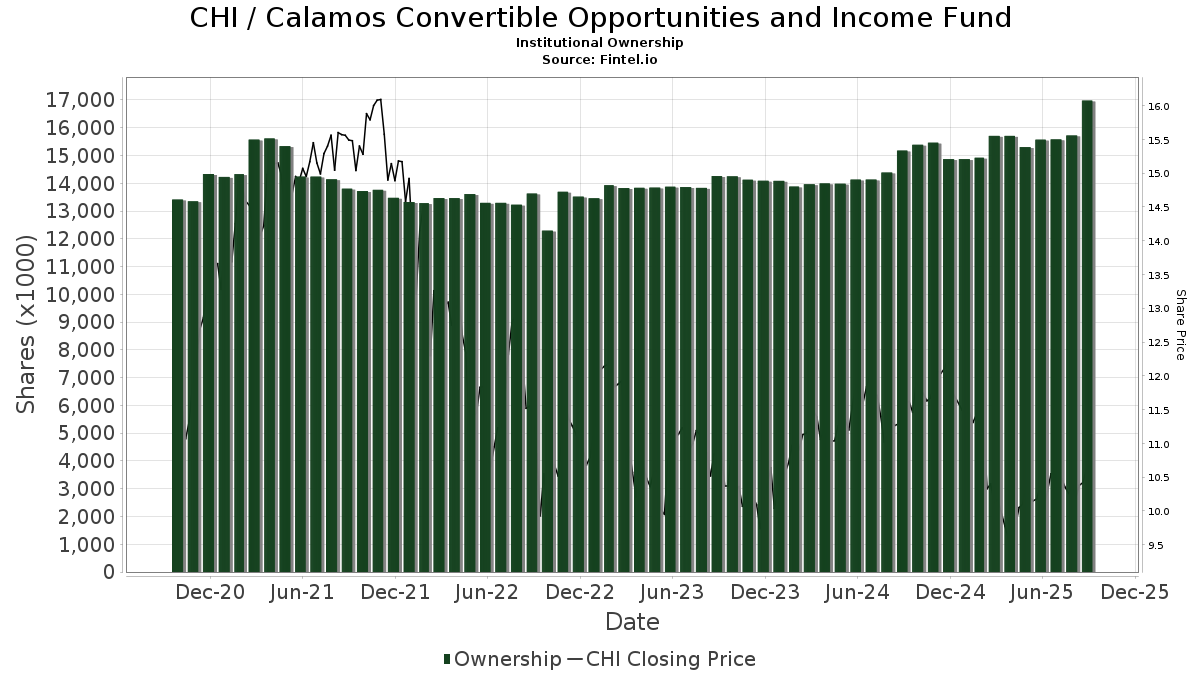
Institutionelt ejerskab og aktionærer
Calamos Convertible Opportunities and Income Fund (US:CHI) har 142 institutionelle ejere og aktionærer, der har indsendt 13D/G- eller 13F-formularer til Securities Exchange Commission (SEC). Disse institutioner har i alt 17,589,224 aktier. Største aktionærer omfatter Bank Of America Corp /de/, UBS Group AG, Morgan Stanley, Wells Fargo & Company/mn, D.a. Davidson & Co., LPL Financial LLC, Guggenheim Capital Llc, Ameriprise Financial Inc, Commonwealth Equity Services, Llc, and Baird Financial Group, Inc. .
Calamos Convertible Opportunities and Income Fund (NasdaqGS:CHI) institutionel ejerskabsstruktur viser aktuelle positioner i virksomheden efter institutioner og fonde, samt seneste ændringer i positionsstørrelse. Større aktionærer kan omfatte individuelle investorer, investeringsforeninger, hedgefonde eller institutioner. Skema 13D angiver, at investoren besidder (eller besidder) mere end 5 % af virksomheden og har til hensigt (eller har til hensigt at) aktivt at forfølge en ændring i forretningsstrategi. Skema 13G indikerer en passiv investering på over 5%.
The share price as of March 13, 2026 is 11,11 / share. Previously, on March 17, 2025, the share price was 10,00 / share. This represents an increase of 11,10% over that period.
Fondens stemningsscore
Fund Sentiment Score (fka Ownership Accumulation Score) finder de aktier, der bliver mest købt af fonde. Det er resultatet af en sofistikeret, multi-faktor kvantitativ model, der identificerer virksomheder med de højeste niveauer af institutionel akkumulering. Scoringsmodellen bruger en kombination af den samlede stigning i oplyste ejere, ændringerne i porteføljeallokeringer i disse ejere og andre målinger. Tallet går fra 0 til 100, hvor højere tal indikerer et højere niveau af akkumulering for sine jævnaldrende, og 50 er gennemsnittet.
Opdateringsfrekvens: Dagligt
Se Ownership Explorer, som giver en liste over højest rangerende virksomheder.
AI+ Ask Fintel’s AI assistant about Calamos Convertible Opportunities and Income Fund.
Select a question to share a public post with an AI-crafted answer.
Thinking of good questions…
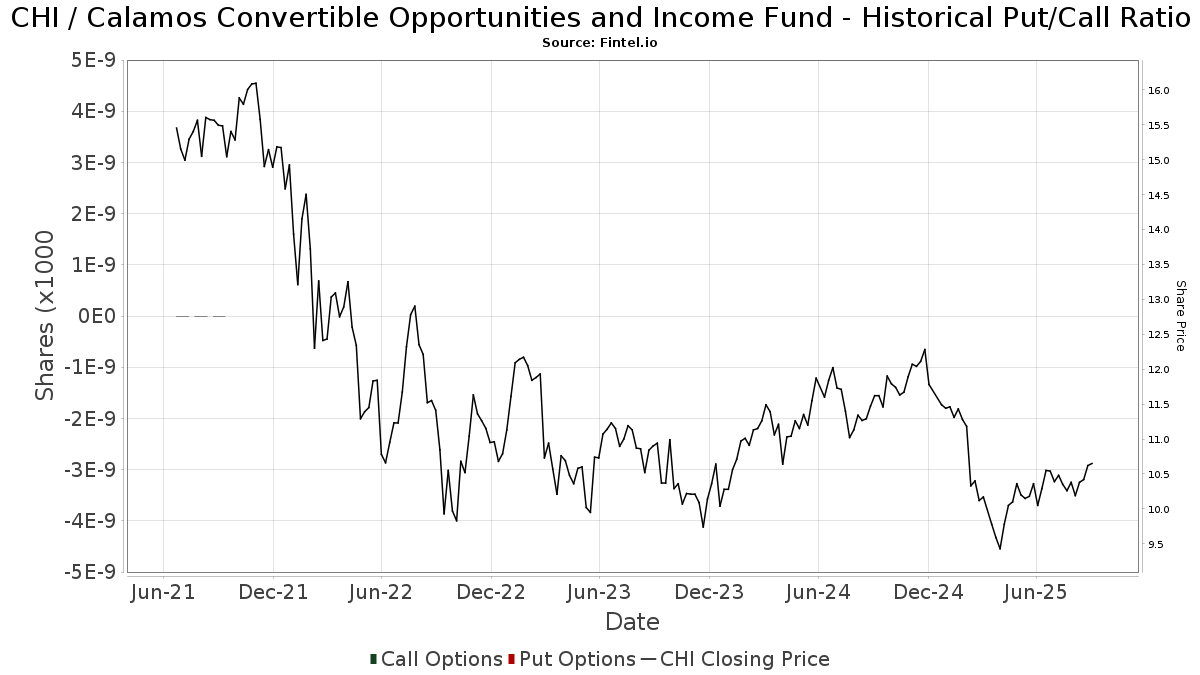
Institutionel Put/Call-forhold
Ud over at indberette standardaktie- og gældsudstedelser skal institutter med mere end 100 mill. aktiver under forvaltning også oplyse deres put- og call-optionsbeholdninger. Da salgsoptioner generelt indikerer negativ stemning, og købsoptioner indikerer positiv stemning, kan vi få en fornemmelse af den overordnede institutionelle stemning ved at plotte forholdet mellem put og kald. Diagrammet til højre viser det historiske put/call-forhold for dette instrument.
Brug af Put/Call Ratio som en indikator for investorernes stemning overvinder en af de vigtigste mangler ved at bruge totalt institutionelt ejerskab, som er, at en betydelig mængde af aktiver under forvaltning investeres passivt for at spore indekser. Passivt forvaltede fonde køber typisk ikke optioner, så indikatoren for put/call-forholdet følger mere nøje følelsen af aktivt forvaltede fonde.
13F og NPORT arkivering
Detaljer om 13F-arkivering er gratis. Detaljer om NP-ansøgninger kræver et premium-medlemskab. Grønne rækker angiver nye positioner. Røde rækker angiver lukkede positioner. Klik på linket ikon for at se den fulde transaktionshistorik.
Opgrader
for at låse premium-data op og eksportere til Excel ![]() .
.
| Fil dato | Kilde | Investor | Type | Gennemsnitlig pris (Øst) |
Aktier | Δ Aktier (%) |
Rapporteret Værdi ($1000) |
Δ Værdi (%) |
Port Alloc (%) |
|
|---|---|---|---|---|---|---|---|---|---|---|
| 2026-02-13 | 13F | Creekside Partners | 217.819 | -8,74 | 2.283 | -11,38 | ||||
| 2026-02-13 | 13F | Mml Investors Services, Llc | 22.579 | 1,62 | 237 | -1,26 | ||||
| 2026-02-17 | 13F | Tower Research Capital LLC (TRC) | 0 | -100,00 | 0 | |||||
| 2026-01-23 | 13F | Halbert Hargrove Global Advisors, Llc | 20.050 | 0,00 | 210 | -2,78 | ||||
| 2026-02-18 | 13F | EP Wealth Advisors, Inc. | 28.500 | 0,00 | 299 | -0,33 | ||||
| 2026-02-11 | 13F | Cerity Partners LLC | 11.435 | -7,15 | 120 | -9,85 | ||||
| 2026-01-22 | 13F | HHM Wealth Advisors, LLC | 725 | 0,00 | 8 | 0,00 | ||||
| 2026-01-23 | 13F | Assetmark, Inc | 241 | 3 | ||||||
| 2026-01-07 | 13F | KFA Private Wealth Group, LLC | 95.882 | -4,70 | 1.005 | -7,47 | ||||
| 2025-11-14 | 13F | Sofos Investments, Inc. | 0 | -100,00 | 0 | |||||
| 2025-11-05 | 13F | J.w. Cole Advisors, Inc. | 0 | -100,00 | 0 | |||||
| 2025-12-16 | 13F | Garde Capital, Inc. | 0 | -100,00 | 0 | |||||
| 2026-01-26 | 13F | PFG Investments, LLC | 24.624 | 258 | ||||||
| 2026-02-11 | 13F | SAM Advisors, LLC | 50.967 | 3,73 | 534 | 0,75 | ||||
| 2026-02-12 | 13F | Jane Street Group, Llc | 18.563 | 7,78 | 195 | 4,86 | ||||
| 2026-02-03 | 13F | Grange Capital, LLC | 309.537 | -2,23 | 3.244 | -5,06 | ||||
| 2026-02-13 | 13F | Sei Investments Co | 47.018 | -4,02 | 493 | -6,82 | ||||
| 2026-01-09 | 13F | Capital CS Group, LLC | 25.224 | 0,00 | 264 | -2,94 | ||||
| 2026-02-06 | 13F | Global Retirement Partners, LLC | 8.308 | 1,39 | 87 | -1,14 | ||||
| 2026-02-17 | 13F | Northern Trust Corp | 44.564 | 2,70 | 467 | -0,21 | ||||
| 2026-02-13 | 13F | Mariner, LLC | 23.380 | 1,16 | 245 | -1,61 | ||||
| 2026-02-06 | 13F | HighTower Advisors, LLC | 30.121 | -20,32 | 316 | -22,60 | ||||
| 2026-02-05 | 13F | Allworth Financial LP | 11.897 | 33,15 | 125 | 29,17 | ||||
| 2026-02-17 | 13F | Private Advisor Group, LLC | 29.189 | 2,75 | 306 | -0,33 | ||||
| 2026-01-14 | 13F | ORG Partners LLC | 1.500 | 0,00 | 16 | -6,25 | ||||
| 2026-01-15 | 13F | Jaffetilchin Investment Partners, LLC | 31.029 | 44,15 | 325 | 40,09 | ||||
| 2026-02-03 | 13F | Alpha Cubed Investments, LLC | 16.808 | 36,65 | 176 | 33,33 | ||||
| 2026-02-13 | 13F | SRS Capital Advisors, Inc. | 41.673 | 10,09 | 437 | 6,86 | ||||
| 2026-01-29 | 13F | D.a. Davidson & Co. | 1.045.470 | 2,06 | 10.957 | -0,88 | ||||
| 2026-02-12 | 13F | Kovack Advisors, Inc. | 12.999 | 7,01 | 131 | -0,76 | ||||
| 2026-02-17 | 13F | Readystate Asset Management Lp | 24.702 | 29,61 | 259 | 25,85 | ||||
| 2026-01-09 | 13F | Clear Trail Advisors, LLC | 13.649 | 143 | ||||||
| 2025-11-12 | 13F | Creekmur Asset Management LLC | 156 | 2,63 | 2 | 0,00 | ||||
| 2026-01-14 | 13F | Game Plan Financial Advisors, LLC | 25.000 | 0,00 | 262 | -2,60 | ||||
| 2026-02-06 | 13F | IFP Advisors, Inc | 2.000 | 21 | ||||||
| 2026-02-03 | 13F | Costello Asset Management, INC | 2.227 | 1,88 | 23 | 0,00 | ||||
| 2026-02-17 | 13F | Raymond James Financial Inc | 322.265 | -4,31 | 3.377 | -7,05 | ||||
| 2025-10-07 | 13F | Sonora Investment Management Group, LLC | 16.350 | 0,00 | 176 | 2,33 | ||||
| 2026-02-09 | 13F | Hartland & Co., LLC | 11.527 | 2,70 | 121 | -0,83 | ||||
| 2026-02-17 | 13F | Palogic Value Management, L.P. | 12.000 | 0,00 | 126 | -3,10 | ||||
| 2026-02-05 | 13F | Pinnacle Associates Ltd | 16.433 | 0,00 | 172 | -2,82 | ||||
| 2026-02-17 | 13F | Advisory Services Network, LLC | 0 | -100,00 | 0 | -100,00 | ||||
| 2026-02-12 | 13F | Principal Securities, Inc. | 0 | -100,00 | 0 | -100,00 | ||||
| 2025-10-31 | 13F | Winebrenner Capital Management Llc | 0 | -100,00 | 0 | |||||
| 2026-02-11 | 13F | Janney Montgomery Scott LLC | 72.036 | 9,33 | 1 | |||||
| 2026-01-08 | 13F | Wealth Enhancement Advisory Services, Llc | 66.022 | 13,78 | 722 | 13,01 | ||||
| 2026-01-05 | 13F | Legacy Wealth Management, LLC / MS | 54.753 | 0,35 | 574 | -2,55 | ||||
| 2026-01-21 | 13F | Newbridge Financial Services Group, Inc. | 0 | -100,00 | 0 | |||||
| 2026-02-17 | 13F | Cetera Investment Advisers | 212.666 | -8,93 | 2.229 | -11,55 | ||||
| 2026-02-04 | 13F | Nwam Llc | 13.399 | 12,66 | 148 | 13,85 | ||||
| 2026-01-28 | 13F | PMG Family Office LLC | 95.348 | -10,74 | 999 | -13,28 | ||||
| 2026-02-17 | 13F | Royal Bank Of Canada | 218.299 | 2,21 | 2.288 | -0,69 | ||||
| 2026-01-26 | 13F | Cwm, Llc | 3.639 | 0 | ||||||
| 2025-10-28 | 13F | Mascoma Wealth Management LLC | 0 | -100,00 | 0 | |||||
| 2026-02-12 | 13F | Hollencrest Capital Management | 24.293 | 0,00 | 255 | -3,05 | ||||
| 2026-02-17 | 13F | Creative Planning | 11.004 | 0,04 | 115 | -2,54 | ||||
| 2026-01-22 | 13F | Apollon Wealth Management, LLC | 112.860 | -24,32 | 1.183 | -26,54 | ||||
| 2026-02-02 | 13F | Mutual Advisors, LLC | 29.161 | 76,58 | 306 | 67,58 | ||||
| 2026-02-02 | 13F | Oppenheimer & Co Inc | 214.803 | 12,09 | 2.251 | 8,90 | ||||
| 2026-01-22 | 13F | Greenberg Financial Group | 45.685 | 479 | ||||||
| 2026-01-29 | 13F | Dumont & Blake Investment Advisors Llc | 37.098 | 22,50 | 0 | -100,00 | ||||
| 2026-02-17 | 13F | Boreal Capital Management LLC | 0 | 880 | ||||||
| 2026-02-11 | 13F | Total Wealth Planning & Management, Inc. | 71.436 | -5,61 | 749 | -6,03 | ||||
| 2026-01-29 | 13F | St Germain D J Co Inc | 0 | -100,00 | 0 | |||||
| 2026-02-04 | 13F | Twin Lakes Capital Management, LLC | 325 | 2,52 | 3 | 0,00 | ||||
| 2026-02-02 | 13F | Benjamin Edwards Inc | 33.663 | 1,45 | 353 | -1,68 | ||||
| 2026-02-11 | 13F | LPL Financial LLC | 729.256 | 3,26 | 7.643 | 0,29 | ||||
| 2026-02-10 | 13F | Rothschild Investment Llc | 662 | 0,00 | 7 | -14,29 | ||||
| 2026-02-12 | 13F | Steward Partners Investment Advisory, Llc | 9.912 | 0,00 | 104 | -2,83 | ||||
| 2026-01-23 | 13F | Patten Group, Inc. | 29.246 | -23,84 | 306 | -26,09 | ||||
| 2025-11-10 | 13F | MAI Capital Management | 0 | -100,00 | 0 | |||||
| 2026-02-17 | 13F | Bank Of America Corp /de/ | 2.484.015 | 3,74 | 26.032 | 0,76 | ||||
| 2026-01-26 | 13F | Wealth Effects Llc | 19.080 | 5,96 | 200 | 2,58 | ||||
| 2026-02-09 | 13F | Huntington National Bank | 0 | |||||||
| 2026-01-30 | 13F | Samalin Investment Counsel, LLC | 67.706 | 21,70 | 710 | 18,17 | ||||
| 2026-02-04 | 13F | Ameritas Advisory Services, LLC | 0 | -100,00 | 0 | |||||
| 2026-01-27 | 13F | Semus Wealth Partners LLC | 11.228 | -31,87 | 118 | -33,90 | ||||
| 2026-02-10 | 13F | Hilltop Partners LLC | 18.305 | 0,00 | 192 | -3,05 | ||||
| 2026-02-14 | 13F | Rockefeller Capital Management L.P. | 149.847 | -2,81 | 1.570 | -5,59 | ||||
| 2026-02-17 | 13F | Wiley Bros.-aintree Capital, Llc | 44.237 | 19,62 | 464 | 16,04 | ||||
| 2026-02-12 | 13F | Hrt Financial Lp | 14.099 | 0 | ||||||
| 2026-02-13 | 13F | Landscape Capital Management, L.l.c. | 68.264 | -53,29 | 715 | -54,63 | ||||
| 2026-02-03 | 13F | McIlrath & Eck, LLC | 811 | 0,00 | 8 | 0,00 | ||||
| 2026-02-05 | 13F | Stephens Inc /ar/ | 35.540 | 0,00 | 372 | -2,87 | ||||
| 2026-01-30 | 13F | Sigma Planning Corp | 30.277 | -12,52 | 317 | -15,01 | ||||
| 2026-02-17 | 13F | Guggenheim Capital Llc | 694.810 | 8,15 | 7.282 | 5,05 | ||||
| 2026-01-29 | 13F | UBS Group AG | 2.187.784 | 7,41 | 22.928 | 4,32 | ||||
| 2026-01-21 | 13F | Flagship Harbor Advisors, Llc | 9.679 | 101 | ||||||
| 2026-02-19 | 13F | Lexington Hill Partners, LLC | 21.939 | 230 | ||||||
| 2026-02-13 | 13F | Baird Financial Group, Inc. | 543.001 | -3,15 | 5.691 | -5,93 | ||||
| 2026-02-12 | 13F | Advisors Asset Management, Inc. | 226.592 | 290,24 | 2.375 | 279,23 | ||||
| 2026-01-16 | 13F | Melfa Wealth Management, Llc | 11.819 | 0,00 | 124 | -3,15 | ||||
| 2026-01-29 | 13F | Sanctuary Advisors, LLC | 28.268 | 1,10 | 296 | -1,66 | ||||
| 2026-02-12 | 13F | Wedbush Securities Inc | 17.050 | 0,00 | 0 | |||||
| 2026-02-12 | 13F | BRYN MAWR TRUST Co | 4.000 | 0,00 | 42 | -4,65 | ||||
| 2026-02-17 | 13F | Advisor Group Holdings, Inc. | 216.092 | -4,97 | 2.265 | -5,55 | ||||
| 2026-02-13 | 13F | Kestra Advisory Services, LLC | 8.857 | 93 | ||||||
| 2026-02-02 | 13F | Wolverine Asset Management Llc | 31.343 | -88,91 | 328 | -89,24 | ||||
| 2026-02-17 | 13F | Cape Investment Advisory, Inc. | 402 | 4 | ||||||
| 2026-01-26 | 13F | Private Trust Co Na | 3.000 | 0,00 | 31 | -3,12 | ||||
| 2026-02-11 | 13F | Monetary Management Group Inc | 7.500 | 0,00 | 79 | -2,50 | ||||
| 2026-02-12 | 13F | Founders Financial Alliance, LLC | 28.412 | 0,29 | 298 | -2,62 | ||||
| 2026-01-23 | 13F | Sunpointe, LLC | 17.745 | 0,00 | 188 | -2,09 | ||||
| 2026-02-17 | 13F | Df Dent & Co Inc | 0 | -100,00 | 0 | |||||
| 2026-03-02 | 13F | Clearwave Capital, LLC | 13.060 | 137 | ||||||
| 2026-02-09 | 13F | Harbour Investments, Inc. | 239.497 | 0,98 | 2.510 | -1,95 | ||||
| 2026-02-18 | 13F | Garton & Associates Financial Advisors LLC | 575 | 6 | ||||||
| 2026-02-17 | 13F | Ameriflex Group, Inc. | 3.700 | -50,00 | 39 | -51,90 | ||||
| 2026-01-15 | 13F | Brookstone Capital Management | 15.089 | 0,00 | 158 | -2,47 | ||||
| 2026-01-28 | 13F | Geneos Wealth Management Inc. | 38.474 | 0,00 | 403 | -2,89 | ||||
| 2026-02-13 | 13F | Stifel Financial Corp | 74.297 | 99,82 | 779 | 94,01 | ||||
| 2026-01-21 | 13F | ProCore Advisors, LLC | 12.136 | 127 | ||||||
| 2026-02-13 | 13F | Citigroup Inc | 27 | 0,00 | 0 | |||||
| 2026-01-26 | 13F | San Luis Wealth Advisors LLC | 13.555 | 0,00 | 142 | -2,74 | ||||
| 2026-02-11 | 13F | Marathon Strategic Advisors, LLC | 276.926 | 2.902 | ||||||
| 2026-02-17 | 13F | one8zero8, LLC | 13.350 | -6,97 | 140 | -9,74 | ||||
| 2026-02-13 | 13F | Colony Group, LLC | 143.225 | 10,39 | 1.501 | 7,14 | ||||
| 2026-02-10 | 13F | Envestnet Asset Management Inc | 12.979 | 136 | ||||||
| 2025-11-12 | 13F | Us Bancorp \de\ | 0 | -100,00 | 0 | |||||
| 2026-02-09 | 13F | Key FInancial Inc | 89 | 0,00 | 1 | |||||
| 2026-02-17 | 13F | Ameriprise Financial Inc | 659.365 | 3,87 | 6.910 | 0,96 | ||||
| 2026-02-17 | 13F | Turim 21 Investimentos Ltda. | 0 | -100,00 | 0 | |||||
| 2026-01-28 | 13F | Barrett & Company, Inc. | 7.750 | 0,00 | 81 | -2,41 | ||||
| 2026-01-29 | 13F | Comerica Bank | 79.205 | 49,49 | 830 | 45,36 | ||||
| 2026-01-29 | 13F | Kestra Private Wealth Services, Llc | 20.803 | 4,08 | 218 | 1,40 | ||||
| 2026-01-05 | 13F | GAMMA Investing LLC | 321 | 165,29 | 3 | 200,00 | ||||
| 2026-01-15 | 13F | Highline Wealth Partners Llc | 400 | 0,00 | 4 | 0,00 | ||||
| 2025-11-04 | 13F | L.m. Kohn & Company | 0 | -100,00 | 0 | |||||
| 2026-02-17 | 13F | Susquehanna International Group, Llp | 52.303 | 548 | ||||||
| 2026-02-02 | 13F | CENTRAL TRUST Co | 33.400 | -2,57 | 350 | -5,15 | ||||
| 2026-02-05 | 13F | Everstar Asset Management, LLC | 117.953 | -2,00 | 1.237 | -4,78 | ||||
| 2026-02-17 | 13F | Modern Wealth Management, LLC | 11.915 | 0,00 | 125 | -3,12 | ||||
| 2025-11-06 | 13F | Financial Advocates Investment Management | 0 | -100,00 | 0 | |||||
| 2026-01-29 | 13F | Concurrent Investment Advisors, LLC | 21.999 | 231 | ||||||
| 2026-02-03 | 13F | International Assets Investment Management, Llc | 23.617 | 18,01 | 248 | 17,62 | ||||
| 2026-02-05 | 13F | Cambridge Investment Research Advisors, Inc. | 181.085 | 12,31 | 2 | 0,00 | ||||
| 2026-02-06 | 13F | Pnc Financial Services Group, Inc. | 26.590 | 0,00 | 279 | -2,80 | ||||
| 2026-01-27 | 13F | Novem Group | 16.266 | 9,53 | 170 | 6,25 | ||||
| 2026-01-27 | 13F | Institute for Wealth Management, LLC. | 58.696 | -5,19 | 615 | -7,80 | ||||
| 2026-02-13 | 13F | Wells Fargo & Company/mn | 1.346.815 | -2,51 | 14.115 | -5,31 | ||||
| 2026-01-13 | 13F | CoreCap Advisors, LLC | 27.237 | 3,29 | 285 | 0,35 | ||||
| 2026-01-23 | 13F | E&G Advisors, LP | 35.002 | -1,13 | 367 | -3,94 | ||||
| 2026-02-17 | 13F | Captrust Financial Advisors | 40.920 | -2,75 | 429 | -5,73 | ||||
| 2026-01-29 | 13F | Nbc Securities, Inc. | 4.413 | 0,00 | 46 | -2,13 | ||||
| 2026-02-18 | 13F | Beacon Pointe Advisors, LLC | 19.066 | 200 | ||||||
| 2026-01-23 | 13F | Farther Finance Advisors, LLC | 5.340 | 0,00 | 56 | -3,51 | ||||
| 2026-02-13 | 13F | Change Path, LLC | 37.838 | -3,81 | 397 | -6,60 | ||||
| 2026-02-13 | 13F | Gen-Wealth Partners Inc | 2.575 | 0,00 | 27 | -3,70 | ||||
| 2026-02-18 | 13F | GWM Advisors LLC | 103.066 | -13,73 | 1.080 | -16,21 | ||||
| 2026-02-02 | 13F | CX Institutional | 2.176 | -76,90 | 0 | |||||
| 2026-01-14 | 13F | Eastern Bank | 0 | 0 | ||||||
| 2026-01-20 | 13F | Stratos Wealth Partners, LTD. | 31.523 | 4,24 | 330 | 1,23 | ||||
| 2026-01-20 | 13F | Thurston, Springer, Miller, Herd & Titak, Inc. | 1.000 | 0,00 | 10 | 0,00 | ||||
| 2026-02-12 | 13F | Commonwealth Equity Services, Llc | 554.988 | 2,47 | 5.816 | 116.220,00 | ||||
| 2026-02-13 | 13F | Morgan Stanley | 1.396.889 | -2,50 | 14.639 | -5,30 | ||||
| 2026-02-17 | 13F | IHT Wealth Management, LLC | 69.075 | 65,73 | 724 | 61,02 | ||||
| 2026-01-27 | 13F | GHP Investment Advisors, Inc. | 2.400 | 0,00 | 25 | 0,00 | ||||
| 2026-02-05 | 13F | Center for Financial Planning, Inc. | 1.094 | 0,00 | 11 | 0,00 | ||||
| 2026-01-30 | 13F | Caldwell Trust Co | 1.534 | 0,00 | 16 | 0,00 | ||||
| 2026-02-10 | 13F | Continuum Advisory, LLC | 12.120 | 127 | ||||||
| 2026-02-10 | 13F | Calton & Associates, Inc. | 20.332 | 213 | ||||||
| 2025-11-14 | 13F | Elequin Capital Lp | 0 | -100,00 | 0 | |||||
| 2026-02-10 | 13F/A | Northwestern Mutual Wealth Management Co | 1.495 | -94,13 | 16 | -94,53 | ||||
| 2025-11-14 | 13F | XTX Topco Ltd | 0 | -100,00 | 0 | -100,00 |