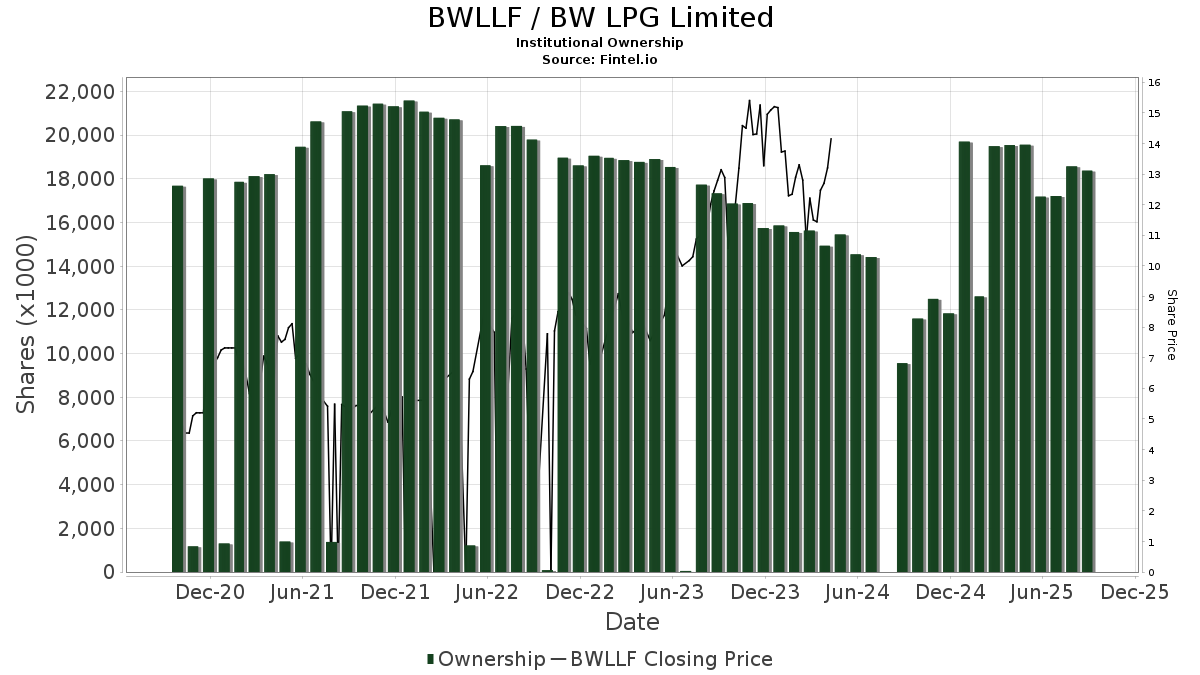
Grundlæggende statistik
| Institutionelle aktier (lange) | 11.479.617 - 7,56% (ex 13D/G) - change of -1,50MM shares -11,58% MRQ |
| Institutionel værdi (lang) | $ 153.899 USD ($1000) |
Institutionelt ejerskab og aktionærer
BW LPG Limited (US:BWLLF) har 74 institutionelle ejere og aktionærer, der har indsendt 13D/G- eller 13F-formularer til Securities Exchange Commission (SEC). Disse institutioner har i alt 11,479,617 aktier. Største aktionærer omfatter Vanguard Group Inc, Ameriprise Financial Inc, Goldman Sachs Group Inc, DZ BANK AG Deutsche Zentral Genossenschafts Bank, Frankfurt am Main, Millennium Management Llc, UBS Group AG, Two Sigma Investments, Lp, Allianz Asset Management GmbH, Skandinaviska Enskilda Banken AB (publ), and Swiss National Bank .
BW LPG Limited (OTCPK:BWLLF) institutionel ejerskabsstruktur viser aktuelle positioner i virksomheden efter institutioner og fonde, samt seneste ændringer i positionsstørrelse. Større aktionærer kan omfatte individuelle investorer, investeringsforeninger, hedgefonde eller institutioner. Skema 13D angiver, at investoren besidder (eller besidder) mere end 5 % af virksomheden og har til hensigt (eller har til hensigt at) aktivt at forfølge en ændring i forretningsstrategi. Skema 13G indikerer en passiv investering på over 5%.
Fondens stemningsscore
Fund Sentiment Score (fka Ownership Accumulation Score) finder de aktier, der bliver mest købt af fonde. Det er resultatet af en sofistikeret, multi-faktor kvantitativ model, der identificerer virksomheder med de højeste niveauer af institutionel akkumulering. Scoringsmodellen bruger en kombination af den samlede stigning i oplyste ejere, ændringerne i porteføljeallokeringer i disse ejere og andre målinger. Tallet går fra 0 til 100, hvor højere tal indikerer et højere niveau af akkumulering for sine jævnaldrende, og 50 er gennemsnittet.
Opdateringsfrekvens: Dagligt
Se Ownership Explorer, som giver en liste over højest rangerende virksomheder.
AI+ Ask Fintel’s AI assistant about BW LPG Limited.
Select a question to share a public post with an AI-crafted answer.
Thinking of good questions…
Institutionel Put/Call-forhold
Ud over at indberette standardaktie- og gældsudstedelser skal institutter med mere end 100 mill. aktiver under forvaltning også oplyse deres put- og call-optionsbeholdninger. Da salgsoptioner generelt indikerer negativ stemning, og købsoptioner indikerer positiv stemning, kan vi få en fornemmelse af den overordnede institutionelle stemning ved at plotte forholdet mellem put og kald. Diagrammet til højre viser det historiske put/call-forhold for dette instrument.
Brug af Put/Call Ratio som en indikator for investorernes stemning overvinder en af de vigtigste mangler ved at bruge totalt institutionelt ejerskab, som er, at en betydelig mængde af aktiver under forvaltning investeres passivt for at spore indekser. Passivt forvaltede fonde køber typisk ikke optioner, så indikatoren for put/call-forholdet følger mere nøje følelsen af aktivt forvaltede fonde.
13F og NPORT arkivering
Detaljer om 13F-arkivering er gratis. Detaljer om NP-ansøgninger kræver et premium-medlemskab. Grønne rækker angiver nye positioner. Røde rækker angiver lukkede positioner. Klik på linket ikon for at se den fulde transaktionshistorik.
Opgrader
for at låse premium-data op og eksportere til Excel ![]() .
.
| Fil dato | Kilde | Investor | Type | Gennemsnitlig pris (Øst) |
Aktier | Δ Aktier (%) |
Rapporteret Værdi ($1000) |
Δ Værdi (%) |
Port Alloc (%) |
|
|---|---|---|---|---|---|---|---|---|---|---|
| 2026-02-17 | 13F | XTX Topco Ltd | 15.636 | -56,65 | 205 | -60,39 | ||||
| 2026-02-12 | 13F | Skandinaviska Enskilda Banken AB (publ) | 203.942 | 115.776,14 | 2.549 | 127.350,00 | ||||
| 2026-02-11 | 13F | Jpmorgan Chase & Co | 5.057 | -90,12 | 66 | -90,96 | ||||
| 2026-02-17 | 13F | Ameriprise Financial Inc | 3.046.112 | 20,39 | 39.904 | 10,44 | ||||
| 2026-02-19 | 13F | Invesco Ltd. | 26.172 | 4,29 | 343 | -4,47 | ||||
| 2026-02-17 | 13F | Persistent Asset Partners Ltd | 43.398 | 568 | ||||||
| 2025-11-14 | 13F | StoneX Group Inc. | 0 | -100,00 | 0 | -100,00 | ||||
| 2026-02-17 | 13F | Lazard Asset Management Llc | 176.639 | 1,35 | 2.313 | -7,11 | ||||
| 2026-02-13 | 13F | Wexford Capital Lp | 38.659 | 506 | ||||||
| 2026-01-21 | 13F | Flagship Harbor Advisors, Llc | 225 | 3 | ||||||
| 2026-02-17 | 13F | Two Sigma Investments, Lp | 260.290 | 50,87 | 3.410 | 38,41 | ||||
| 2026-02-17 | 13F | Bank Of America Corp /de/ | 62.967 | 112,05 | 825 | 94,34 | ||||
| 2026-02-17 | 13F | Public Employees Retirement System Of Ohio | 42.086 | 0,00 | 550 | -8,64 | ||||
| 2025-11-14 | 13F | Balyasny Asset Management Llc | 0 | -100,00 | 0 | -100,00 | ||||
| 2026-01-29 | 13F | Vanguard Group Inc | 3.621.504 | 0,98 | 47.163 | -8,53 | ||||
| 2025-11-14 | 13F | Ubs Asset Management Americas Inc | 0 | -100,00 | 0 | |||||
| 2026-01-30 | 13F | Glenorchy Capital Ltd | 49.850 | 1,47 | 653 | -6,99 | ||||
| 2025-11-10 | 13F | Jupiter Asset Management Ltd | 0 | -100,00 | 0 | |||||
| 2026-01-12 | 13F | CVA Family Office, LLC | 176 | 93,41 | 2 | 100,00 | ||||
| 2026-02-10 | 13F | Acadian Asset Management Llc | 0 | -100,00 | 0 | |||||
| 2026-02-12 | 13F | BlackRock, Inc. | 322 | 4 | ||||||
| 2026-02-17 | 13F | MIRAE ASSET GLOBAL ETFS HOLDINGS Ltd. | 29.333 | 2,72 | 384 | -6,13 | ||||
| 2026-02-17 | 13F | Petrus Trust Company, LTA | 0 | -100,00 | 0 | |||||
| 2026-02-12 | 13F | Jane Street Group, Llc | 66.122 | -70,32 | 866 | -72,78 | ||||
| 2026-02-06 | 13F | EverSource Wealth Advisors, LLC | 33 | 0 | ||||||
| 2026-02-17 | 13F | Optiver Holding B.V. | 570 | -87,45 | 7 | -89,06 | ||||
| 2026-02-10 | 13F | Bnp Paribas Arbitrage, Sa | 300 | -93,06 | 4 | -95,08 | ||||
| 2026-02-13 | 13F | Smartleaf Asset Management LLC | 6 | 0 | ||||||
| 2025-11-14 | 13F | SIH Partners, LLLP | 0 | -100,00 | 0 | -100,00 | ||||
| 2025-09-29 | NP | PDN - Invesco FTSE RAFI Developed Markets ex-U.S. Small-Mid ETF This fund is a listed as child fund of Invesco Ltd. and if that institution has disclosed ownership in this security, then these positions will not be double counted when calculating total shares and total value | 24.083 | 12,44 | 322 | 49,30 | ||||
| 2026-02-17 | 13F | Russell Investments Group, Ltd. | 0 | -100,00 | 0 | |||||
| 2026-02-10 | 13F | Quantbot Technologies LP | 13.900 | 52,43 | 182 | 40,00 | ||||
| 2026-02-13 | 13F | Caitong International Asset Management Co., Ltd | 1.302 | 797,93 | 17 | 750,00 | ||||
| 2026-02-17 | 13F | Citadel Advisors Llc | 0 | -100,00 | 0 | |||||
| 2026-02-17 | 13F | VestGen Advisors, LLC | 10.000 | 0,00 | 131 | -7,75 | ||||
| 2026-02-13 | 13F | Cornerstone Financial Management LLC | 111 | 1 | ||||||
| 2026-02-12 | 13F | Nuveen, LLC | 66.798 | 0,00 | 874 | -8,48 | ||||
| 2026-02-12 | 13F | Marex Group plc | 99.958 | 1.309 | ||||||
| 2026-01-27 | 13F | WealthCollab, LLC | 232 | 0,00 | 3 | 0,00 | ||||
| 2025-11-12 | 13F | Victory Capital Management Inc | 0 | -100,00 | 0 | |||||
| 2026-02-09 | 13F | Legal & General Group Plc | 130.275 | -0,46 | 1.705 | -8,82 | ||||
| 2026-01-30 | 13F | Mitsubishi UFJ Trust & Banking Corp | 24.030 | 8,37 | 314 | 1,62 | ||||
| 2026-02-17 | 13F | DZ BANK AG Deutsche Zentral Genossenschafts Bank, Frankfurt am Main | 580.000 | 0,00 | 7.598 | -8,29 | ||||
| 2025-11-14 | 13F | Two Sigma Advisers, Lp | 0 | -100,00 | 0 | -100,00 | ||||
| 2026-01-29 | 13F | UBS Group AG | 299.497 | 14,91 | 3.923 | 5,40 | ||||
| 2026-02-17 | 13F/A | Kovack Advisors, Inc. | 47.940 | 628 | ||||||
| 2026-01-28 | 13F | Klp Kapitalforvaltning As | 100.000 | 1.310 | ||||||
| 2026-02-11 | 13F | LPL Financial LLC | 35.570 | 126,68 | 466 | 107,59 | ||||
| 2026-02-11 | 13F | O'shaughnessy Asset Management, Llc | 0 | -100,00 | 0 | -100,00 | ||||
| 2026-01-27 | 13F | Zurcher Kantonalbank (Zurich Cantonalbank) | 39.607 | 53,90 | 518 | 40,76 | ||||
| 2026-02-12 | 13F | Swiss National Bank | 189.510 | 1,71 | 2.481 | -6,98 | ||||
| 2026-02-17 | 13F | Jump Financial, LLC | 25.562 | 335 | ||||||
| 2026-02-10 | 13F | Bank of New York Mellon Corp | 0 | -100,00 | 0 | |||||
| 2026-02-13 | 13F | Gts Securities Llc | 0 | -100,00 | 0 | |||||
| 2026-02-05 | 13F | Cambridge Investment Research Advisors, Inc. | 16.009 | 13,95 | 0 | |||||
| 2026-02-17 | 13F | Grantham, Mayo, Van Otterloo & Co. LLC | 93.824 | -1,86 | 1.228 | -10,24 | ||||
| 2026-02-05 | 13F | Intrua Financial, LLC | 34.261 | 0,00 | 449 | -8,38 | ||||
| 2026-01-08 | 13F | True Wealth Design, LLC | 22 | -24,14 | 0 | |||||
| 2026-02-17 | 13F | Tower Research Capital LLC (TRC) | 15.505 | -46,51 | 203 | -50,85 | ||||
| 2026-02-17 | 13F | Aqr Capital Management Llc | 23.367 | 306 | ||||||
| 2026-02-13 | 13F | Morgan Stanley | 57.159 | -60,24 | 749 | -63,55 | ||||
| 2026-02-17 | 13F | Alliancebernstein L.p. | 17.521 | 0,00 | 230 | -8,40 | ||||
| 2026-02-13 | 13F | Citigroup Inc | 13.313 | -54,60 | 172 | -59,19 | ||||
| 2026-02-13 | 13F | Oceanic Investment Management LTD | 29.278 | 384 | ||||||
| 2025-11-14 | 13F | Raymond James Financial Inc | 0 | -100,00 | 0 | -100,00 | ||||
| 2026-02-17 | 13F | PDT Partners, LLC | 51.864 | -2,16 | 679 | -10,19 | ||||
| 2026-02-17 | 13F | Amundi | 11.171 | 146 | ||||||
| 2026-02-17 | 13F | D. E. Shaw & Co., Inc. | 89.435 | -22,47 | 1.172 | -28,90 | ||||
| 2026-02-11 | 13F | Allianz Asset Management GmbH | 221.958 | 60,92 | 2.905 | 47,26 | ||||
| 2026-02-17 | 13F | Fearnley Asset Management As | 93.429 | 5.388 | ||||||
| 2026-02-13 | 13F | JustInvest LLC | 11.957 | -5,72 | 157 | -13,81 | ||||
| 2025-11-14 | 13F | Texas Permanent School Fund | 0 | -100,00 | 0 | |||||
| 2026-02-17 | 13F | Royal Bank Of Canada | 340 | 50,44 | 4 | 33,33 | ||||
| 2025-10-28 | 13F | Campbell & CO Investment Adviser LLC | 0 | -100,00 | 0 | -100,00 | ||||
| 2026-02-17 | 13F | Advisory Services Network, LLC | 0 | -100,00 | 0 | |||||
| 2026-02-17 | 13F | Boothbay Fund Management, Llc | 28.816 | 377 | ||||||
| 2025-11-12 | 13F | Sprott Inc. | 0 | -100,00 | 0 | -100,00 | ||||
| 2026-02-17 | 13F | Advisor Group Holdings, Inc. | 27.605 | 0,80 | 362 | -8,38 | ||||
| 2026-02-13 | 13F | Manufacturers Life Insurance Company, The | 0 | -100,00 | 0 | |||||
| 2026-02-14 | 13F | Rockefeller Capital Management L.P. | 0 | -100,00 | 0 | |||||
| 2026-01-29 | 13F | Pictet Asset Management Holding SA | 18.312 | 10,62 | 240 | 1,27 | ||||
| 2026-02-10 | 13F | Goldman Sachs Group Inc | 584.764 | -31,61 | 7.660 | -37,26 | ||||
| 2026-02-10 | 13F/A | MJT & Associates Financial Advisory Group, Inc. | 280 | 0,00 | 4 | 0,00 | ||||
| 2026-02-13 | 13F | Wells Fargo & Company/mn | 1 | 0 | ||||||
| 2025-11-14 | 13F | Squarepoint Ops LLC | 0 | -100,00 | 0 | -100,00 | ||||
| 2026-02-13 | 13F | Barclays Plc | 111.828 | -92,34 | 1.465 | -93,03 | ||||
| 2026-02-17 | 13F | Numerai GP LLC | 97.002 | 235,10 | 1.271 | 207,51 | ||||
| 2026-01-28 | 13F | U S Global Investors Inc | 17.049 | 223 | ||||||
| 2026-01-21 | 13F | Sowell Financial Services LLC | 21.400 | 280 | ||||||
| 2026-02-17 | 13F | Susquehanna Advisors Group, Inc. | 14.400 | 0,00 | 189 | -8,29 | ||||
| 2025-10-21 | 13F | Optimum Investment Advisors | 10.000 | -0,99 | 143 | 19,33 | ||||
| 2026-01-14 | 13F | Jfs Wealth Advisors, Llc | 96 | 0,00 | 1 | 0,00 | ||||
| 2026-02-03 | 13F | SBI Securities Co., Ltd. | 2.037 | 31,00 | 27 | 18,18 | ||||
| 2026-02-17 | 13F | Millennium Management Llc | 383.753 | 5.027 | ||||||
| 2026-02-18 | 13F | Mackenzie Financial Corp | 24.918 | -60,49 | 327 | -63,82 | ||||
| 2026-02-06 | 13F | Global Retirement Partners, LLC | 3.252 | 43 |