Grundlæggende statistik
| Institutionelle ejere | 64 total, 64 long only, 0 short only, 0 long/short - change of -5,88% MRQ |
| Gennemsnitlig porteføljeallokering | 0.1933 % - change of 10,82% MRQ |
| Institutionelle aktier (lange) | 2.386.795 (ex 13D/G) - change of 0,35MM shares 17,16% MRQ |
| Institutionel værdi (lang) | $ 200.723 USD ($1000) |
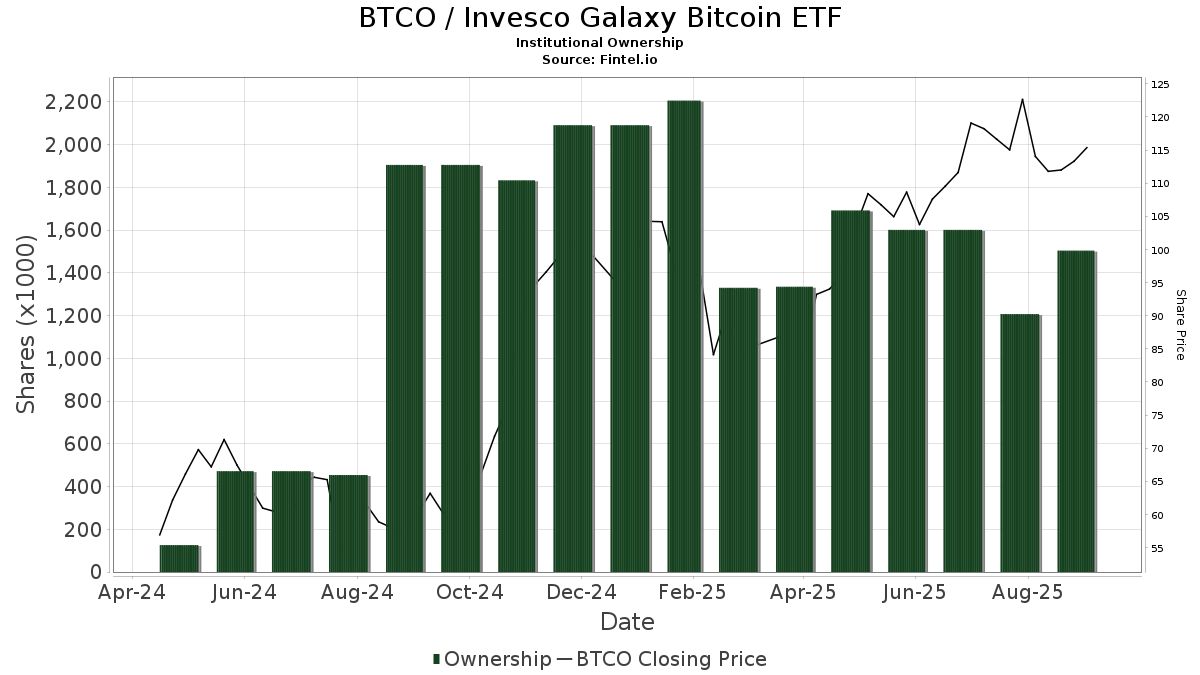
Institutionelt ejerskab og aktionærer
Invesco Galaxy Bitcoin ETF (US:BTCO) har 64 institutionelle ejere og aktionærer, der har indsendt 13D/G- eller 13F-formularer til Securities Exchange Commission (SEC). Disse institutioner har i alt 2,386,795 aktier. Største aktionærer omfatter Galaxy Group Investments LLC, Gradient Investments LLC, Wells Fargo & Company/mn, Cresset Asset Management, LLC, Susquehanna International Group, Llp, LPL Financial LLC, First Trust Advisors Lp, Farringdon Capital, Ltd., Cetera Investment Advisers, and Meitav Dash Investments Ltd .
Invesco Galaxy Bitcoin ETF (BATS:BTCO) institutionel ejerskabsstruktur viser aktuelle positioner i virksomheden efter institutioner og fonde, samt seneste ændringer i positionsstørrelse. Større aktionærer kan omfatte individuelle investorer, investeringsforeninger, hedgefonde eller institutioner. Skema 13D angiver, at investoren besidder (eller besidder) mere end 5 % af virksomheden og har til hensigt (eller har til hensigt at) aktivt at forfølge en ændring i forretningsstrategi. Skema 13G indikerer en passiv investering på over 5%.
The share price as of March 11, 2026 is 70,35 / share. Previously, on March 11, 2025, the share price was 82,88 / share. This represents a decline of 15,12% over that period.
Fondens stemningsscore
Fund Sentiment Score (fka Ownership Accumulation Score) finder de aktier, der bliver mest købt af fonde. Det er resultatet af en sofistikeret, multi-faktor kvantitativ model, der identificerer virksomheder med de højeste niveauer af institutionel akkumulering. Scoringsmodellen bruger en kombination af den samlede stigning i oplyste ejere, ændringerne i porteføljeallokeringer i disse ejere og andre målinger. Tallet går fra 0 til 100, hvor højere tal indikerer et højere niveau af akkumulering for sine jævnaldrende, og 50 er gennemsnittet.
Opdateringsfrekvens: Dagligt
Se Ownership Explorer, som giver en liste over højest rangerende virksomheder.
AI+ Ask Fintel’s AI assistant about Invesco Galaxy Bitcoin ETF.
Select a question to share a public post with an AI-crafted answer.
Thinking of good questions…
Institutionel Put/Call-forhold
Ud over at indberette standardaktie- og gældsudstedelser skal institutter med mere end 100 mill. aktiver under forvaltning også oplyse deres put- og call-optionsbeholdninger. Da salgsoptioner generelt indikerer negativ stemning, og købsoptioner indikerer positiv stemning, kan vi få en fornemmelse af den overordnede institutionelle stemning ved at plotte forholdet mellem put og kald. Diagrammet til højre viser det historiske put/call-forhold for dette instrument.
Brug af Put/Call Ratio som en indikator for investorernes stemning overvinder en af de vigtigste mangler ved at bruge totalt institutionelt ejerskab, som er, at en betydelig mængde af aktiver under forvaltning investeres passivt for at spore indekser. Passivt forvaltede fonde køber typisk ikke optioner, så indikatoren for put/call-forholdet følger mere nøje følelsen af aktivt forvaltede fonde.
13F og NPORT arkivering
Detaljer om 13F-arkivering er gratis. Detaljer om NP-ansøgninger kræver et premium-medlemskab. Grønne rækker angiver nye positioner. Røde rækker angiver lukkede positioner. Klik på linket ikon for at se den fulde transaktionshistorik.
Opgrader
for at låse premium-data op og eksportere til Excel ![]() .
.
| Fil dato | Kilde | Investor | Type | Gennemsnitlig pris (Øst) |
Aktier | Δ Aktier (%) |
Rapporteret Værdi ($1000) |
Δ Værdi (%) |
Port Alloc (%) |
|
|---|---|---|---|---|---|---|---|---|---|---|
| 2026-01-08 | 13F | Gradient Investments LLC | 415.168 | 36.190 | ||||||
| 2026-02-17 | 13F | Rpo Llc | 20.300 | 0,00 | 1.770 | -23,55 | ||||
| 2025-11-03 | 13F | AE Wealth Management LLC | 0 | -100,00 | 0 | |||||
| 2026-02-06 | 13F | Global Retirement Partners, LLC | 250 | 0,00 | 22 | -25,00 | ||||
| 2026-02-12 | 13F | Renaissance Technologies Llc | 11.900 | -49,58 | 1.037 | -61,45 | ||||
| 2026-01-29 | 13F | Kestra Private Wealth Services, Llc | 4.239 | 0,00 | 370 | -23,60 | ||||
| 2026-01-20 | 13F | Signaturefd, Llc | 100 | 0,00 | 9 | -27,27 | ||||
| 2026-02-05 | 13F | 1620 Investment Advisors, Inc. | 285 | 0,00 | 25 | -25,00 | ||||
| 2026-02-04 | 13F | Valeo Financial Advisors, LLC | 7.086 | 0,00 | 618 | -23,54 | ||||
| 2026-02-05 | 13F | Financial Security Advisor, Inc. | 4.207 | -3,33 | 367 | -26,21 | ||||
| 2026-02-18 | 13F | Galaxy Group Investments LLC | 725.000 | 63.198 | ||||||
| 2026-02-12 | 13F | Cloud Capital Management, LLC | 0 | -100,00 | 0 | |||||
| 2025-10-09 | 13F | North Capital, Inc. | 0 | -100,00 | 0 | |||||
| 2025-11-13 | 13F | UBS Group AG | 0 | -100,00 | 0 | |||||
| 2026-02-03 | 13F | Retirement Planning Group | 2.721 | -1,23 | 237 | -24,52 | ||||
| 2026-02-23 | 13F | Virtu Financial LLC | 28.277 | -72,45 | 2 | -81,82 | ||||
| 2026-02-06 | 13F | GPS Wealth Strategies Group, LLC | 0 | -100,00 | 0 | |||||
| 2026-02-09 | 13F | Hartland & Co., LLC | 500 | 0,00 | 44 | -24,56 | ||||
| 2026-02-13 | 13F | First Trust Advisors Lp | 62.439 | 7,69 | 5.443 | -17,67 | ||||
| 2026-02-06 | 13F | Fortis Group Advisors, LLC | 15.470 | 26,23 | 1.291 | -3,73 | ||||
| 2026-02-17 | 13F | Susquehanna International Group, Llp | 96.046 | 38,69 | 8.372 | 6,04 | ||||
| 2026-02-17 | 13F | Susquehanna International Group, Llp | Call | 4.100 | 357 | |||||
| 2026-02-09 | 13F | Harbour Investments, Inc. | 50 | 25,00 | 4 | 0,00 | ||||
| 2026-02-11 | 13F | RM Financial Services, LLC | 7.782 | 678 | ||||||
| 2026-02-17 | 13F | Brown Financial Advisors | 22.132 | 1.929 | ||||||
| 2026-01-20 | 13F | Wall Street Access Asset Management, LLC | 520 | 0,00 | 45 | -23,73 | ||||
| 2026-01-30 | 13F | Valued Wealth Advisors LLC | 7 | -56,25 | 1 | -100,00 | ||||
| 2026-02-13 | 13F | Venture Visionary Partners LLC | 7.100 | -7,19 | 619 | -29,13 | ||||
| 2026-02-17 | 13F | Farringdon Capital, Ltd. | 57.259 | 41,33 | 4.991 | 8,08 | ||||
| 2026-02-17 | 13F | Private Advisor Group, LLC | 24.875 | -0,62 | 2.168 | -24,01 | ||||
| 2025-11-14 | 13F | Tower Research Capital LLC (TRC) | 0 | -100,00 | 0 | |||||
| 2026-01-26 | 13F | Cwm, Llc | 813 | 0,00 | 0 | |||||
| 2026-02-13 | 13F | Wells Fargo & Company/mn | 308.708 | -22,52 | 26.910 | -40,76 | ||||
| 2026-01-15 | 13F | Brookstone Capital Management | 11.843 | 12,81 | 1.032 | -13,71 | ||||
| 2026-02-17 | 13F | Old Mission Capital Llc | 11.808 | 50,50 | 1.029 | 15,10 | ||||
| 2025-11-21 | 13F/A | Royal Bank Of Canada | 0 | -100,00 | 0 | |||||
| 2026-02-11 | 13F | Simplex Trading, Llc | 1.064 | 93 | ||||||
| 2026-01-29 | 13F | Kercheville Advisors, LLC | 0 | -100,00 | 0 | |||||
| 2026-02-12 | 13F | Quadrant Capital Group Llc | 94 | 0,00 | 8 | -20,00 | ||||
| 2026-01-23 | 13F | Westside Investment Management, Inc. | 40 | 0,00 | 3 | -25,00 | ||||
| 2026-02-06 | 13F | IFP Advisors, Inc | 1 | 0,00 | 0 | |||||
| 2025-11-14 | 13F | Raymond James Financial Inc | 0 | -100,00 | 0 | |||||
| 2026-02-11 | 13F | Buckingham Strategic Partners | 0 | -100,00 | 0 | |||||
| 2026-02-17 | 13F | Cetera Investment Advisers | 54.050 | 28,37 | 4.712 | -1,85 | ||||
| 2026-02-06 | 13F | Watchman Group, Inc. | 6.210 | 99,10 | 541 | 52,39 | ||||
| 2026-02-09 | 13F | Hantz Financial Services, Inc. | 114 | 10,68 | 0 | |||||
| 2026-01-08 | 13F | Wealth Enhancement Advisory Services, Llc | 7.897 | 727 | ||||||
| 2026-02-17 | 13F | Bank Of America Corp /de/ | 0 | -100,00 | 0 | |||||
| 2026-02-03 | 13F | Harel Insurance Investments & Financial Services Ltd. | 3.857 | 172,97 | 0 | |||||
| 2026-01-23 | 13F | Fortress Financial Solutions, LLC | 2.420 | 0,00 | 211 | -23,64 | ||||
| 2026-02-13 | 13F | A4 Wealth Advisors LLC | 4.419 | 385 | ||||||
| 2026-02-13 | 13F | Flow Traders U.s. Llc | 13.030 | 62,77 | 1 | |||||
| 2026-02-13 | 13F | Mariner, LLC | 2.674 | 28,93 | 233 | -1,27 | ||||
| 2026-02-17 | 13F | Cresset Asset Management, LLC | 172.095 | 0,00 | 15.002 | -23,54 | ||||
| 2026-02-04 | 13F | Tsfg, Llc | 320 | 0,00 | 0 | |||||
| 2026-01-28 | 13F | Geneos Wealth Management Inc. | 2.574 | -5,78 | 224 | -27,97 | ||||
| 2026-02-10 | 13F | Meitav Dash Investments Ltd | 32.647 | 23,65 | 2.846 | -5,48 | ||||
| 2026-02-04 | 13F | Ameritas Advisory Services, LLC | 0 | -100,00 | 0 | |||||
| 2026-01-28 | 13F | Key Client Fiduciary Advisors, LLC | 21.419 | 611,12 | 1.867 | 444,31 | ||||
| 2026-02-12 | 13F | CIBC Private Wealth Group, LLC | 1.500 | 0,00 | 131 | -23,98 | ||||
| 2026-02-12 | 13F | Wealthspire Advisors, LLC | 0 | -100,00 | 0 | |||||
| 2026-02-05 | 13F | Cambridge Investment Research Advisors, Inc. | 6.601 | -5,82 | 1 | |||||
| 2026-02-18 | 13F | GWM Advisors LLC | 1.040 | 209,52 | 91 | 136,84 | ||||
| 2026-02-11 | 13F | Mattson Financial Services, LLC | 10.437 | 910 | ||||||
| 2026-02-11 | 13F | LPL Financial LLC | 82.311 | 7,67 | 7.175 | -17,67 | ||||
| 2026-02-13 | 13F | Toroso Investments, LLC | 0 | -100,00 | 0 | |||||
| 2026-02-13 | 13F | Change Path, LLC | 2.534 | 37,12 | 221 | 4,76 | ||||
| 2026-02-13 | 13F | Towarzystwo Funduszy Inwestycyjnych Pzu Sa | 0 | -100,00 | 0 | |||||
| 2026-01-20 | 13F | Thurston, Springer, Miller, Herd & Titak, Inc. | 358 | 152,11 | 31 | 93,75 | ||||
| 2026-02-12 | 13F | Jane Street Group, Llc | 0 | -100,00 | 0 | |||||
| 2026-02-13 | 13F | Morgan Stanley | 2.128 | 212.700,00 | 185 | |||||
| 2026-02-17 | 13F | Tolleson Wealth Management, Inc. | 13.030 | 0,00 | 1.136 | -23,57 | ||||
| 2026-02-03 | 13F | Milestone Asset Management Group, LLC | 6.256 | -0,90 | 545 | -24,20 | ||||
| 2026-01-08 | 13F | Fermata Advisors, LLC | 0 | -100,00 | 0 | |||||
| 2026-02-10 | 13F | Envestnet Asset Management Inc | 29.387 | 40,74 | 2.562 | 7,61 | ||||
| 2026-02-11 | 13F | Vise Technologies, Inc. | 6.768 | 590 | ||||||
| 2026-01-15 | 13F | Paladin Wealth, LLC | 14.143 | 1.233 | ||||||
| 2026-02-10 | 13F/A | Northwestern Mutual Wealth Management Co | 498 | 43 | ||||||
| 2026-02-13 | 13F | Arete Wealth Advisors, LLC | 30.647 | 96,04 | 3 | 100,00 | ||||
| 2026-02-12 | 13F | Gerber Kawasaki Wealth & Investment Management | 0 | -100,00 | 0 | |||||
| 2026-01-20 | 13F | AdvisorNet Financial, Inc | 1.247 | -33,92 | 109 | -49,77 | ||||
| 2026-02-12 | 13F | Great Valley Advisor Group, Inc. | 6.000 | 523 | ||||||
| 2026-02-06 | 13F | Larson Financial Group LLC | 100 | 0,00 | 9 | -27,27 |