Grundlæggende statistik
| Institutionelle ejere | 175 total, 175 long only, 0 short only, 0 long/short - change of 5,42% MRQ |
| Gennemsnitlig porteføljeallokering | 0.8934 % - change of 7,29% MRQ |
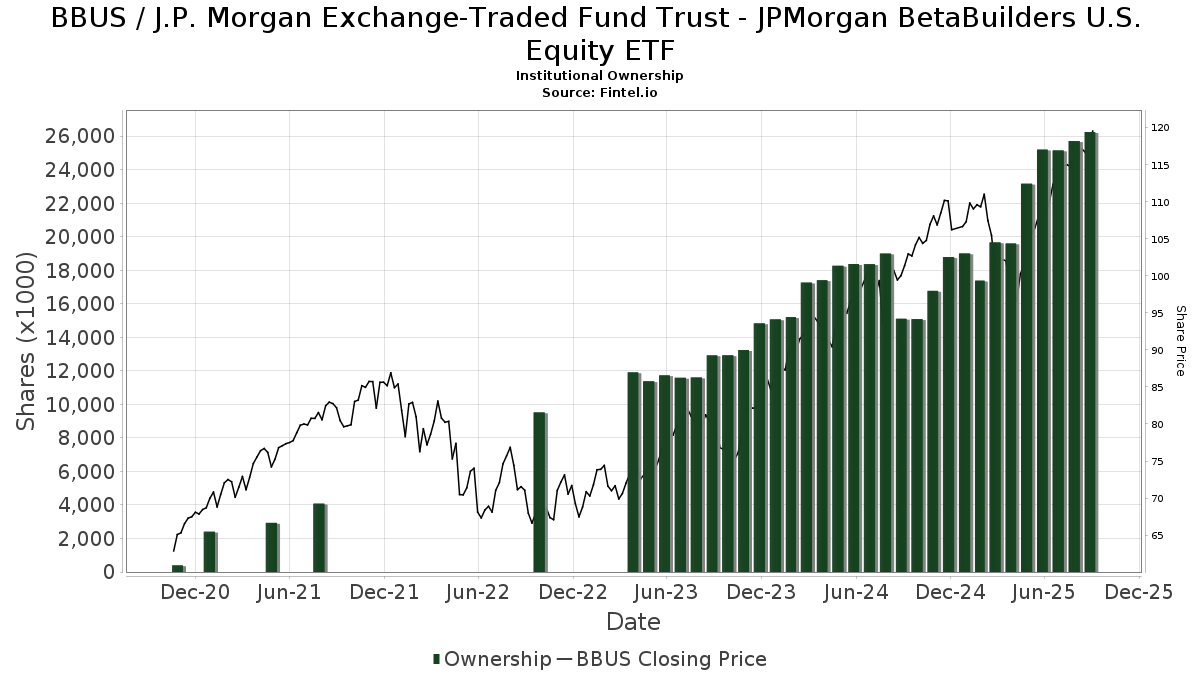
| Institutionelle aktier (lange) | 26.249.004 (ex 13D/G) - change of 1,41MM shares 5,68% MRQ |
| Institutionel værdi (lang) | $ 2.454.867 USD ($1000) |
Institutionelt ejerskab og aktionærer
J.P. Morgan Exchange-Traded Fund Trust - JPMorgan BetaBuilders U.S. Equity ETF (US:BBUS) har 175 institutionelle ejere og aktionærer, der har indsendt 13D/G- eller 13F-formularer til Securities Exchange Commission (SEC). Disse institutioner har i alt 26,249,004 aktier. Største aktionærer omfatter Jpmorgan Chase & Co, Janney Montgomery Scott LLC, Vestmark Advisory Solutions, Inc., LPL Financial LLC, Morgan Stanley, Envestnet Asset Management Inc, PFSEX - RiskPro® 30+ Fund Class R, Cornerstone Wealth Management, LLC, Gradient Investments LLC, and Kelly Financial Group Llc .
J.P. Morgan Exchange-Traded Fund Trust - JPMorgan BetaBuilders U.S. Equity ETF (BATS:BBUS) institutionel ejerskabsstruktur viser aktuelle positioner i virksomheden efter institutioner og fonde, samt seneste ændringer i positionsstørrelse. Større aktionærer kan omfatte individuelle investorer, investeringsforeninger, hedgefonde eller institutioner. Skema 13D angiver, at investoren besidder (eller besidder) mere end 5 % af virksomheden og har til hensigt (eller har til hensigt at) aktivt at forfølge en ændring i forretningsstrategi. Skema 13G indikerer en passiv investering på over 5%.
The share price as of September 18, 2025 is 120,21 / share. Previously, on September 19, 2024, the share price was 103,07 / share. This represents an increase of 16,63% over that period.
Fondens stemningsscore
Fund Sentiment Score (fka Ownership Accumulation Score) finder de aktier, der bliver mest købt af fonde. Det er resultatet af en sofistikeret, multi-faktor kvantitativ model, der identificerer virksomheder med de højeste niveauer af institutionel akkumulering. Scoringsmodellen bruger en kombination af den samlede stigning i oplyste ejere, ændringerne i porteføljeallokeringer i disse ejere og andre målinger. Tallet går fra 0 til 100, hvor højere tal indikerer et højere niveau af akkumulering for sine jævnaldrende, og 50 er gennemsnittet.
Opdateringsfrekvens: Dagligt
Se Ownership Explorer, som giver en liste over højest rangerende virksomheder.
AI+ Ask Fintel’s AI assistant about J.P. Morgan Exchange-Traded Fund Trust - JPMorgan BetaBuilders U.S. Equity ETF.
Thinking of good questions…
Institutionel Put/Call-forhold
Ud over at indberette standardaktie- og gældsudstedelser skal institutter med mere end 100 mill. aktiver under forvaltning også oplyse deres put- og call-optionsbeholdninger. Da salgsoptioner generelt indikerer negativ stemning, og købsoptioner indikerer positiv stemning, kan vi få en fornemmelse af den overordnede institutionelle stemning ved at plotte forholdet mellem put og kald. Diagrammet til højre viser det historiske put/call-forhold for dette instrument.
Brug af Put/Call Ratio som en indikator for investorernes stemning overvinder en af de vigtigste mangler ved at bruge totalt institutionelt ejerskab, som er, at en betydelig mængde af aktiver under forvaltning investeres passivt for at spore indekser. Passivt forvaltede fonde køber typisk ikke optioner, så indikatoren for put/call-forholdet følger mere nøje følelsen af aktivt forvaltede fonde.
13F og NPORT arkivering
Detaljer om 13F-arkivering er gratis. Detaljer om NP-ansøgninger kræver et premium-medlemskab. Grønne rækker angiver nye positioner. Røde rækker angiver lukkede positioner. Klik på linket ikon for at se den fulde transaktionshistorik.
Opgrader
for at låse premium-data op og eksportere til Excel ![]() .
.
| Fil dato | Kilde | Investor | Type | Gennemsnitlig pris (Øst) |
Aktier | Δ Aktier (%) |
Rapporteret Værdi ($1000) |
Δ Værdi (%) |
Port Alloc (%) |
|
|---|---|---|---|---|---|---|---|---|---|---|
| 2025-07-31 | 13F | MN Wealth Advisors, LLC | 226.009 | -16,53 | 25.295 | -7,41 | ||||
| 2025-08-13 | 13F | Jones Financial Companies Lllp | 0 | -100,00 | 0 | |||||
| 2025-07-29 | 13F | Mattson Financial Services, LLC | 24.680 | 36,29 | 2.762 | 51,18 | ||||
| 2025-08-11 | 13F | Semus Wealth Partners LLC | 5.763 | -6,48 | 645 | 3,70 | ||||
| 2025-08-13 | 13F | Gateway Wealth Partners, LLC | 20.627 | -25,14 | 2.309 | -16,98 | ||||
| 2025-07-23 | 13F | Prime Capital Investment Advisors, LLC | 0 | -100,00 | 0 | |||||
| 2025-08-11 | 13F | Private Advisor Group, LLC | 56.461 | -10,98 | 6.319 | -1,23 | ||||
| 2025-08-12 | 13F | Jpmorgan Chase & Co | 3.724.792 | -15,93 | 416.879 | -6,74 | ||||
| 2025-07-17 | 13F | Archford Capital Strategies, LLC | 62.679 | -26,97 | 7.015 | -18,99 | ||||
| 2025-07-28 | 13F | Rosenberg Matthew Hamilton | 64.336 | 121,38 | 7.200 | 145,65 | ||||
| 2025-08-01 | 13F | Bank of Jackson Hole Trust | 33 | 0,00 | 4 | 0,00 | ||||
| 2025-07-30 | 13F | Fingerlakes Wealth Management, Inc. | 25.645 | 11,39 | 2.870 | 23,60 | ||||
| 2025-08-12 | 13F | Tradition Wealth Management, LLC | 319.774 | 8,24 | 35.789 | 20,07 | ||||
| 2025-08-04 | 13F | IFG Advisory, LLC | 133.667 | -25,62 | 14.960 | -17,49 | ||||
| 2025-07-28 | 13F | Mutual Advisors, LLC | 4.713 | 16,60 | 544 | 35,07 | ||||
| 2025-07-24 | 13F | JB Capital LLC | 1.959 | 219 | ||||||
| 2025-08-14 | 13F | D. E. Shaw & Co., Inc. | 2.218 | 248 | ||||||
| 2025-08-14 | 13F | Herold Advisors, Inc. | 2.000 | 0,00 | 224 | 10,95 | ||||
| 2025-08-13 | 13F | GeoWealth Management, LLC | 21.595 | -0,91 | 2.417 | 9,92 | ||||
| 2025-08-14 | 13F | Integrated Wealth Concepts LLC | 99.917 | 21,17 | 11.183 | 34,42 | ||||
| 2025-07-25 | 13F | Envestnet Portfolio Solutions, Inc. | 6.195 | -11,79 | 693 | -2,12 | ||||
| 2025-04-11 | 13F | Principia Wealth Advisory, LLC | 0 | -100,00 | 0 | -100,00 | ||||
| 2025-08-07 | 13F | Shared Vision Wealth Group LLC | 3.501 | 15,97 | 401 | 31,91 | ||||
| 2025-08-14 | 13F | Two Sigma Investments, Lp | 127.900 | 14.315 | ||||||
| 2025-07-21 | 13F | Ascent Group, LLC | 45.248 | 7,92 | 5.064 | 19,72 | ||||
| 2025-08-05 | 13F | Frederick Financial Consultants, LLC | 1.887 | 211 | ||||||
| 2025-08-05 | 13F | Bank of New York Mellon Corp | 2.302 | 0,00 | 258 | 10,78 | ||||
| 2025-08-06 | 13F | Hoxton Planning & Management, LLC | 10.672 | 367,46 | 1.194 | 419,13 | ||||
| 2025-08-14 | 13F | Riggs Asset Managment Co. Inc. | 111 | 0,00 | 12 | 9,09 | ||||
| 2025-08-14 | 13F | Bank Of America Corp /de/ | 107.330 | 147,13 | 12.012 | 174,18 | ||||
| 2025-08-06 | 13F | AE Wealth Management LLC | 43 | -63,87 | 5 | -66,67 | ||||
| 2025-07-25 | 13F | Sequoia Financial Advisors, LLC | 2.522 | 18,91 | 282 | 32,39 | ||||
| 2025-05-02 | 13F | First Command Advisory Services, Inc. | 0 | -100,00 | 0 | |||||
| 2025-08-06 | 13F | Moors & Cabot, Inc. | 0 | -100,00 | 0 | |||||
| 2025-08-12 | 13F | Wayfinding Financial, LLC | 45.609 | -2,57 | 5 | 25,00 | ||||
| 2025-08-14 | 13F | Qube Research & Technologies Ltd | 863 | -52,87 | 97 | -47,83 | ||||
| 2025-08-13 | 13F | Renaissance Technologies Llc | 6.400 | 48,84 | 716 | 65,36 | ||||
| 2025-08-06 | 13F | Mascagni Wealth Management, Inc. | 1.984 | -34,54 | 222 | -27,21 | ||||
| 2025-08-08 | 13F | Good Life Advisors, LLC | 7.934 | 5,42 | 888 | 16,86 | ||||
| 2025-08-04 | 13F | Assetmark, Inc | 465.258 | -10,19 | 52.072 | -0,38 | ||||
| 2025-08-12 | 13F | Gladstone Institutional Advisory LLC | 5.751 | 0,12 | 644 | 11,05 | ||||
| 2025-08-13 | 13F | Townsquare Capital Llc | 0 | -100,00 | 0 | |||||
| 2025-07-25 | 13F | Welch Group, LLC | 2.227 | 0,00 | 249 | 11,66 | ||||
| 2025-07-08 | 13F | Webster Bank, N. A. | 192 | 0,00 | 21 | 10,53 | ||||
| 2025-08-14 | 13F | Goldman Sachs Group Inc | 38.477 | 54,12 | 4.306 | 71,01 | ||||
| 2025-07-15 | 13F | Well Done, LLC | 1.947 | 218 | ||||||
| 2025-08-12 | 13F | Change Path, LLC | 102.788 | -9,00 | 11.504 | 0,96 | ||||
| 2025-08-14 | 13F | Susquehanna International Group, Llp | 29.280 | -24,36 | 3.277 | -16,08 | ||||
| 2025-05-14 | 13F | CIBC Private Wealth Group, LLC | 0 | -100,00 | 0 | |||||
| 2025-08-12 | 13F | Archer Investment Corp | 2.691 | 10,70 | 301 | 22,86 | ||||
| 2025-07-10 | 13F | Family Legacy Financial Solutions, LLC | 242 | 27 | ||||||
| 2025-08-15 | 13F | Kestra Advisory Services, LLC | 2.177 | 0,14 | 244 | 10,96 | ||||
| 2025-07-22 | 13F | Firethorn Wealth Partners, Llc | 25.429 | 11,08 | 2.846 | 23,26 | ||||
| 2025-08-08 | 13F | Emerald Investment Partners, Llc | 388 | 0,00 | 43 | 10,26 | ||||
| 2025-08-06 | 13F | Golden State Wealth Management, LLC | 2.321 | 6,81 | 260 | 18,26 | ||||
| 2025-07-09 | 13F | Massmutual Trust Co Fsb/adv | 76.264 | -12,00 | 8.535 | -2,38 | ||||
| 2025-08-08 | 13F | National Mutual Insurance Federation of Agricultural Cooperatives | 463.000 | 0,00 | 51.819 | 10,93 | ||||
| 2025-07-08 | 13F/A | Salem Investment Counselors Inc | 14 | 0,00 | 2 | 0,00 | ||||
| 2025-07-14 | 13F | Park Avenue Securities Llc | 206.411 | -0,42 | 23 | 15,00 | ||||
| 2025-07-23 | 13F | Fortis Advisors, LLC | 2.053 | -33,41 | 230 | -26,37 | ||||
| 2025-08-12 | 13F | Bravias Capital Group, LLC | 106.956 | 2,96 | 11.971 | 14,22 | ||||
| 2025-05-09 | 13F | Cary Street Partners Financial Llc | 0 | -100,00 | 0 | |||||
| 2025-04-29 | 13F | Financial Network Wealth Management LLC | 9.237 | 12,54 | 1 | |||||
| 2025-08-11 | 13F | Pineridge Advisors LLC | 9 | 1 | ||||||
| 2025-07-16 | 13F | ORG Partners LLC | 25.649 | 2.867 | ||||||
| 2025-07-08 | 13F | Paladin Wealth, LLC | 16.058 | -11,89 | 1.797 | -2,23 | ||||
| 2025-09-04 | 13F/A | Advisor Group Holdings, Inc. | 271.521 | 53,35 | 29.470 | 64,95 | ||||
| 2025-08-12 | 13F | Global Retirement Partners, LLC | 9.297 | 152,22 | 1.041 | 166,67 | ||||
| 2025-07-14 | 13F | AdvisorNet Financial, Inc | 21.851 | 15,12 | 2.446 | 27,74 | ||||
| 2025-08-13 | 13F | EverSource Wealth Advisors, LLC | 129 | 0,00 | 14 | 7,69 | ||||
| 2025-05-15 | 13F/A | Orion Portfolio Solutions, LLC | 119.290 | -8,15 | 12.035 | -12,51 | ||||
| 2025-08-14 | 13F | UBS Group AG | 106 | 1.666,67 | 12 | |||||
| 2025-08-08 | 13F | Creative Planning | 206.981 | -76,82 | 23.165 | -74,29 | ||||
| 2025-08-14 | 13F | Mariner, LLC | 2.218 | -18,25 | 248 | -9,16 | ||||
| 2025-08-19 | 13F | Advisory Services Network, LLC | 14.977 | 5,06 | 1.716 | 19,26 | ||||
| 2025-08-14 | 13F | Mml Investors Services, Llc | 170.383 | 3,49 | 19 | 18,75 | ||||
| 2025-08-11 | 13F | Rothschild Investment Llc | 22 | 0,00 | 2 | 0,00 | ||||
| 2025-08-13 | 13F | Russell Investments Group, Ltd. | 10 | 0,00 | 1 | 0,00 | ||||
| 2025-08-19 | 13F | National Asset Management, Inc. | 0 | -100,00 | 0 | |||||
| 2025-07-11 | 13F | Adirondack Trust Co | 2.935 | 25,32 | 328 | 38,98 | ||||
| 2025-07-17 | 13F | Halbert Hargrove Global Advisors, Llc | 8 | -11,11 | 1 | |||||
| 2025-08-11 | 13F | Nations Financial Group Inc, /ia/ /adv | 14.381 | 20,67 | 1.610 | 33,86 | ||||
| 2025-07-31 | 13F | Cambridge Investment Research Advisors, Inc. | 482.627 | -12,17 | 54 | -1,82 | ||||
| 2025-06-30 | NP | PFJDX - RiskPro® Dynamic 20-30 Fund Class R | 180.008 | -13,58 | 18.044 | -20,58 | ||||
| 2025-07-23 | 13F | Kingswood Wealth Advisors, Llc | 12.666 | 3,15 | 1.418 | 14,46 | ||||
| 2025-08-04 | 13F | Creative Financial Designs Inc /adv | 9 | 1 | ||||||
| 2025-08-13 | 13F | Beacon Pointe Advisors, LLC | 2.693 | 0,00 | 301 | 11,07 | ||||
| 2025-08-06 | 13F | Commonwealth Equity Services, Llc | 14.301 | 31,70 | 2 | 0,00 | ||||
| 2025-08-07 | 13F | Nwam Llc | 13.585 | 0,41 | 1.561 | 14,44 | ||||
| 2025-08-07 | 13F | Allworth Financial LP | 822 | 20,88 | 92 | 37,31 | ||||
| 2025-07-15 | 13F | Kelly Financial Group Llc | 486.677 | 11,28 | 54.469 | 23,44 | ||||
| 2025-07-21 | 13F | Ameriflex Group, Inc. | 0 | -100,00 | 0 | |||||
| 2025-08-13 | 13F | Twin Peaks Wealth Advisors, LLC | 16.058 | 2,89 | 1.869 | 23,30 | ||||
| 2025-08-18 | 13F | Geneos Wealth Management Inc. | 8.143 | 18,37 | 911 | 31,27 | ||||
| 2025-08-12 | 13F | Cornerstone Wealth Management, LLC | 687.686 | -4,96 | 76.966 | 5,43 | ||||
| 2025-08-12 | 13F | Jacobi Capital Management LLC | 25.578 | 25,98 | 2.863 | 39,75 | ||||
| 2025-07-28 | 13F | WealthPlan Investment Management, LLC | 34.573 | 3.869 | ||||||
| 2025-08-14 | 13F | GWM Advisors LLC | 440 | 0,23 | 49 | 11,36 | ||||
| 2025-08-13 | 13F | VestGen Advisors, LLC | 41.528 | 88,91 | 4.748 | 114,16 | ||||
| 2025-08-11 | 13F | Aptus Capital Advisors, LLC | 55.270 | 31,28 | 6.186 | 45,63 | ||||
| 2025-08-14 | 13F | Ancora Advisors, LLC | 1.609 | 0,00 | 180 | 11,11 | ||||
| 2025-08-01 | 13F/A | GGM Financials LLC | 4.361 | -0,02 | 488 | 10,91 | ||||
| 2025-07-14 | 13F | Signature Securities Group Corporation | 2.930 | -2,40 | 328 | 8,28 | ||||
| 2025-07-16 | 13F | Wealth Group Ltd | 220.954 | 350,12 | 24.729 | 399,37 | ||||
| 2025-07-24 | 13F | 3Chopt Investment Partners, LLC | 42.242 | -13,50 | 4.728 | -4,06 | ||||
| 2025-08-08 | 13F | Gts Securities Llc | 0 | -100,00 | 0 | |||||
| 2025-08-08 | 13F/A | Ignite Planners, LLC | 14.793 | 7,52 | 1.682 | 21,09 | ||||
| 2025-08-12 | 13F | J.w. Cole Advisors, Inc. | 8.715 | 11,79 | 975 | 24,05 | ||||
| 2025-07-17 | 13F | Janney Montgomery Scott LLC | 3.120.488 | -1,54 | 349 | 9,40 | ||||
| 2025-07-23 | 13F | HMV Wealth Advisors, LLC | 0 | -100,00 | 0 | |||||
| 2025-08-11 | 13F | Vanguard Group Inc | 5.958 | -11,22 | 667 | -1,62 | ||||
| 2025-07-16 | 13F | Blue Oak Capital, LLC | 99.537 | -17,72 | 11.140 | -8,72 | ||||
| 2025-08-13 | 13F | IAG Wealth Partners, LLC | 22.381 | 4.776,03 | 2.505 | 5.343,48 | ||||
| 2025-07-08 | 13F | Gradient Investments LLC | 581.991 | 3,13 | 65.136 | 14,41 | ||||
| 2025-08-13 | 13F | Northwestern Mutual Wealth Management Co | 941 | -3,59 | 105 | 7,14 | ||||
| 2025-08-14 | 13F | Fmr Llc | 4.857 | 48,03 | 544 | 64,05 | ||||
| 2025-07-30 | 13F | TFB Advisors LLC | 12.852 | -9,83 | 1.438 | 0,07 | ||||
| 2025-07-22 | 13F | Sutton Place Investors Llc | 20.192 | 1,02 | 2.260 | 12,05 | ||||
| 2025-08-14 | 13F | Smartleaf Asset Management LLC | 285 | 32 | ||||||
| 2025-07-25 | 13F | Atria Wealth Solutions, Inc. | 3.555 | 3,74 | 398 | 15,07 | ||||
| 2025-07-30 | 13F | Drive Wealth Management, Llc | 132.922 | 18,10 | 14.877 | 31,02 | ||||
| 2025-08-14 | 13F | Royal Bank Of Canada | 70.088 | -10,36 | 7.845 | -0,56 | ||||
| 2025-07-24 | 13F | Robertson Stephens Wealth Management, LLC | 441.230 | 60,09 | 49.383 | 77,59 | ||||
| 2025-08-15 | 13F | Morgan Stanley | 1.798.161 | 11,31 | 201.250 | 23,48 | ||||
| 2025-08-05 | 13F | 5T Wealth, LLC | 100.779 | 11,97 | 11.279 | 24,22 | ||||
| 2025-08-12 | 13F | WealthTrak Capital Management LLC | 63 | -44,74 | 7 | -36,36 | ||||
| 2025-07-24 | 13F | Blair William & Co/il | 467 | 678,33 | 52 | 766,67 | ||||
| 2025-08-12 | 13F | O'shaughnessy Asset Management, Llc | 190 | -92,18 | 21 | -91,43 | ||||
| 2025-08-13 | 13F | WCG Wealth Advisors LLC | 10.364 | -3,26 | 1.160 | 7,31 | ||||
| 2025-07-23 | 13F | Clear Creek Financial Management, LLC | 18.938 | 12,93 | 2.120 | 25,31 | ||||
| 2025-08-11 | 13F | HighTower Advisors, LLC | 9.052 | -8,64 | 1.013 | 1,40 | ||||
| 2025-07-24 | 13F | JNBA Financial Advisors | 136 | 0,00 | 15 | 15,38 | ||||
| 2025-08-12 | 13F | Proequities, Inc. | 0 | 0 | ||||||
| 2025-08-14 | 13F | Jane Street Group, Llc | 18.497 | 2.070 | ||||||
| 2025-08-13 | 13F | Cary Street Partner Investment Advisory Llc | 19.214 | -6,17 | 2.150 | 4,12 | ||||
| 2025-07-16 | 13F | Perigon Wealth Management, LLC | 402.511 | 0,51 | 45.049 | 11,50 | ||||
| 2025-07-24 | 13F | KFA Private Wealth Group, LLC | 2.212 | 248 | ||||||
| 2025-08-14 | 13F | Federation des caisses Desjardins du Quebec | 50 | 6 | ||||||
| 2025-08-15 | 13F/A | Florida Financial Advisors, Llc | 104.893 | -0,78 | 11.740 | 10,07 | ||||
| 2025-08-13 | 13F | Marshall Wace, Llp | 7.059 | 790 | ||||||
| 2025-08-11 | 13F | Lake Street Financial Llc | 44.213 | -7,23 | 4.948 | 2,91 | ||||
| 2025-08-14 | 13F | CoreCap Advisors, LLC | 268 | 208,05 | 30 | 262,50 | ||||
| 2025-08-26 | 13F/A | Thrivent Financial For Lutherans | 29.344 | 3 | ||||||
| 2025-07-25 | 13F | Cwm, Llc | 119.721 | 131,68 | 13 | 160,00 | ||||
| 2025-07-22 | 13F | Grimes & Company, Inc. | 2.200 | 0,27 | 246 | 11,31 | ||||
| 2025-07-17 | 13F | Sound Income Strategies, LLC | 172 | 0,00 | 19 | 11,76 | ||||
| 2025-07-21 | 13F | Ameritas Advisory Services, LLC | 191 | 21 | ||||||
| 2025-07-18 | 13F | Lockerman Financial Group, Inc. | 26.442 | -8,56 | 2.959 | 1,44 | ||||
| 2025-04-21 | 13F | Ronald Blue Trust, Inc. | 0 | -100,00 | 0 | -100,00 | ||||
| 2025-07-17 | 13F | Kelly Financial Services LLC | 4.255 | 6,56 | 476 | 18,41 | ||||
| 2025-08-14 | 13F | Wells Fargo & Company/mn | 1.404 | 157 | ||||||
| 2025-07-28 | 13F | Harbour Investments, Inc. | 339 | 0,30 | 38 | 8,82 | ||||
| 2025-08-08 | 13F | SBI Securities Co., Ltd. | 132 | 59,04 | 15 | 75,00 | ||||
| 2025-08-11 | 13F | Synergy Investment Management, LLC | 0 | -100,00 | 0 | |||||
| 2025-08-14 | 13F | Ameriprise Financial Inc | 73.400 | -28,52 | 8.215 | -20,71 | ||||
| 2025-08-14 | 13F | Great Valley Advisor Group, Inc. | 74.533 | 268,74 | 8.342 | 309,07 | ||||
| 2025-08-15 | 13F | Equitable Holdings, Inc. | 30.874 | -27,75 | 3.455 | -19,86 | ||||
| 2025-08-11 | 13F | Citigroup Inc | 6.960 | 779 | ||||||
| 2025-08-12 | 13F | LPL Financial LLC | 2.804.857 | -0,05 | 313.920 | 10,88 | ||||
| 2025-08-04 | 13F | Spire Wealth Management | 1.236 | 189,46 | 138 | 220,93 | ||||
| 2025-08-15 | 13F | Brown Financial Advisors | 31.109 | -1,58 | 3.482 | 9,19 | ||||
| 2025-08-04 | 13F | Pensionmark Financial Group, Llc | 3.689 | -19,86 | 413 | -11,21 | ||||
| 2025-08-01 | 13F | Envestnet Asset Management Inc | 1.631.843 | 2,62 | 182.636 | 13,84 | ||||
| 2025-08-14 | 13F | Comerica Bank | 1.262 | -1,87 | 141 | 9,30 | ||||
| 2025-08-08 | 13F | Cetera Investment Advisers | 360.284 | 0,34 | 40.323 | 11,31 | ||||
| 2025-08-15 | 13F | Tower Research Capital LLC (TRC) | 7.856 | 167,03 | 879 | 196,96 | ||||
| 2025-05-02 | 13F | Wealthfront Advisers Llc | 0 | -100,00 | 0 | -100,00 | ||||
| 2025-08-05 | 13F | Cherry Tree Wealth Management, LLC | 208 | 0,00 | 23 | 15,00 | ||||
| 2025-07-25 | 13F | NorthRock Partners, LLC | 0 | -100,00 | 0 | |||||
| 2025-08-14 | 13F | Harwood Advisory Group, LLC | 0 | -100,00 | 0 | -100,00 | ||||
| 2025-06-30 | NP | PFSEX - RiskPro® 30+ Fund Class R | 787.862 | 75,74 | 78.975 | 61,50 | ||||
| 2025-08-29 | 13F | Total Investment Management Inc | 1.765 | 198 | ||||||
| 2025-07-16 | 13F | Owen LaRue, LLC | 4.880 | 546 | ||||||
| 2025-08-18 | 13F | N.E.W. Advisory Services LLC | 0 | -100,00 | 0 | |||||
| 2025-07-18 | 13F | Nabity-Jensen Investment Management Inc | 5.857 | 0,00 | 656 | 11,02 | ||||
| 2025-08-01 | 13F | Rossby Financial, LCC | 625 | 0,00 | 70 | 11,29 | ||||
| 2025-08-05 | 13F | Strategic Financial Concepts, LLC | 4.224 | -73,53 | 473 | -70,67 | ||||
| 2025-07-10 | 13F | Wealth Enhancement Advisory Services, Llc | 6.365 | -17,54 | 721 | -7,33 | ||||
| 2025-07-11 | 13F | Farther Finance Advisors, LLC | 23.965 | -26,62 | 2.682 | -18,90 | ||||
| 2025-07-14 | 13F | Ridgewood Investments LLC | 1.149 | 0,00 | 129 | 11,30 | ||||
| 2025-07-25 | 13F | Richardson Financial Services Inc. | 6.358 | 6,71 | 711 | 18,14 | ||||
| 2025-08-06 | 13F | Vestmark Advisory Solutions, Inc. | 2.856.818 | 108,05 | 319.735 | 130,80 | ||||
| 2025-08-08 | 13F | Capital Investment Advisory Services, LLC | 2.433 | -12,76 | 272 | -3,20 | ||||
| 2025-07-30 | 13F | LGT Financial Advisors LLC | 887 | 0,11 | 99 | 11,24 | ||||
| 2025-08-14 | 13F | Raymond James Financial Inc | 45.168 | 108,29 | 5.055 | 131,14 | ||||
| 2025-08-18 | 13F | Goodman Advisory Group, LLC | 0 | -100,00 | 0 | |||||
| 2025-07-30 | 13F | Whittier Trust Co Of Nevada Inc | 7.193 | 20,63 | 805 | 33,94 | ||||
| 2025-08-08 | 13F | Empower Advisory Group, LLC | 0 | -100,00 | 0 | |||||
| 2025-07-24 | 13F | IFP Advisors, Inc | 30.219 | 38,59 | 3.382 | 53,80 | ||||
| 2025-05-13 | 13F | Northern Trust Corp | 0 | -100,00 | 0 | |||||
| 2025-05-12 | 13F | Independent Advisor Alliance | 0 | -100,00 | 0 | |||||
| 2025-08-01 | 13F | Schmidt P J Investment Management Inc | 78.025 | -0,71 | 8.733 | 10,14 | ||||
| 2025-08-14 | 13F | Betterment LLC | 2.049 | -68,66 | 0 | |||||
| 2025-08-27 | 13F/A | Brinker Capital Investments, LLC | 118.942 | -0,29 | 13.312 | 10,61 | ||||
| 2025-07-29 | 13F | Private Trust Co Na | 7.728 | -13,10 | 865 | -3,68 | ||||
| 2025-08-12 | 13F | Absolute Capital Management, LLC | 2.028 | -8,40 | 227 | 1,79 | ||||
| 2025-05-14 | 13F | Zacks Investment Management | 0 | -100,00 | 0 | |||||
| 2025-07-25 | 13F | We Are One Seven, LLC | 32.379 | 3.624 | ||||||
| 2025-07-21 | 13F | Triad Wealth Partners, LLC | 10.865 | 0,79 | 1.216 | 11,87 |