Grundlæggende statistik
| Institutionelle ejere | 123 total, 123 long only, 0 short only, 0 long/short - change of 1,65% MRQ |
| Gennemsnitlig porteføljeallokering | 2.0503 % - change of -0,70% MRQ |
| Institutionelle aktier (lange) | 122.250.735 (ex 13D/G) - change of -1,77MM shares -1,43% MRQ |
| Institutionel værdi (lang) | $ 8.159.979 USD ($1000) |
Institutionelt ejerskab og aktionærer
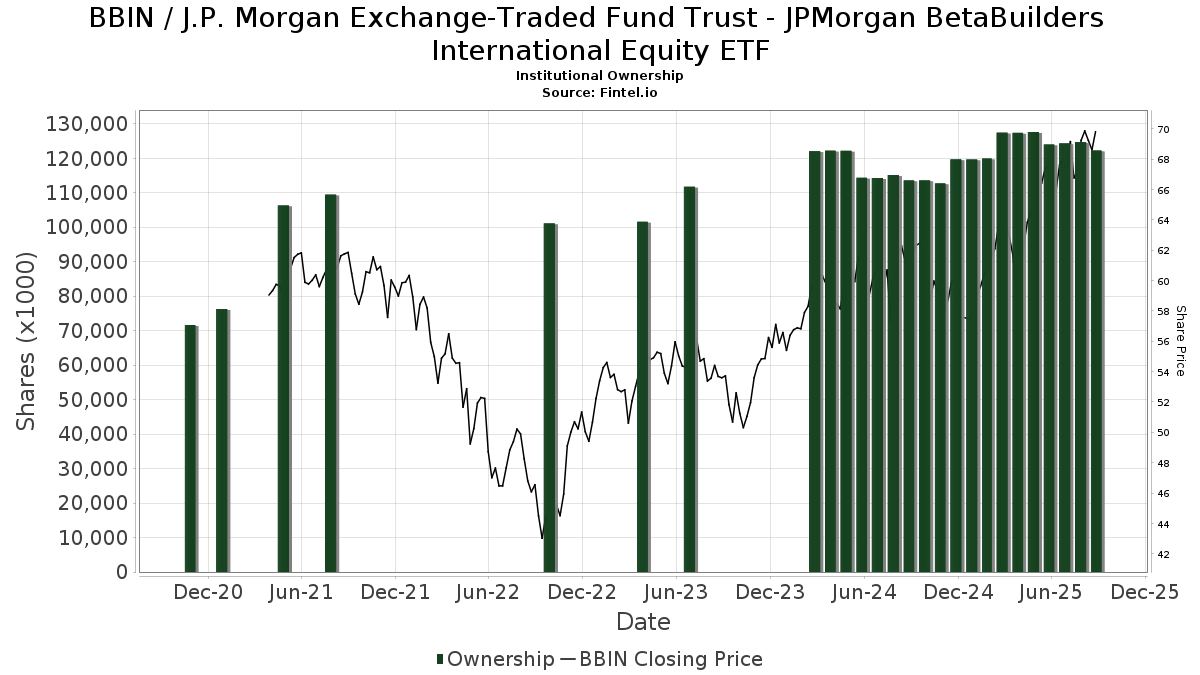
J.P. Morgan Exchange-Traded Fund Trust - JPMorgan BetaBuilders International Equity ETF (US:BBIN) har 123 institutionelle ejere og aktionærer, der har indsendt 13D/G- eller 13F-formularer til Securities Exchange Commission (SEC). Disse institutioner har i alt 122,250,735 aktier. Største aktionærer omfatter Jpmorgan Chase & Co, JOBEX - JPMorgan SmartRetirement* Blend 2040 Fund Class I, JPSRX - JPMorgan SmartRetirement* Blend 2035 Fund Class I, JMSSX - JPMorgan SmartRetirement* Blend 2045 Fund Class I, JNEAX - JPMorgan SmartRetirement* Blend 2050 Fund Class I, JRBEX - JPMorgan SmartRetirement* Blend 2030 Fund Class I, JPTBX - JPMorgan SmartRetirement* Blend 2055 Fund Class I, JBSSX - JPMorgan SmartRetirement* Blend 2025 Fund Class I, JACSX - JPMorgan SmartRetirement Blend 2060 Fund Class I, and JIJSX - JPMorgan SmartRetirement* Blend Income Fund Class I .
J.P. Morgan Exchange-Traded Fund Trust - JPMorgan BetaBuilders International Equity ETF (BATS:BBIN) institutionel ejerskabsstruktur viser aktuelle positioner i virksomheden efter institutioner og fonde, samt seneste ændringer i positionsstørrelse. Større aktionærer kan omfatte individuelle investorer, investeringsforeninger, hedgefonde eller institutioner. Skema 13D angiver, at investoren besidder (eller besidder) mere end 5 % af virksomheden og har til hensigt (eller har til hensigt at) aktivt at forfølge en ændring i forretningsstrategi. Skema 13G indikerer en passiv investering på over 5%.
The share price as of September 8, 2025 is 70,04 / share. Previously, on September 9, 2024, the share price was 60,88 / share. This represents an increase of 15,05% over that period.
Fondens stemningsscore
Fund Sentiment Score (fka Ownership Accumulation Score) finder de aktier, der bliver mest købt af fonde. Det er resultatet af en sofistikeret, multi-faktor kvantitativ model, der identificerer virksomheder med de højeste niveauer af institutionel akkumulering. Scoringsmodellen bruger en kombination af den samlede stigning i oplyste ejere, ændringerne i porteføljeallokeringer i disse ejere og andre målinger. Tallet går fra 0 til 100, hvor højere tal indikerer et højere niveau af akkumulering for sine jævnaldrende, og 50 er gennemsnittet.
Opdateringsfrekvens: Dagligt
Se Ownership Explorer, som giver en liste over højest rangerende virksomheder.
Institutionel Put/Call-forhold
Ud over at indberette standardaktie- og gældsudstedelser skal institutter med mere end 100 mill. aktiver under forvaltning også oplyse deres put- og call-optionsbeholdninger. Da salgsoptioner generelt indikerer negativ stemning, og købsoptioner indikerer positiv stemning, kan vi få en fornemmelse af den overordnede institutionelle stemning ved at plotte forholdet mellem put og kald. Diagrammet til højre viser det historiske put/call-forhold for dette instrument.
Brug af Put/Call Ratio som en indikator for investorernes stemning overvinder en af de vigtigste mangler ved at bruge totalt institutionelt ejerskab, som er, at en betydelig mængde af aktiver under forvaltning investeres passivt for at spore indekser. Passivt forvaltede fonde køber typisk ikke optioner, så indikatoren for put/call-forholdet følger mere nøje følelsen af aktivt forvaltede fonde.
13F og NPORT arkivering
Detaljer om 13F-arkivering er gratis. Detaljer om NP-ansøgninger kræver et premium-medlemskab. Grønne rækker angiver nye positioner. Røde rækker angiver lukkede positioner. Klik på linket ikon for at se den fulde transaktionshistorik.
Opgrader
for at låse premium-data op og eksportere til Excel ![]() .
.
| Fil dato | Kilde | Investor | Type | Gennemsnitlig pris (Øst) |
Aktier | Δ Aktier (%) |
Rapporteret Værdi ($1000) |
Δ Værdi (%) |
Port Alloc (%) |
|
|---|---|---|---|---|---|---|---|---|---|---|
| 2025-07-22 | 13F | Clarius Group, LLC | 89.800 | 0,00 | 6.062 | 9,74 | ||||
| 2025-07-18 | 13F | Truist Financial Corp | 10.764 | 50,42 | 727 | 65,00 | ||||
| 2025-08-11 | 13F | Aptus Capital Advisors, LLC | 391.319 | 26,70 | 26.414 | 39,05 | ||||
| 2025-08-14 | 13F | Ancora Advisors, LLC | 924 | 0,00 | 62 | 10,71 | ||||
| 2025-07-31 | 13F | MN Wealth Advisors, LLC | 73.890 | -12,41 | 4.988 | -3,87 | ||||
| 2025-08-11 | 13F | Principal Securities, Inc. | 1.687 | 114 | ||||||
| 2025-08-11 | 13F | Private Advisor Group, LLC | 39.303 | 5,89 | 2.653 | 16,21 | ||||
| 2025-07-25 | 13F | NorthRock Partners, LLC | 0 | -100,00 | 0 | |||||
| 2025-07-24 | 13F | 3Chopt Investment Partners, LLC | 23.613 | -2,75 | 1.594 | 6,70 | ||||
| 2025-08-13 | 13F | Gateway Wealth Partners, LLC | 89.890 | 9,70 | 6.068 | 20,40 | ||||
| 2025-08-12 | 13F | Wayfinding Financial, LLC | 16.356 | 1,42 | 1 | |||||
| 2025-04-29 | 13F | Financial Network Wealth Management LLC | 2.627 | 0 | ||||||
| 2025-08-14 | 13F | Fmr Llc | 3.320 | 227,42 | 224 | 261,29 | ||||
| 2025-08-11 | 13F | FSA Wealth Management LLC | 118 | 8 | ||||||
| 2025-08-08 | 13F/A | Ignite Planners, LLC | 14.213 | 9,91 | 947 | 15,35 | ||||
| 2025-08-12 | 13F | J.w. Cole Advisors, Inc. | 3.575 | 241 | ||||||
| 2025-08-14 | 13F | Jane Street Group, Llc | 0 | -100,00 | 0 | |||||
| 2025-07-17 | 13F | Janney Montgomery Scott LLC | 743.692 | 4,44 | 50 | 16,28 | ||||
| 2025-08-01 | 13F | Rossby Financial, LCC | 324 | 0,00 | 22 | 5,00 | ||||
| 2025-08-12 | 13F | Jpmorgan Chase & Co | 55.166.849 | -0,40 | 3.723.762 | 9,30 | ||||
| 2025-08-01 | 13F | Bank of Jackson Hole Trust | 19 | 0,00 | 1 | 0,00 | ||||
| 2025-08-13 | 13F | Northwestern Mutual Wealth Management Co | 29.724 | -49,73 | 2.006 | -44,83 | ||||
| 2025-07-14 | 13F | AdvisorNet Financial, Inc | 6.714 | 16,77 | 453 | 28,33 | ||||
| 2025-08-05 | 13F | 5T Wealth, LLC | 67.537 | -15,33 | 4.559 | -7,07 | ||||
| 2025-08-12 | 13F | AlphaCore Capital LLC | 1.116 | 0,00 | 75 | 10,29 | ||||
| 2025-07-30 | 13F | TFB Advisors LLC | 8.792 | 14,93 | 593 | 26,17 | ||||
| 2025-05-15 | 13F | Betterment LLC | 0 | -100,00 | 0 | |||||
| 2025-08-14 | 13F | Smartleaf Asset Management LLC | 152 | 10 | ||||||
| 2025-08-12 | 13F | Global Retirement Partners, LLC | 2.848 | 360,10 | 192 | 448,57 | ||||
| 2025-04-25 | 13F | TBH Global Asset Management, LLC | 0 | -100,00 | 0 | -100,00 | ||||
| 2025-07-21 | 13F | Ameriflex Group, Inc. | 0 | -100,00 | 0 | |||||
| 2025-08-14 | 13F | Royal Bank Of Canada | 50.746 | 27,57 | 3.425 | 39,97 | ||||
| 2025-08-12 | 13F | O'shaughnessy Asset Management, Llc | 1.748 | 103,02 | 118 | 125,00 | ||||
| 2025-08-11 | 13F | HighTower Advisors, LLC | 3.490 | 236 | ||||||
| 2025-04-11 | 13F | Principia Wealth Advisory, LLC | 0 | -100,00 | 0 | -100,00 | ||||
| 2025-08-13 | 13F | GeoWealth Management, LLC | 7.684 | 8,84 | 519 | 19,35 | ||||
| 2025-07-30 | 13F | LGT Financial Advisors LLC | 696 | 4,35 | 47 | 14,63 | ||||
| 2025-05-12 | 13F | Greenwich Wealth Management LLC | 0 | -100,00 | 0 | |||||
| 2025-08-04 | 13F | Flagship Harbor Advisors, Llc | 10.885 | -6,27 | 735 | 2,80 | ||||
| 2025-08-13 | 13F | Cary Street Partner Investment Advisory Llc | 9.987 | 9,88 | 674 | 20,57 | ||||
| 2025-08-06 | 13F | AE Wealth Management LLC | 0 | -100,00 | 0 | |||||
| 2025-08-12 | 13F | Proequities, Inc. | 0 | 0 | ||||||
| 2025-08-14 | 13F | Integrated Wealth Concepts LLC | 1.866.207 | 13,44 | 125.969 | 24,50 | ||||
| 2025-08-26 | NP | JMSSX - JPMorgan SmartRetirement* Blend 2045 Fund Class I | 8.124.671 | -5,13 | 548.415 | 4,12 | ||||
| 2025-08-14 | 13F | Old Mission Capital Llc | 17.387 | -84,83 | 1.174 | -83,35 | ||||
| 2025-08-26 | NP | JBSSX - JPMorgan SmartRetirement* Blend 2025 Fund Class I | 3.038.155 | -15,83 | 205.075 | -7,63 | ||||
| 2025-08-13 | 13F | Twin Peaks Wealth Advisors, LLC | 16.126 | 2,41 | 1.111 | 16,70 | ||||
| 2025-07-16 | 13F | Blue Oak Capital, LLC | 30.102 | -24,03 | 2.032 | -16,66 | ||||
| 2025-07-16 | 13F | Perigon Wealth Management, LLC | 445.104 | 3,99 | 30.044 | 14,12 | ||||
| 2025-08-11 | 13F | Synergy Investment Management, LLC | 0 | -100,00 | 0 | |||||
| 2025-08-14 | 13F | Riggs Asset Managment Co. Inc. | 98 | 0,00 | 7 | 0,00 | ||||
| 2025-08-14 | 13F | Wells Fargo & Company/mn | 423 | 29 | ||||||
| 2025-08-15 | 13F | Morgan Stanley | 2.127.058 | -41,72 | 143.577 | -36,03 | ||||
| 2025-08-11 | 13F | Lake Street Financial Llc | 13.364 | -7,02 | 902 | 2,04 | ||||
| 2025-07-21 | 13F | Ascent Group, LLC | 24.347 | 11,67 | 1.643 | 22,61 | ||||
| 2025-08-26 | NP | JIJSX - JPMorgan SmartRetirement* Blend Income Fund Class I | 2.303.317 | 95,70 | 155.474 | 114,78 | ||||
| 2025-07-17 | 13F | Sound Income Strategies, LLC | 78 | 0,00 | 5 | 25,00 | ||||
| 2025-08-18 | 13F | Geneos Wealth Management Inc. | 22.868 | 6,23 | 1.544 | 16,54 | ||||
| 2025-08-14 | 13F | CoreCap Advisors, LLC | 77 | 50,98 | 5 | 66,67 | ||||
| 2025-08-14 | 13F | Bank Of America Corp /de/ | 422.504 | -56,84 | 28.519 | -52,63 | ||||
| 2025-08-26 | NP | JPSRX - JPMorgan SmartRetirement* Blend 2035 Fund Class I | 8.359.799 | -6,59 | 564.286 | 2,52 | ||||
| 2025-08-05 | 13F | Bank of New York Mellon Corp | 3.592 | 242 | ||||||
| 2025-08-11 | 13F | Advisor Resource Council | 0 | -100,00 | 0 | |||||
| 2025-08-26 | NP | JPTBX - JPMorgan SmartRetirement* Blend 2055 Fund Class I | 4.275.866 | -4,19 | 288.621 | 5,15 | ||||
| 2025-08-11 | 13F | Vanguard Group Inc | 2.988 | 202 | ||||||
| 2025-08-14 | 13F | Qube Research & Technologies Ltd | 21.000 | 524.900,00 | 1.418 | |||||
| 2025-07-18 | 13F | Lockerman Financial Group, Inc. | 8.742 | 38,65 | 590 | 52,45 | ||||
| 2025-08-05 | 13F | Key FInancial Inc | 1.044 | -23,18 | 70 | -15,66 | ||||
| 2025-08-04 | 13F | Assetmark, Inc | 328.196 | 12,07 | 22.153 | 23,00 | ||||
| 2025-07-28 | 13F | Harbour Investments, Inc. | 1 | 0,00 | 0 | |||||
| 2025-08-04 | 13F | Spire Wealth Management | 367 | 9,88 | 25 | 20,00 | ||||
| 2025-08-14 | 13F | Ameriprise Financial Inc | 9.006 | 67,55 | 608 | 83,94 | ||||
| 2025-07-14 | 13F | Park Avenue Securities Llc | 65.735 | 5,18 | 4 | 33,33 | ||||
| 2025-08-14 | 13F | Great Valley Advisor Group, Inc. | 3.317 | 224 | ||||||
| 2025-08-26 | NP | JSBSX - JPMorgan SmartRetirement Blend 2065 Fund Class I | 279.270 | 15,59 | 18.851 | 26,86 | ||||
| 2025-08-08 | 13F | Horizon Family Wealth, Inc. | 42.575 | -6,63 | 2.874 | 2,46 | ||||
| 2025-08-12 | 13F | Change Path, LLC | 33.502 | -3,97 | 2.261 | 5,41 | ||||
| 2025-08-14 | 13F | Susquehanna International Group, Llp | 5.294 | 20,43 | 357 | 32,22 | ||||
| 2025-07-17 | 13F | Emerald Advisors, LLC | 19.632 | -2,75 | 1.325 | 6,77 | ||||
| 2025-08-12 | 13F | LPL Financial LLC | 878.925 | 39,48 | 59.327 | 53,07 | ||||
| 2025-08-26 | NP | JRBEX - JPMorgan SmartRetirement* Blend 2030 Fund Class I | 6.223.501 | -6,78 | 420.086 | 2,31 | ||||
| 2025-08-08 | 13F | Emerald Investment Partners, Llc | 383 | 0,00 | 26 | 8,70 | ||||
| 2025-08-13 | 13F | Jones Financial Companies Lllp | 0 | -100,00 | 0 | |||||
| 2025-07-09 | 13F | Massmutual Trust Co Fsb/adv | 27.632 | -3,25 | 1.865 | 6,21 | ||||
| 2025-07-22 | 13F | Firethorn Wealth Partners, Llc | 7.769 | 10,20 | 524 | 21,02 | ||||
| 2025-08-01 | 13F | Envestnet Asset Management Inc | 566.391 | 11,00 | 38.231 | 21,82 | ||||
| 2025-08-14 | 13F | Comerica Bank | 1.695 | -4,18 | 114 | 5,56 | ||||
| 2025-08-14 | 13F | Graney & King, LLC | 74.682 | 8,41 | 5.041 | 18,98 | ||||
| 2025-08-08 | 13F | Cetera Investment Advisers | 388.804 | 27,24 | 26.244 | 39,65 | ||||
| 2025-08-13 | 13F | EverSource Wealth Advisors, LLC | 284 | 1,43 | 19 | 11,76 | ||||
| 2025-07-25 | 13F | Cwm, Llc | 121.602 | 131,83 | 8 | 166,67 | ||||
| 2025-08-12 | 13F | SRS Capital Advisors, Inc. | 830 | 56 | ||||||
| 2025-08-04 | 13F | WNY Asset Management, LLC | 174.476 | 16,47 | 11.777 | 27,83 | ||||
| 2025-06-30 | NP | PFSEX - RiskPro® 30+ Fund Class R | 340.751 | 438,84 | 21.747 | 475,14 | ||||
| 2025-07-16 | 13F | ORG Partners LLC | 23.969 | 1.616 | ||||||
| 2025-08-11 | 13F | Brass Tax Wealth Management, Inc | 18.868 | -9,07 | 1.274 | -0,24 | ||||
| 2025-04-23 | 13F | Mascagni Wealth Management, Inc. | 0 | -100,00 | 0 | -100,00 | ||||
| 2025-05-13 | 13F | UBS Group AG | 0 | -100,00 | 0 | |||||
| 2025-05-09 | 13F | Cary Street Partners Financial Llc | 0 | -100,00 | 0 | |||||
| 2025-09-04 | 13F/A | Advisor Group Holdings, Inc. | 490.251 | 5,08 | 32.806 | 14,32 | ||||
| 2025-08-11 | 13F | Rothschild Investment Llc | 179.232 | 7,50 | 12.098 | 17,98 | ||||
| 2025-08-19 | 13F | Advisory Services Network, LLC | 186.919 | 1.451,32 | 12.355 | 1.567,34 | ||||
| 2025-08-26 | NP | JACSX - JPMorgan SmartRetirement Blend 2060 Fund Class I | 2.448.881 | 0,29 | 165.299 | 10,07 | ||||
| 2025-05-14 | 13F | CIBC Private Wealth Group, LLC | 0 | -100,00 | 0 | |||||
| 2025-08-14 | 13F | Mml Investors Services, Llc | 117.234 | 10,63 | 8 | 16,67 | ||||
| 2025-08-06 | 13F | Golden State Wealth Management, LLC | 0 | -100,00 | 0 | -100,00 | ||||
| 2025-07-11 | 13F | Farther Finance Advisors, LLC | 9.375 | -4,02 | 633 | 5,16 | ||||
| 2025-08-13 | 13F | Hsbc Holdings Plc | 44.430 | 76,95 | 2.999 | 94,24 | ||||
| 2025-07-09 | 13F | Pallas Capital Advisors LLC | 408.701 | 34,73 | 27.587 | 47,86 | ||||
| 2025-07-10 | 13F | Wealth Enhancement Advisory Services, Llc | 12.951 | -3,22 | 876 | 6,32 | ||||
| 2025-07-30 | 13F | Insight Advisors, LLC/ PA | 14.735 | -3,94 | 995 | 5,41 | ||||
| 2025-08-26 | NP | JNEAX - JPMorgan SmartRetirement* Blend 2050 Fund Class I | 7.082.548 | -3,19 | 478.072 | 6,25 | ||||
| 2025-08-06 | 13F | Vestmark Advisory Solutions, Inc. | 1.766.430 | 113,11 | 119.234 | 133,89 | ||||
| 2025-07-25 | 13F | Richardson Financial Services Inc. | 4.265 | 41,74 | 288 | 55,14 | ||||
| 2025-05-28 | NP | JSSRX - JPMorgan SmartRetirement* Blend 2020 Fund Class I | 1.408.461 | -7,73 | 86.627 | -0,61 | ||||
| 2025-07-10 | 13F | Family Legacy Financial Solutions, LLC | 71 | 5 | ||||||
| 2025-08-08 | 13F | Capital Investment Advisory Services, LLC | 1.752 | 9,84 | 118 | 20,41 | ||||
| 2025-08-26 | NP | JOBEX - JPMorgan SmartRetirement* Blend 2040 Fund Class I | 8.668.645 | -5,62 | 585.134 | 3,58 | ||||
| 2025-07-15 | 13F | GSB Wealth Management, LLC | 7.650 | 0,00 | 516 | 9,79 | ||||
| 2025-08-14 | 13F | Stonehaven Wealth & Tax Solutions, Llc | 155.434 | -0,56 | 10.492 | 9,12 | ||||
| 2025-08-14 | 13F | Raymond James Financial Inc | 29.066 | 101,32 | 1.962 | 120,83 | ||||
| 2025-07-17 | 13F | Halbert Hargrove Global Advisors, Llc | 6 | 0,00 | 0 | |||||
| 2025-07-24 | 13F | IFP Advisors, Inc | 11.427 | 36,46 | 771 | 49,71 | ||||
| 2025-07-30 | 13F | Whittier Trust Co Of Nevada Inc | 3.693 | -18,85 | 249 | -10,75 | ||||
| 2025-08-06 | NP | LINCOLN VARIABLE INSURANCE PRODUCTS TRUST - LVIP JPMorgan Retirement Income Fund Standard Class | 64.594 | -9,66 | 4.360 | -0,84 | ||||
| 2025-08-05 | 13F | Strategic Financial Concepts, LLC | 3.108 | -75,50 | 210 | -73,21 | ||||
| 2025-07-31 | 13F | Cambridge Investment Research Advisors, Inc. | 117.693 | 18,47 | 8 | 16,67 | ||||
| 2025-08-14 | 13F | Goldman Sachs Group Inc | 0 | -100,00 | 0 | |||||
| 2025-06-30 | NP | PFJDX - RiskPro® Dynamic 20-30 Fund Class R | 51.912 | 47,58 | 3.313 | 57,54 | ||||
| 2025-07-15 | 13F | Kelly Financial Group Llc | 504.471 | 7,99 | 34.052 | 18,51 | ||||
| 2025-08-06 | 13F | Commonwealth Equity Services, Llc | 23.070 | 32,22 | 2 | 0,00 | ||||
| 2025-08-14 | 13F | Citadel Advisors Llc | Put | 0 | -100,00 | 0 | ||||
| 2025-08-07 | 13F | Nwam Llc | 5.079 | -1,53 | 339 | 6,94 | ||||
| 2025-05-13 | 13F | Northern Trust Corp | 0 | -100,00 | 0 | |||||
| 2025-08-07 | 13F | Allworth Financial LP | 266 | 0,00 | 18 | 6,25 | ||||
| 2025-07-29 | 13F | Private Trust Co Na | 2.422 | 30,43 | 163 | 42,98 | ||||
| 2025-07-14 | 13F | Cobblestone Asset Management LLC | 11.659 | 23,78 | 787 | 35,75 | ||||
| 2025-08-14 | 13F | Colony Group, LLC | 181.177 | -16,44 | 12.229 | -8,30 | ||||
| 2025-08-29 | 13F | Total Investment Management Inc | 19 | 1 | ||||||
| 2025-05-09 | 13F | NewEdge Wealth, LLC | 0 | -100,00 | 0 | |||||
| 2025-08-12 | 13F | Jacobi Capital Management LLC | 89.738 | 17,64 | 6.057 | 29,12 | ||||
| 2025-04-21 | 13F | Envestnet Portfolio Solutions, Inc. | 0 | -100,00 | 0 | |||||
| 2025-08-14 | 13F | Citadel Advisors Llc | 136.061 | 2.686,42 | 9.184 | 2.961,33 | ||||
| 2025-07-25 | 13F | Concord Wealth Partners | 0 | -100,00 | 0 | |||||
| 2025-08-14 | 13F | GWM Advisors LLC | 217 | 30,72 | 15 | 40,00 | ||||
| 2025-08-04 | 13F | Daymark Wealth Partners, Llc | 370.316 | 11,71 | 24.996 | 22,60 | ||||
| 2025-04-09 | 13F | HBW Advisory Services LLC | 0 | -100,00 | 0 |
Other Listings
| MX:BBIN |