Grundlæggende statistik
| Institutionelle ejere | 87 total, 87 long only, 0 short only, 0 long/short - change of 19,18% MRQ |
| Gennemsnitlig porteføljeallokering | 0.0250 % - change of 140,09% MRQ |
| Institutionelle aktier (lange) | 951.536 (ex 13D/G) - change of -0,08MM shares -7,79% MRQ |
| Institutionel værdi (lang) | $ 18.874 USD ($1000) |
Institutionelt ejerskab og aktionærer
ARK ETF Trust - ARK Space Exploration & Innovation ETF (US:ARKX) har 87 institutionelle ejere og aktionærer, der har indsendt 13D/G- eller 13F-formularer til Securities Exchange Commission (SEC). Disse institutioner har i alt 951,536 aktier. Største aktionærer omfatter LPL Financial LLC, UBS Group AG, Canal Insurance CO, Citadel Advisors Llc, Susquehanna International Group, Llp, Advisor Group Holdings, Inc., PFG Investments, LLC, Raymond James Financial Inc, Brookstone Capital Management, and Jpmorgan Chase & Co .
ARK ETF Trust - ARK Space Exploration & Innovation ETF (BATS:ARKX) institutionel ejerskabsstruktur viser aktuelle positioner i virksomheden efter institutioner og fonde, samt seneste ændringer i positionsstørrelse. Større aktionærer kan omfatte individuelle investorer, investeringsforeninger, hedgefonde eller institutioner. Skema 13D angiver, at investoren besidder (eller besidder) mere end 5 % af virksomheden og har til hensigt (eller har til hensigt at) aktivt at forfølge en ændring i forretningsstrategi. Skema 13G indikerer en passiv investering på over 5%.
The share price as of September 15, 2025 is 26,69 / share. Previously, on September 16, 2024, the share price was 15,22 / share. This represents an increase of 75,36% over that period.

Fondens stemningsscore
Fund Sentiment Score (fka Ownership Accumulation Score) finder de aktier, der bliver mest købt af fonde. Det er resultatet af en sofistikeret, multi-faktor kvantitativ model, der identificerer virksomheder med de højeste niveauer af institutionel akkumulering. Scoringsmodellen bruger en kombination af den samlede stigning i oplyste ejere, ændringerne i porteføljeallokeringer i disse ejere og andre målinger. Tallet går fra 0 til 100, hvor højere tal indikerer et højere niveau af akkumulering for sine jævnaldrende, og 50 er gennemsnittet.
Opdateringsfrekvens: Dagligt
Se Ownership Explorer, som giver en liste over højest rangerende virksomheder.
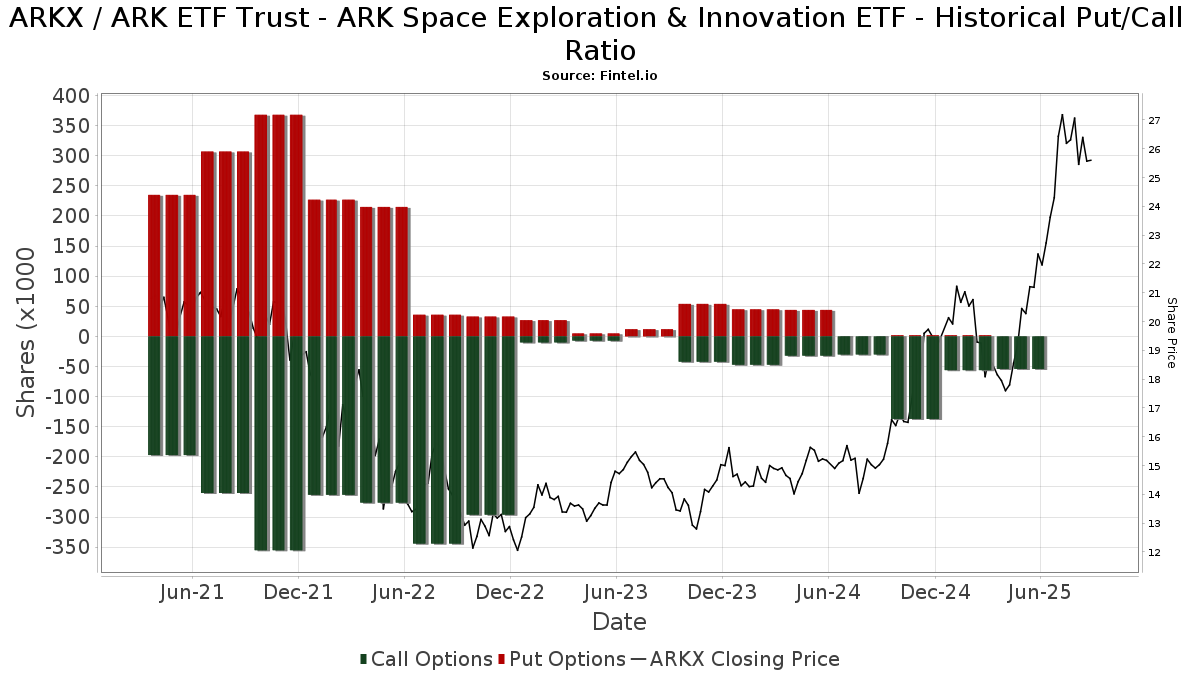
Institutionel Put/Call-forhold
Ud over at indberette standardaktie- og gældsudstedelser skal institutter med mere end 100 mill. aktiver under forvaltning også oplyse deres put- og call-optionsbeholdninger. Da salgsoptioner generelt indikerer negativ stemning, og købsoptioner indikerer positiv stemning, kan vi få en fornemmelse af den overordnede institutionelle stemning ved at plotte forholdet mellem put og kald. Diagrammet til højre viser det historiske put/call-forhold for dette instrument.
Brug af Put/Call Ratio som en indikator for investorernes stemning overvinder en af de vigtigste mangler ved at bruge totalt institutionelt ejerskab, som er, at en betydelig mængde af aktiver under forvaltning investeres passivt for at spore indekser. Passivt forvaltede fonde køber typisk ikke optioner, så indikatoren for put/call-forholdet følger mere nøje følelsen af aktivt forvaltede fonde.
13F og NPORT arkivering
Detaljer om 13F-arkivering er gratis. Detaljer om NP-ansøgninger kræver et premium-medlemskab. Grønne rækker angiver nye positioner. Røde rækker angiver lukkede positioner. Klik på linket ikon for at se den fulde transaktionshistorik.
Opgrader
for at låse premium-data op og eksportere til Excel ![]() .
.
| Fil dato | Kilde | Investor | Type | Gennemsnitlig pris (Øst) |
Aktier | Δ Aktier (%) |
Rapporteret Værdi ($1000) |
Δ Værdi (%) |
Port Alloc (%) |
|
|---|---|---|---|---|---|---|---|---|---|---|
| 2025-08-12 | 13F | Fairscale Capital, LLC | 50 | 0,00 | 1 | |||||
| 2025-07-17 | 13F | Independence Bank of Kentucky | 100 | 0,00 | 2 | 100,00 | ||||
| 2025-09-04 | 13F/A | Advisor Group Holdings, Inc. | 33.089 | -2,67 | 799 | 32,50 | ||||
| 2025-07-31 | 13F | Cambridge Investment Research Advisors, Inc. | 10.572 | -3,92 | 0 | |||||
| 2025-08-12 | 13F | LPL Financial LLC | 197.974 | 11,91 | 4.783 | 52,42 | ||||
| 2025-07-01 | 13F | Harbor Investment Advisory, Llc | 500 | 0,00 | 12 | 50,00 | ||||
| 2025-08-05 | 13F | GPS Wealth Strategies Group, LLC | 2.074 | 31,77 | 50 | 85,19 | ||||
| 2025-07-15 | 13F | Financial Management Professionals, Inc. | 2.500 | 0,00 | 60 | 36,36 | ||||
| 2025-07-28 | 13F | Private Wealth Asset Management, LLC | 480 | 0,00 | 12 | 37,50 | ||||
| 2025-08-13 | 13F/A | StoneX Group Inc. | 15.097 | -0,11 | 187 | -7,92 | ||||
| 2025-08-12 | 13F | Steward Partners Investment Advisory, Llc | 870 | 0,00 | 21 | 40,00 | ||||
| 2025-08-14 | 13F | Jane Street Group, Llc | Call | 12.800 | -45,99 | 309 | -26,43 | |||
| 2025-07-28 | 13F | Copia Wealth Management | 20 | 0,00 | 0 | |||||
| 2025-07-21 | 13F | Quent Capital, LLC | 0 | -100,00 | 0 | |||||
| 2025-08-11 | 13F | Covestor Ltd | 7 | 0 | ||||||
| 2025-04-24 | 13F | Decker Retirement Planning Inc. | 0 | -100,00 | 0 | |||||
| 2025-08-12 | 13F | PSI Advisors, LLC | 0 | -100,00 | 0 | |||||
| 2025-08-14 | 13F | Citadel Advisors Llc | 45.119 | -19,98 | 1.090 | 9,00 | ||||
| 2025-07-30 | 13F | Pittenger & Anderson Inc | 218 | 0,00 | 5 | 66,67 | ||||
| 2025-08-13 | 13F | Walleye Capital LLC | 20.809 | 503 | ||||||
| 2025-07-22 | 13F | Simplicity Wealth,LLC | 8.571 | 207 | ||||||
| 2025-08-14 | 13F | Susquehanna International Group, Llp | 0 | -100,00 | 0 | |||||
| 2025-04-21 | 13F | ORG Partners LLC | 0 | -100,00 | 0 | |||||
| 2025-08-06 | 13F | Stone House Investment Management, LLC | 100 | 2 | ||||||
| 2025-08-14 | 13F | Wells Fargo & Company/mn | 0 | -100,00 | 0 | |||||
| 2025-05-16 | 13F | Coppell Advisory Solutions LLC | 0 | -100,00 | 0 | |||||
| 2025-08-14 | 13F | Murphy & Mullick Capital Management Corp | 50 | 0,00 | 1 | |||||
| 2025-08-14 | 13F | Qube Research & Technologies Ltd | 869 | -31,79 | 21 | -9,09 | ||||
| 2025-07-09 | 13F | Massmutual Trust Co Fsb/adv | 900 | 22 | ||||||
| 2025-08-18 | 13F/A | National Bank Of Canada /fi/ | 440 | 11 | ||||||
| 2025-07-15 | 13F | Fifth Third Bancorp | 304 | 49,02 | 7 | 133,33 | ||||
| 2025-08-11 | 13F | Private Advisor Group, LLC | 11.246 | 272 | ||||||
| 2025-05-15 | 13F | Barclays Plc | 0 | -100,00 | 0 | |||||
| 2025-07-08 | 13F | Nbc Securities, Inc. | 3.595 | -57,97 | 0 | |||||
| 2025-05-05 | 13F | Lindbrook Capital, Llc | 200 | 0,00 | 4 | 0,00 | ||||
| 2025-07-11 | 13F | Farther Finance Advisors, LLC | 337 | 0,00 | 8 | 60,00 | ||||
| 2025-08-08 | 13F | Cetera Investment Advisers | 9.804 | -8,28 | 237 | 24,87 | ||||
| 2025-08-04 | 13F | Pensionmark Financial Group, Llc | 9.385 | 227 | ||||||
| 2025-04-25 | 13F | Smallwood Wealth Investment Management, LLC | 499 | 9 | ||||||
| 2025-08-14 | 13F | Bank Of America Corp /de/ | 17.252 | 393,48 | 417 | 570,97 | ||||
| 2025-08-14 | 13F | Mml Investors Services, Llc | 16.750 | 0 | ||||||
| 2025-08-14 | 13F | UBS Group AG | 91.998 | 2,42 | 2.223 | 39,49 | ||||
| 2025-08-06 | 13F | Commonwealth Equity Services, Llc | 21.454 | 72,32 | 1 | |||||
| 2025-08-14 | 13F | Barometer Capital Management Inc. | 12.100 | 292 | ||||||
| 2025-05-12 | 13F | Peapack Gladstone Financial Corp | 0 | -100,00 | 0 | |||||
| 2025-07-28 | 13F | Frazier Financial Advisors, LLC | 0 | -100,00 | 0 | |||||
| 2025-07-25 | 13F | Cwm, Llc | 17.356 | 1,91 | 0 | |||||
| 2025-07-29 | 13F | Activest Wealth Management | 64 | 0,00 | 2 | 0,00 | ||||
| 2025-08-12 | 13F | Archer Investment Corp | 74 | 0,00 | 2 | 0,00 | ||||
| 2025-08-11 | 13F | Principal Securities, Inc. | 1.963 | 50,19 | 47 | 88,00 | ||||
| 2025-08-13 | 13F | Transce3nd, LLC | 50 | 1 | ||||||
| 2025-08-15 | 13F | Morgan Stanley | 5.145 | -4,37 | 124 | 30,53 | ||||
| 2025-08-14 | 13F | Group One Trading, L.p. | 0 | -100,00 | 0 | |||||
| 2025-08-12 | 13F | Global Retirement Partners, LLC | 2.100 | 0,00 | 51 | 25,00 | ||||
| 2025-08-14 | 13F | GWM Advisors LLC | 4.437 | 1,14 | 107 | 38,96 | ||||
| 2025-08-04 | 13F | Assetmark, Inc | 5 | 0 | ||||||
| 2025-07-16 | 13F | Signaturefd, Llc | 260 | 13,04 | 6 | 50,00 | ||||
| 2025-05-14 | 13F | Peak6 Llc | Call | 0 | -100,00 | 0 | ||||
| 2025-09-02 | 13F | Pvg Asset Management Corp | 13.452 | 325 | ||||||
| 2025-07-08 | 13F | Gradient Investments LLC | 10.172 | -0,07 | 246 | 36,11 | ||||
| 2025-08-08 | 13F | New England Capital Financial Advisors LLC | 10 | 0,00 | 0 | |||||
| 2025-08-12 | 13F | Jaffetilchin Investment Partners, LLC | 8.290 | 200 | ||||||
| 2025-08-15 | 13F | Tower Research Capital LLC (TRC) | 415 | 10 | ||||||
| 2025-08-14 | 13F | AllSquare Wealth Management LLC | 183 | 0,00 | 4 | 33,33 | ||||
| 2025-08-14 | 13F | Sunbelt Securities, Inc. | 475 | -29,63 | 9 | -18,18 | ||||
| 2025-08-14 | 13F | Royal Bank Of Canada | 25.418 | 6,83 | 614 | 45,50 | ||||
| 2025-05-16 | 13F/A | Kestra Investment Management, LLC | 0 | -100,00 | 0 | |||||
| 2025-07-14 | 13F | Toth Financial Advisory Corp | 1.527 | 1.696,47 | 37 | 3.500,00 | ||||
| 2025-07-25 | 13F | PrairieView Partners, LLC | 479 | 0 | ||||||
| 2025-08-14 | 13F | Susquehanna International Group, Llp | Call | 42.000 | 41,41 | 1.015 | 92,78 | |||
| 2025-07-30 | 13F | Brookstone Capital Management | 26.204 | 1,26 | 633 | 37,91 | ||||
| 2025-08-14 | 13F | Jane Street Group, Llc | 0 | -100,00 | 0 | |||||
| 2025-08-01 | 13F | Envestnet Asset Management Inc | 25.032 | 7,86 | 605 | 46,96 | ||||
| 2025-07-28 | 13F | WJ Wealth Management, LLC | 18.337 | 443 | ||||||
| 2025-08-14 | 13F | Citadel Advisors Llc | Put | 0 | -100,00 | 0 | ||||
| 2025-08-07 | 13F | Kestra Private Wealth Services, Llc | 16.049 | 3,90 | 388 | 41,24 | ||||
| 2025-07-24 | 13F | Capital Advisors, Ltd. LLC | 300 | 0 | ||||||
| 2025-08-07 | 13F | Allworth Financial LP | 1.103 | 0,27 | 27 | 30,00 | ||||
| 2025-05-08 | 13F | Eastern Bank | 0 | -100,00 | 0 | |||||
| 2025-07-28 | 13F | Harbour Investments, Inc. | 1.245 | 0,00 | 30 | 36,36 | ||||
| 2025-08-13 | 13F | Consultiva Wealth Management, Corp. | 1.000 | 0,00 | 24 | 41,18 | ||||
| 2025-07-24 | 13F | Costello Asset Management, INC | 450 | 11 | ||||||
| 2025-07-14 | 13F | Painted Porch Advisors LLC | 0 | -100,00 | 0 | -100,00 | ||||
| 2025-08-05 | 13F | Simplex Trading, Llc | 10.078 | 50,73 | 0 | |||||
| 2025-08-05 | 13F | Bank Of Montreal /can/ | 425 | -70,77 | 10 | -60,00 | ||||
| 2025-08-06 | 13F | AE Wealth Management LLC | 712 | 0,00 | 17 | 41,67 | ||||
| 2025-08-08 | 13F | Creative Planning | 15.071 | 364 | ||||||
| 2025-08-14 | 13F | Federation des caisses Desjardins du Quebec | 0 | -100,00 | 0 | |||||
| 2025-08-08 | 13F | Pnc Financial Services Group, Inc. | 0 | -100,00 | 0 | |||||
| 2025-07-18 | 13F | PFG Investments, LLC | 31.506 | 0,00 | 761 | 36,38 | ||||
| 2025-08-11 | 13F | Blue Bell Private Wealth Management, Llc | 51 | 0,00 | 1 | |||||
| 2025-08-13 | 13F | Northwestern Mutual Wealth Management Co | 790 | 1.480,00 | 19 | |||||
| 2025-07-30 | 13F | Canal Insurance CO | 80.000 | 0,00 | 2 | 0,00 | ||||
| 2025-07-30 | 13F | Advantage Trust Co | 2.800 | 68 | ||||||
| 2025-08-12 | 13F | CIBC Private Wealth Group, LLC | 497 | 0,00 | 12 | 71,43 | ||||
| 2025-08-01 | 13F | Bessemer Group Inc | 49 | 0,00 | 0 | |||||
| 2025-08-14 | 13F | Citadel Advisors Llc | Call | 0 | -100,00 | 0 | ||||
| 2025-08-13 | 13F | SCS Capital Management LLC | 23.416 | 40,55 | 566 | 91,53 | ||||
| 2025-07-24 | 13F | IFP Advisors, Inc | 60 | 0,00 | 1 | 0,00 | ||||
| 2025-08-14 | 13F | Raymond James Financial Inc | 28.022 | 171,35 | 677 | 269,95 | ||||
| 2025-08-12 | 13F | Proequities, Inc. | 0 | 0 | ||||||
| 2025-07-21 | 13F | DHJJ Financial Advisors, Ltd. | 380 | 0,00 | 9 | 50,00 | ||||
| 2025-08-13 | 13F | Flow Traders U.s. Llc | 0 | -100,00 | 0 | |||||
| 2025-07-17 | 13F | Albion Financial Group /ut | 56 | 0,00 | 1 | |||||
| 2025-05-02 | 13F | Capital A Wealth Management, LLC | 3.299 | -28,85 | 59 | -35,56 | ||||
| 2025-08-04 | 13F | NBZ Investment Advisors LLC | 2.437 | 0,00 | 59 | 34,88 | ||||
| 2025-07-21 | 13F | Credential Qtrade Securities Inc. | 0 | -100,00 | 0 | |||||
| 2025-08-12 | 13F | Jpmorgan Chase & Co | 25.959 | -10,12 | 627 | 22,46 | ||||
| 2025-07-16 | 13F | Brown, Lisle/cummings, Inc. | 8.900 | 6,59 | 215 | 45,27 | ||||
| 2025-07-14 | 13F | AdvisorNet Financial, Inc | 100 | 2 |