Grundlæggende statistik
| Institutionelle ejere | 43 total, 38 long only, 0 short only, 5 long/short - change of 15,79% MRQ |
| Gennemsnitlig porteføljeallokering | 0.0073 % - change of -18,95% MRQ |
| Institutionelle aktier (lange) | 606.990 (ex 13D/G) - change of -0,41MM shares -40,36% MRQ |
| Institutionel værdi (lang) | $ 12.106 USD ($1000) |
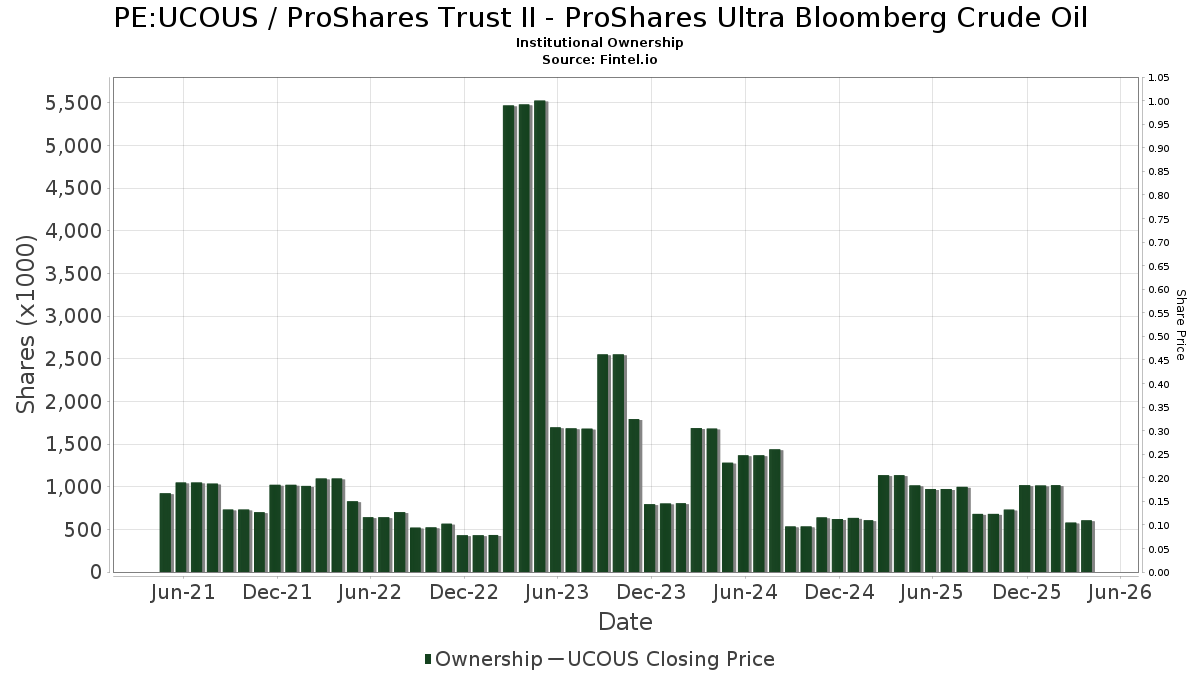
Institutionelt ejerskab og aktionærer
ProShares Trust II - ProShares Ultra Bloomberg Crude Oil (PE:UCOUS) har 43 institutionelle ejere og aktionærer, der har indsendt 13D/G- eller 13F-formularer til Securities Exchange Commission (SEC). Disse institutioner har i alt 606,990 aktier. Største aktionærer omfatter Susquehanna International Group, Llp, Susquehanna International Group, Llp, Citadel Advisors Llc, Jane Street Group, Llc, Jefferies Financial Group Inc., Citadel Advisors Llc, Wolverine Trading, Llc, Jefferies Financial Group Inc., Citadel Advisors Llc, and Baker Avenue Asset Management, LP .
ProShares Trust II - ProShares Ultra Bloomberg Crude Oil (BVL:UCOUS) institutionel ejerskabsstruktur viser aktuelle positioner i virksomheden efter institutioner og fonde, samt seneste ændringer i positionsstørrelse. Større aktionærer kan omfatte individuelle investorer, investeringsforeninger, hedgefonde eller institutioner. Skema 13D angiver, at investoren besidder (eller besidder) mere end 5 % af virksomheden og har til hensigt (eller har til hensigt at) aktivt at forfølge en ændring i forretningsstrategi. Skema 13G indikerer en passiv investering på over 5%.
Fondens stemningsscore
Fund Sentiment Score (fka Ownership Accumulation Score) finder de aktier, der bliver mest købt af fonde. Det er resultatet af en sofistikeret, multi-faktor kvantitativ model, der identificerer virksomheder med de højeste niveauer af institutionel akkumulering. Scoringsmodellen bruger en kombination af den samlede stigning i oplyste ejere, ændringerne i porteføljeallokeringer i disse ejere og andre målinger. Tallet går fra 0 til 100, hvor højere tal indikerer et højere niveau af akkumulering for sine jævnaldrende, og 50 er gennemsnittet.
Opdateringsfrekvens: Dagligt
Se Ownership Explorer, som giver en liste over højest rangerende virksomheder.
AI+ Ask Fintel’s AI assistant about ProShares Trust II - ProShares Ultra Bloomberg Crude Oil.
Select a question to share a public post with an AI-crafted answer.
Thinking of good questions…
13F og NPORT arkivering
Detaljer om 13F-arkivering er gratis. Detaljer om NP-ansøgninger kræver et premium-medlemskab. Grønne rækker angiver nye positioner. Røde rækker angiver lukkede positioner. Klik på linket ikon for at se den fulde transaktionshistorik.
Opgrader
for at låse premium-data op og eksportere til Excel ![]() .
.
| Fil dato | Kilde | Investor | Type | Gennemsnitlig pris (Øst) |
Aktier | Δ Aktier (%) |
Rapporteret Værdi ($1000) |
Δ Værdi (%) |
Port Alloc (%) |
|
|---|---|---|---|---|---|---|---|---|---|---|
| 2026-02-11 | 13F | Jpmorgan Chase & Co | 20.711 | 143,34 | 400 | 109,42 | ||||
| 2025-11-14 | 13F | Flow Traders U.s. Llc | 0 | -100,00 | 0 | |||||
| 2026-04-21 | 13F | WT Wealth Management | 7.341 | 289 | ||||||
| 2026-02-10 | 13F | Baker Avenue Asset Management, LP | 115.750 | 52,81 | 2.236 | 31,37 | ||||
| 2026-02-13 | 13F | National Bank Of Canada /fi/ | 108 | 2 | ||||||
| 2026-02-17 | 13F | Cape Investment Advisory, Inc. | 12 | 0 | ||||||
| 2025-11-14 | 13F | Wolverine Trading, Llc | Put | 92.000 | -2,13 | 2.108 | 0,33 | |||
| 2026-02-19 | 13F | Connective Capital Management, LLC | 0 | -100,00 | 0 | |||||
| 2025-11-14 | 13F | Wolverine Trading, Llc | Call | 130.900 | -30,45 | 2.999 | -28,72 | |||
| 2026-04-07 | 13F | Farther Finance Advisors, LLC | 640 | 0,00 | 24 | 91,67 | ||||
| 2026-02-12 | 13F | CIBC Private Wealth Group, LLC | 8 | 0,00 | 0 | |||||
| 2026-02-17 | 13F | Advisor Group Holdings, Inc. | 8 | 0,00 | 0 | |||||
| 2026-02-13 | 13F | Seneschal Advisors, LLC | 1.110 | 0,00 | 21 | -12,50 | ||||
| 2026-02-17 | 13F | Susquehanna International Group, Llp | 10.952 | -90,18 | 212 | -91,58 | ||||
| 2025-11-13 | 13F | Newbridge Financial Services Group, Inc. | 0 | 0 | ||||||
| 2026-02-13 | 13F | Morgan Stanley | 1.748 | -99,21 | 34 | -99,34 | ||||
| 2026-02-11 | 13F | Group One Trading, L.p. | Put | 0 | -100,00 | 0 | -100,00 | |||
| 2026-02-12 | 13F | Hrt Financial Lp | 0 | -100,00 | 0 | |||||
| 2026-02-17 | 13F | Susquehanna International Group, Llp | Put | 399.300 | -24,07 | 7.714 | -34,75 | |||
| 2026-02-10 | 13F/A | Northwestern Mutual Wealth Management Co | 16 | 0,00 | 0 | |||||
| 2026-02-17 | 13F | Susquehanna International Group, Llp | Call | 1.377.600 | 153,51 | 26.615 | 117,89 | |||
| 2026-02-17 | 13F | Boreal Capital Management LLC | 0 | -100,00 | 0 | |||||
| 2026-02-11 | 13F | Group One Trading, L.p. | Call | 0 | -100,00 | 0 | -100,00 | |||
| 2026-02-13 | 13F | Headlands Technologies LLC | 20.549 | 397 | ||||||
| 2026-02-17 | 13F | Tower Research Capital LLC (TRC) | 33 | -99,75 | 1 | -100,00 | ||||
| 2025-12-15 | 13F | FNY Investment Advisers, LLC | 0 | -100,00 | 0 | |||||
| 2026-02-09 | 13F | Jefferies Financial Group Inc. | Put | 135.000 | -2,60 | 2.608 | -16,28 | |||
| 2026-02-09 | 13F | Jefferies Financial Group Inc. | Call | 30.000 | -78,35 | 580 | -81,41 | |||
| 2026-02-09 | 13F | Jefferies Financial Group Inc. | 117.985 | 16.401,40 | 2.279 | 14.143,75 | ||||
| 2026-04-08 | 13F | Quantum Financial Advisors, LLC | 23.400 | 105,26 | 920 | 317,73 | ||||
| 2026-02-06 | 13F | Larson Financial Group LLC | 56 | 0,00 | 1 | 0,00 | ||||
| 2025-11-14 | 13F | Squarepoint Ops LLC | 0 | -100,00 | 0 | -100,00 | ||||
| 2026-02-11 | 13F | Group One Trading, L.p. | 13.272 | -63,01 | 256 | -68,24 | ||||
| 2026-03-04 | 13F | SHP Wealth Management | 1.238 | 24 | ||||||
| 2026-02-10 | 13F | Rothschild Investment Llc | 400 | 0,00 | 8 | -12,50 | ||||
| 2026-04-20 | 13F | Ronald Blue Trust, Inc. | 1.200 | 0,00 | 47 | 104,35 | ||||
| 2026-04-15 | 13F | FNY Investment Advisers, LLC | Call | 0 | -100,00 | 0 | ||||
| 2026-02-12 | 13F | Jane Street Group, Llc | Call | 228.400 | 43,20 | 4.413 | 23,07 | |||
| 2026-01-23 | 13F | Financial Connections Group, Inc. | 5 | 0,00 | 0 | |||||
| 2026-02-12 | 13F | Jane Street Group, Llc | Put | 108.500 | -49,56 | 2.096 | -56,65 | |||
| 2026-02-13 | 13F | Squarepoint Ops LLC | Call | 12.800 | 0,00 | 247 | -13,94 | |||
| 2026-02-19 | 13F | CI Private Wealth, LLC | 44.436 | 44 | ||||||
| 2026-04-28 | 13F | Quent Capital, LLC | 0 | -100,00 | 0 | |||||
| 2026-02-17 | 13F | Jump Financial, LLC | 47.221 | -5,69 | 912 | -18,93 | ||||
| 2026-01-30 | 13F | Rachor Investment Advisory Services, LLC | 368 | 7 | ||||||
| 2025-11-14 | 13F | Wolverine Trading, Llc | 0 | -100,00 | 0 | -100,00 | ||||
| 2026-01-26 | 13F | Main Street Group, LTD | 0 | -100,00 | 0 | |||||
| 2026-02-17 | 13F | Royal Bank Of Canada | 672 | -93,50 | 13 | -94,40 | ||||
| 2026-02-09 | 13F | Harbour Investments, Inc. | 440 | 0,00 | 9 | -11,11 | ||||
| 2026-04-24 | 13F | Root Financial Partners, LLC | 10 | 0,00 | 0 | |||||
| 2026-02-11 | 13F | Simplex Trading, Llc | 10.383 | 201 | ||||||
| 2026-02-17 | 13F | Citadel Advisors Llc | Put | 132.000 | -24,14 | 2.550 | -34,80 | |||
| 2026-01-07 | 13F | Corsicana & Co. | 2.000 | 0,00 | 39 | -13,64 | ||||
| 2026-02-17 | 13F | Citadel Advisors Llc | 117.830 | 2.276 | ||||||
| 2026-02-13 | 13F | Citigroup Inc | 300 | -86,64 | 6 | -90,00 | ||||
| 2026-02-17 | 13F | Citadel Advisors Llc | Call | 268.700 | 5,54 | 5.191 | -9,30 | |||
| 2026-01-21 | 13F | SJS Investment Consulting Inc. | 0 | -100,00 | 0 | |||||
| 2026-02-06 | 13F | Global Retirement Partners, LLC | 60 | 0,00 | 1 | 0,00 | ||||
| 2026-02-12 | 13F | Jane Street Group, Llc | 0 | -100,00 | 0 | -100,00 | ||||
| 2025-11-14 | 13F | Luminist Capital LLC | 0 | -100,00 | 0 | |||||
| 2026-04-22 | 13F | Spire Wealth Management | 17.902 | -4,79 | 704 | 93,66 | ||||
| 2026-01-29 | 13F | UBS Group AG | 1.389 | 27 | ||||||
| 2026-01-29 | 13F | IMC-Chicago, LLC | Put | 0 | -100,00 | 0 | ||||
| 2026-01-29 | 13F | IMC-Chicago, LLC | Call | 0 | -100,00 | 0 | ||||
| 2025-11-14 | 13F | Nbc Securities, Inc. | 0 | -100,00 | 0 | |||||
| 2026-04-07 | 13F | Signaturefd, Llc | 1.760 | 0,00 | 69 | 102,94 | ||||
| 2026-02-23 | 13F | Wealth Preservation Advisors, LLC | 57 | 0,00 | 1 | 0,00 | ||||
| 2026-02-17 | 13F | Quadrature Capital Ltd | 17.264 | 334 | ||||||
| 2026-04-24 | 13F | Means Investment Co., Inc. | 8.241 | 324 | ||||||
| 2025-11-14 | 13F | Two Sigma Securities, Llc | 0 | -100,00 | 0 | |||||
| 2026-04-28 | 13F | Golden State Wealth Management, LLC | 115 | 5 | ||||||
| 2025-11-10 | 13F | X-Square Capital, LLC | 0 | -100,00 | 0 |
Other Listings
| US:UCO | 47,90 $ |