Grundlæggende statistik
| Institutionelle ejere | 71 total, 67 long only, 0 short only, 4 long/short - change of -5,86% MRQ |
| Gennemsnitlig porteføljeallokering | 0.2774 % - change of -14,56% MRQ |
| Institutionelle aktier (lange) | 10.609.030 (ex 13D/G) - change of -0,97MM shares -1,80% MRQ |
| Institutionel værdi (lang) | $ 21.860 USD ($1000) |
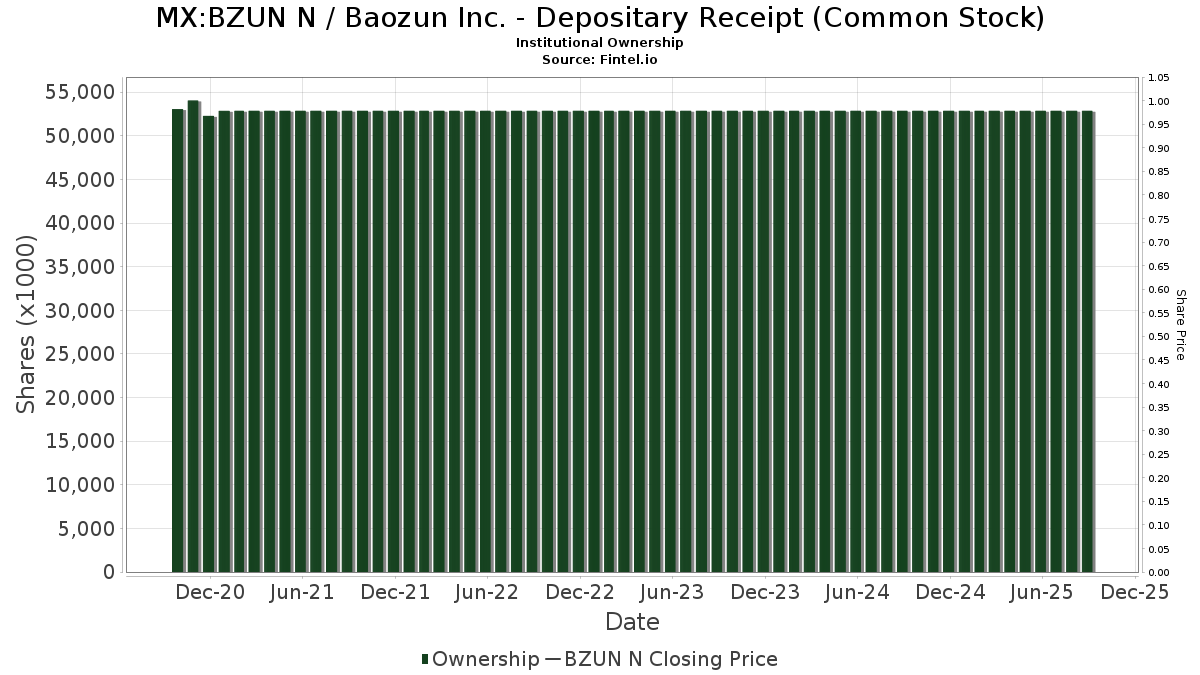
Institutionelt ejerskab og aktionærer
Baozun Inc. - Depositary Receipt (Common Stock) (MX:BZUN N) har 71 institutionelle ejere og aktionærer, der har indsendt 13D/G- eller 13F-formularer til Securities Exchange Commission (SEC). Disse institutioner har i alt 10,609,030 aktier. Største aktionærer omfatter Schroder Investment Management Group, Acadian Asset Management Llc, Two Sigma Advisers, Lp, Morgan Stanley, Dimensional Fund Advisors Lp, Arrowstreet Capital, Limited Partnership, Susquehanna International Group, Llp, AIA Group Ltd, Marshall Wace, Llp, and Susquehanna International Group, Llp .
Baozun Inc. - Depositary Receipt (Common Stock) (BMV:BZUN N) institutionel ejerskabsstruktur viser aktuelle positioner i virksomheden efter institutioner og fonde, samt seneste ændringer i positionsstørrelse. Større aktionærer kan omfatte individuelle investorer, investeringsforeninger, hedgefonde eller institutioner. Skema 13D angiver, at investoren besidder (eller besidder) mere end 5 % af virksomheden og har til hensigt (eller har til hensigt at) aktivt at forfølge en ændring i forretningsstrategi. Skema 13G indikerer en passiv investering på over 5%.
Fondens stemningsscore
Fund Sentiment Score (fka Ownership Accumulation Score) finder de aktier, der bliver mest købt af fonde. Det er resultatet af en sofistikeret, multi-faktor kvantitativ model, der identificerer virksomheder med de højeste niveauer af institutionel akkumulering. Scoringsmodellen bruger en kombination af den samlede stigning i oplyste ejere, ændringerne i porteføljeallokeringer i disse ejere og andre målinger. Tallet går fra 0 til 100, hvor højere tal indikerer et højere niveau af akkumulering for sine jævnaldrende, og 50 er gennemsnittet.
Opdateringsfrekvens: Dagligt
Se Ownership Explorer, som giver en liste over højest rangerende virksomheder.
AI+ Ask Fintel’s AI assistant about Baozun Inc. - Depositary Receipt (Common Stock).
Select a question to share a public post with an AI-crafted answer.
Thinking of good questions…
13F og NPORT arkivering
Detaljer om 13F-arkivering er gratis. Detaljer om NP-ansøgninger kræver et premium-medlemskab. Grønne rækker angiver nye positioner. Røde rækker angiver lukkede positioner. Klik på linket ikon for at se den fulde transaktionshistorik.
Opgrader
for at låse premium-data op og eksportere til Excel ![]() .
.
| Fil dato | Kilde | Investor | Type | Gennemsnitlig pris (Øst) |
Aktier | Δ Aktier (%) |
Rapporteret Værdi ($1000) |
Δ Værdi (%) |
Port Alloc (%) |
|
|---|---|---|---|---|---|---|---|---|---|---|
| 2026-04-15 | 13F | Compagnie Lombard Odier SCmA | 200 | 0,00 | 0 | |||||
| 2026-02-06 | 13F | Vestmark Advisory Solutions, Inc. | 12.024 | 32 | ||||||
| 2026-02-11 | 13F | Group One Trading, L.p. | Call | 152.100 | 10,70 | 405 | -27,34 | |||
| 2026-02-11 | 13F | Group One Trading, L.p. | Put | 176.300 | -15,20 | 469 | -44,35 | |||
| 2026-02-11 | 13F | Group One Trading, L.p. | 13.413 | -66,27 | 36 | -78,26 | ||||
| 2026-02-06 | 13F | Gsa Capital Partners Llp | 235.713 | 14,61 | 1 | |||||
| 2026-02-13 | 13F | Barclays Plc | 0 | -100,00 | 0 | |||||
| 2026-02-17 | 13F | Jump Financial, LLC | 59.325 | 158 | ||||||
| 2026-02-12 | 13F | Marex Group plc | 130.774 | 24,90 | 348 | -18,16 | ||||
| 2026-02-10 | 13F | Commonwealth Of Pennsylvania Public School Empls Retrmt Sys | 92.523 | 0,00 | 246 | -34,22 | ||||
| 2026-02-17 | 13F | Russell Investments Group, Ltd. | 28.760 | 81,42 | 75 | 17,19 | ||||
| 2026-04-27 | 13F | Qrg Capital Management, Inc. | 10.990 | -9,19 | 26 | -18,75 | ||||
| 2026-02-17 | 13F | Millennium Management Llc | 144.052 | 579,91 | 383 | 350,59 | ||||
| 2026-02-06 | 13F | Nano Cap New Millennium Growth Fund L P | 50.000 | 133 | ||||||
| 2026-02-11 | 13F | LPL Financial LLC | 0 | -100,00 | 0 | |||||
| 2026-02-13 | 13F | Wells Fargo & Company/mn | 725 | -7,64 | 2 | -66,67 | ||||
| 2026-02-17 | 13F | Jones Financial Companies Lllp | 0 | -100,00 | 0 | |||||
| 2026-02-17 | 13F | Cetera Investment Advisers | 30.949 | -13,89 | 82 | -43,45 | ||||
| 2026-01-16 | 13F | Ronald Blue Trust, Inc. | 0 | -100,00 | 0 | |||||
| 2026-02-11 | 13F | IMA Wealth, Inc. | 77 | 0 | ||||||
| 2026-04-03 | 13F | Adirondack Trust Co | 75 | 0,00 | 0 | |||||
| 2026-02-17 | 13F | Citadel Advisors Llc | 96.243 | 8,77 | 256 | -28,49 | ||||
| 2026-02-19 | 13F | Invesco Ltd. | 33.620 | -6,63 | 89 | -38,62 | ||||
| 2025-11-07 | 13F | Pnc Financial Services Group, Inc. | 0 | -100,00 | 0 | -100,00 | ||||
| 2026-02-12 | 13F | New York State Common Retirement Fund | 23.914 | 0,00 | 64 | -34,37 | ||||
| 2026-02-17 | 13F | Citadel Advisors Llc | Put | 34.800 | 58,18 | 93 | 3,37 | |||
| 2026-01-28 | 13F | N.E.W. Advisory Services LLC | 800 | 0,00 | 2 | -33,33 | ||||
| 2026-02-13 | 13F | Rhumbline Advisers | 3.324 | -7,62 | 9 | -42,86 | ||||
| 2026-02-11 | 13F | Jpmorgan Chase & Co | 183.256 | -18,08 | 487 | -46,25 | ||||
| 2025-11-19 | 13F | Caitong International Asset Management Co., Ltd | 0 | -100,00 | 0 | |||||
| 2026-02-06 | 13F | IFP Advisors, Inc | 0 | -100,00 | 0 | |||||
| 2025-11-14 | 13F | Wolverine Trading, Llc | Call | 16.300 | -7,91 | 66 | 47,73 | |||
| 2026-02-14 | 13F | Rockefeller Capital Management L.P. | 50 | 0,00 | 0 | |||||
| 2026-02-13 | 13F | Schroder Investment Management Group | 2.414.558 | 4,91 | 6.423 | -30,93 | ||||
| 2026-02-10 | 13F | Eurizon Capital SGR S.p.A. | 45 | 0 | ||||||
| 2026-02-17 | 13F | Two Sigma Investments, Lp | 106.579 | 284 | ||||||
| 2026-02-12 | 13F | Jane Street Group, Llc | 54.423 | 226,51 | 145 | 114,93 | ||||
| 2026-02-03 | 13F | SBI Securities Co., Ltd. | 257 | 0,00 | 1 | -100,00 | ||||
| 2026-02-04 | 13F | Mascoma Wealth Management LLC | 0 | -100,00 | 0 | |||||
| 2026-02-09 | 13F | AIA Group Ltd | 399.018 | 0,00 | 1.061 | -34,34 | ||||
| 2026-02-13 | 13F | Arrowstreet Capital, Limited Partnership | 451.293 | -4,03 | 1.200 | -36,97 | ||||
| 2026-02-10 | 13F | Bnp Paribas Arbitrage, Sa | 41.767 | 102,34 | 111 | 33,73 | ||||
| 2026-01-29 | 13F | UBS Group AG | 218.537 | 16,95 | 581 | -23,15 | ||||
| 2025-11-14 | 13F | Wolverine Trading, Llc | Put | 0 | -100,00 | 0 | -100,00 | |||
| 2026-01-20 | 13F | Signaturefd, Llc | 0 | -100,00 | 0 | |||||
| 2026-02-17 | 13F | D. E. Shaw & Co., Inc. | 136.756 | -6,22 | 364 | -38,47 | ||||
| 2026-02-17 | 13F/A | RBF Capital, LLC | 20.000 | -58,25 | 53 | -72,54 | ||||
| 2026-02-12 | 13F | SWAN Capital LLC | 47 | 0,00 | 0 | |||||
| 2026-04-23 | 13F | Harbor Investment Advisory, Llc | 4 | 0,00 | 0 | |||||
| 2026-02-17 | 13F | Royal Bank Of Canada | 192 | 1 | ||||||
| 2025-11-14 | 13F | Raymond James Financial Inc | 0 | -100,00 | 0 | |||||
| 2026-02-17 | 13F | Two Sigma Securities, Llc | 11.422 | -36,86 | 30 | -58,90 | ||||
| 2026-02-10 | 13F/A | Northwestern Mutual Wealth Management Co | 1 | 0,00 | 0 | |||||
| 2026-02-18 | 13F | GWM Advisors LLC | 1.231 | 0,00 | 3 | -25,00 | ||||
| 2026-02-13 | 13F | Morgan Stanley | 582.849 | -16,78 | 1.550 | -45,35 | ||||
| 2026-01-26 | 13F | Cwm, Llc | 350 | 0 | ||||||
| 2026-02-11 | 13F | Simplex Trading, Llc | 3.764 | -73,01 | 10 | |||||
| 2026-02-11 | 13F | Simplex Trading, Llc | Call | 55.100 | 4.138,46 | 147 | ||||
| 2026-02-11 | 13F | Simplex Trading, Llc | Put | 87.200 | 9.588,89 | 232 | ||||
| 2026-02-17 | 13F | Susquehanna International Group, Llp | Call | 0 | -100,00 | 0 | ||||
| 2026-02-10 | 13F | Acadian Asset Management Llc | 2.114.964 | -0,78 | 6 | -37,50 | ||||
| 2026-02-13 | 13F | Centiva Capital, LP | 0 | -100,00 | 0 | |||||
| 2026-02-17 | 13F | Citadel Advisors Llc | Call | 0 | -100,00 | 0 | ||||
| 2026-04-27 | 13F | PFG Investments, LLC | 10.200 | 0,00 | 24 | -11,11 | ||||
| 2026-02-17 | 13F | XTX Topco Ltd | 82.363 | 219 | ||||||
| 2026-02-12 | 13F | Renaissance Technologies Llc | 230.244 | 18,06 | 612 | -22,43 | ||||
| 2026-02-09 | 13F | Geode Capital Management, Llc | 32.067 | 0,00 | 85 | -34,11 | ||||
| 2026-02-13 | 13F | Walleye Capital LLC | 151.151 | -4,66 | 402 | -37,38 | ||||
| 2026-02-13 | 13F | State Street Corp | 43.148 | 4,71 | 115 | -31,33 | ||||
| 2026-02-17 | 13F | Quadrature Capital Ltd | 19.262 | 51 | ||||||
| 2026-02-12 | 13F | Federation des caisses Desjardins du Quebec | 200 | 0,00 | 1 | |||||
| 2026-02-13 | 13F | Citigroup Inc | 61 | -46,96 | 0 | |||||
| 2026-02-17 | 13F | Susquehanna International Group, Llp | Put | 403.200 | 0,05 | 1.073 | -34,31 | |||
| 2026-02-17 | 13F | Susquehanna International Group, Llp | 237.269 | 416,63 | 631 | 239,25 | ||||
| 2026-02-10 | 13F | Goldman Sachs Group Inc | 90.458 | -63,76 | 241 | -76,24 | ||||
| 2025-11-14 | 13F | Cubist Systematic Strategies, LLC | 59.838 | 36,01 | 242 | 122,02 | ||||
| 2026-02-12 | 13F | Dimensional Fund Advisors Lp | 575.602 | -4,55 | 1.530 | -37,32 | ||||
| 2026-02-06 | 13F | EverSource Wealth Advisors, LLC | 108 | 0 | ||||||
| 2026-02-17 | 13F | Advisor Group Holdings, Inc. | 950 | 40,74 | 3 | 0,00 | ||||
| 2026-02-12 | 13F | Groupe la Francaise | 0 | -100,00 | 0 | |||||
| 2026-02-13 | 13F | Marshall Wace, Llp | 346.764 | 922 | ||||||
| 2026-02-17 | 13F | Point72 Asset Management, L.P. | 23.390 | 62 | ||||||
| 2026-02-18 | 13F | Mackenzie Financial Corp | 0 | -100,00 | 0 | |||||
| 2026-02-13 | 13F | Walleye Trading LLC | Put | 0 | -100,00 | 0 | ||||
| 2026-04-23 | 13F | North Star Investment Management Corp. | 2.900 | 0,00 | 7 | -14,29 | ||||
| 2026-02-13 | 13F | Walleye Trading LLC | Call | 0 | -100,00 | 0 | ||||
| 2026-02-17 | 13F | Bank Of America Corp /de/ | 112.830 | -9,85 | 300 | -40,71 | ||||
| 2026-04-15 | 13F | Polunin Capital Partners Ltd | 60.222 | 0,00 | 0 | |||||
| 2026-02-13 | 13F | Walleye Trading LLC | 0 | -100,00 | 0 | |||||
| 2026-02-12 | 13F | BlackRock, Inc. | 827 | 0,00 | 2 | -33,33 | ||||
| 2025-11-13 | 13F | Total Investment Management Inc | 0 | -100,00 | 0 | |||||
| 2026-04-27 | 13F | Leonteq Securities AG | 1.008 | 0,00 | 2 | 0,00 | ||||
| 2026-02-13 | 13F | National Bank Of Canada /fi/ | 275 | 0,00 | 1 | -100,00 | ||||
| 2026-02-13 | 13F | Headlands Technologies LLC | 24.920 | 8,91 | 66 | -28,26 | ||||
| 2026-02-17 | 13F | Two Sigma Advisers, Lp | 614.522 | -0,18 | 1.635 | -34,46 | ||||
| 2026-02-17 | 13F | Tower Research Capital LLC (TRC) | 3.683 | -7,95 | 10 | -43,75 | ||||
| 2025-11-12 | 13F/A | Norges Bank | 0 | -100,00 | 0 | -100,00 | ||||
| 2026-01-26 | 13F | Main Street Group, LTD | 0 | -100,00 | 0 | |||||
| 2026-02-17 | 13F | Qube Research & Technologies Ltd | 175.904 | 12,58 | 468 | -26,11 |