Grundlæggende statistik
| Institutionelle ejere | 91 total, 91 long only, 0 short only, 0 long/short - change of 0,00% MRQ |
| Del pris | 35,89 |
| Gennemsnitlig porteføljeallokering | 0.0863 % - change of -82,18% MRQ |
| Institutionelle aktier (lange) | 18.166.516 (ex 13D/G) - change of -2,81MM shares -13,36% MRQ |
| Institutionel værdi (lang) | $ 609.565 USD ($1000) |
Institutionelt ejerskab og aktionærer
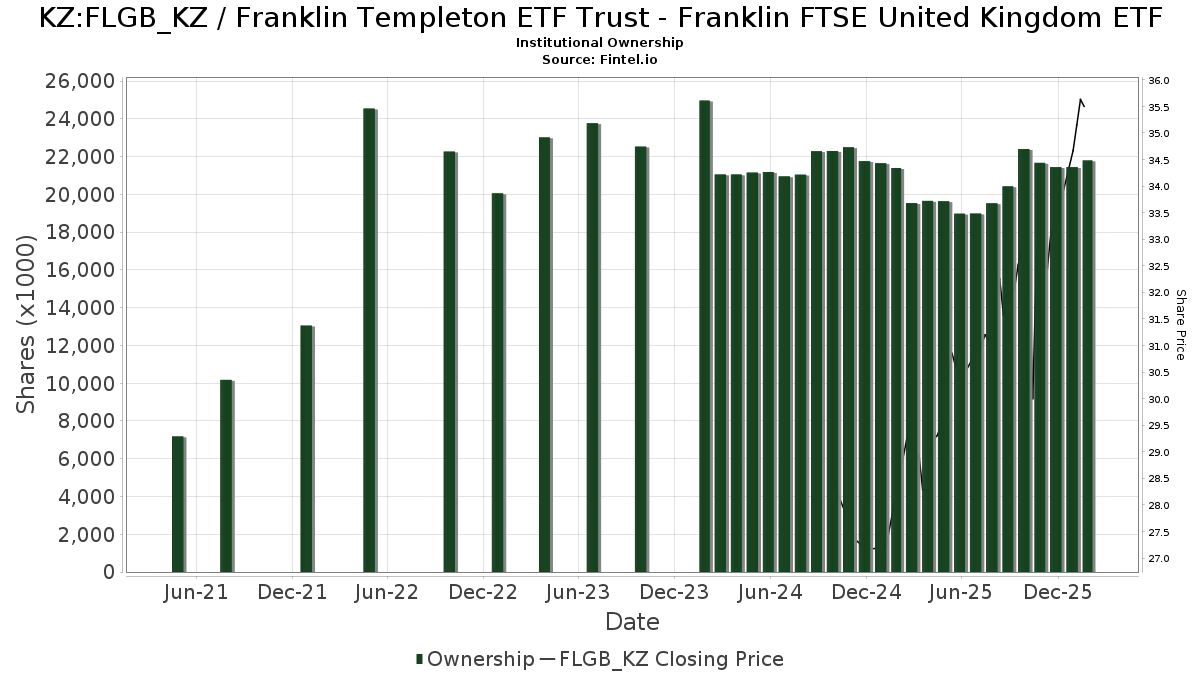
Franklin Templeton ETF Trust - Franklin FTSE United Kingdom ETF (KZ:FLGB_KZ) har 91 institutionelle ejere og aktionærer, der har indsendt 13D/G- eller 13F-formularer til Securities Exchange Commission (SEC). Disse institutioner har i alt 18,166,516 aktier. Største aktionærer omfatter Bank Of America Corp /de/, Janus Henderson Group Plc, Advisor Group Holdings, Inc., GHP Investment Advisors, Inc., Ameriprise Financial Inc, Morgan Stanley, LPL Financial LLC, UBS Group AG, Assetmark, Inc, and Simon Quick Advisors, Llc .
Franklin Templeton ETF Trust - Franklin FTSE United Kingdom ETF (KAS:FLGB_KZ) institutionel ejerskabsstruktur viser aktuelle positioner i virksomheden efter institutioner og fonde, samt seneste ændringer i positionsstørrelse. Større aktionærer kan omfatte individuelle investorer, investeringsforeninger, hedgefonde eller institutioner. Skema 13D angiver, at investoren besidder (eller besidder) mere end 5 % af virksomheden og har til hensigt (eller har til hensigt at) aktivt at forfølge en ændring i forretningsstrategi. Skema 13G indikerer en passiv investering på over 5%.
The share price as of April 24, 2026 is 35,89 / share. Previously, on April 28, 2025, the share price was 29,18 / share. This represents an increase of 23,00% over that period.
Fondens stemningsscore
Fund Sentiment Score (fka Ownership Accumulation Score) finder de aktier, der bliver mest købt af fonde. Det er resultatet af en sofistikeret, multi-faktor kvantitativ model, der identificerer virksomheder med de højeste niveauer af institutionel akkumulering. Scoringsmodellen bruger en kombination af den samlede stigning i oplyste ejere, ændringerne i porteføljeallokeringer i disse ejere og andre målinger. Tallet går fra 0 til 100, hvor højere tal indikerer et højere niveau af akkumulering for sine jævnaldrende, og 50 er gennemsnittet.
Opdateringsfrekvens: Dagligt
Se Ownership Explorer, som giver en liste over højest rangerende virksomheder.
AI+ Ask Fintel’s AI assistant about Franklin Templeton ETF Trust - Franklin FTSE United Kingdom ETF.
Select a question to share a public post with an AI-crafted answer.
Thinking of good questions…
13F og NPORT arkivering
Detaljer om 13F-arkivering er gratis. Detaljer om NP-ansøgninger kræver et premium-medlemskab. Grønne rækker angiver nye positioner. Røde rækker angiver lukkede positioner. Klik på linket ikon for at se den fulde transaktionshistorik.
Opgrader
for at låse premium-data op og eksportere til Excel ![]() .
.
| Fil dato | Kilde | Investor | Type | Gennemsnitlig pris (Øst) |
Aktier | Δ Aktier (%) |
Rapporteret Værdi ($1000) |
Δ Værdi (%) |
Port Alloc (%) |
|
|---|---|---|---|---|---|---|---|---|---|---|
| 2026-04-24 | 13F | Cabot Wealth Management Inc | 52.830 | -54,29 | 1.836 | -52,92 | ||||
| 2026-01-29 | 13F | Camelot Portfolios, LLC | 15 | 1 | ||||||
| 2026-02-05 | 13F | Thrivent Financial For Lutherans | 58.359 | 2 | ||||||
| 2026-02-13 | 13F | Morgan Stanley | 427.640 | -1,44 | 14.433 | 2,95 | ||||
| 2026-02-17 | 13F | Ameriprise Financial Inc | 489.423 | 3.625,53 | 16.518 | 3.795,75 | ||||
| 2026-02-06 | 13F | Envestnet Portfolio Solutions, Inc. | 25.382 | -2,68 | 857 | 1,66 | ||||
| 2026-02-14 | 13F | Rockefeller Capital Management L.P. | 2.031 | -45,08 | 69 | -42,86 | ||||
| 2026-03-20 | 13F | Purpose Unlimited Inc. | 137.493 | 4.631 | ||||||
| 2026-04-23 | 13F | Farmers & Merchants Trust Co of Chambersburg PA | 712 | 0,00 | 0 | |||||
| 2026-02-19 | 13F | CI Private Wealth, LLC | 32.015 | -15,25 | 1.080 | -11,48 | ||||
| 2026-04-20 | 13F | Ronald Blue Trust, Inc. | 143 | -28,14 | 5 | -33,33 | ||||
| 2026-04-06 | 13F | CX Institutional | 15.514 | -0,83 | 1 | |||||
| 2026-02-13 | 13F | Transamerica Financial Advisors, Inc. | 15.541 | 525 | ||||||
| 2026-04-22 | 13F | Patriot Financial Group Insurance Agency, LLC | 9.384 | 326 | ||||||
| 2026-02-17 | 13F | Jones Financial Companies Lllp | 58 | 2 | ||||||
| 2026-02-13 | 13F | Parkside Financial Bank & Trust | 1.000 | 0,00 | 34 | 3,13 | ||||
| 2026-02-05 | 13F | Allworth Financial LP | 107 | 0,00 | 4 | 0,00 | ||||
| 2026-01-30 | 13F | Innealta Capital, Llc | 91.315 | -37,27 | 3.082 | -34,49 | ||||
| 2026-02-05 | 13F | Bessemer Group Inc | 2 | 0,00 | 0 | |||||
| 2026-04-24 | 13F | Bayban | 4.439 | 0,00 | 154 | 3,36 | ||||
| 2026-02-10 | 13F/A | Northwestern Mutual Wealth Management Co | 2.178 | 31,60 | 74 | 37,74 | ||||
| 2026-02-17 | 13F | Qube Research & Technologies Ltd | 240 | 8 | ||||||
| 2026-02-11 | 13F | LPL Financial LLC | 392.481 | 1,74 | 13.246 | 6,28 | ||||
| 2026-02-12 | 13F | Triumph Capital Management | 3.325 | -2,09 | 112 | 2,75 | ||||
| 2026-01-23 | 13F | Assetmark, Inc | 286.620 | -0,56 | 9.673 | 3,88 | ||||
| 2026-02-13 | 13F | Ubs Asset Management Americas Inc | 79 | 3 | ||||||
| 2026-03-06 | 13F | Hsbc Holdings Plc | 7.165 | 242 | ||||||
| 2026-01-30 | 13F | Us Bancorp \de\ | 539 | -48,22 | 18 | -45,45 | ||||
| 2026-04-13 | 13F | IFP Advisors, Inc | 105 | -7,08 | 4 | 0,00 | ||||
| 2026-04-08 | 13F | Mma Asset Management Llc | 141.104 | 1,67 | 4.905 | 4,70 | ||||
| 2025-11-10 | 13F | Siligmueller & Norvid Wealth Advisors LLC | 17.499 | 565 | ||||||
| 2026-04-15 | 13F | Archford Capital Strategies, LLC | 40.843 | 18,00 | 1.420 | 21,49 | ||||
| 2026-02-10 | 13F | Sentinus, LLC | 17.300 | -1,14 | 584 | 3,19 | ||||
| 2026-04-24 | 13F | Swmg, Llc | 11.566 | 0,91 | 402 | -2,19 | ||||
| 2026-01-20 | 13F | Meridian Investment Counsel Inc. | 67.775 | 1,27 | 2.287 | 5,78 | ||||
| 2026-02-11 | 13F | Syon Capital Llc | 14.696 | 496 | ||||||
| 2026-02-13 | 13F | Mml Investors Services, Llc | 17.096 | 6,86 | 577 | 11,63 | ||||
| 2026-02-10 | 13F | Bank of New York Mellon Corp | 12.194 | 6,94 | 412 | 11,68 | ||||
| 2026-02-10 | 13F | Avestar Capital, LLC | 43.788 | 0,00 | 1.478 | 4,46 | ||||
| 2026-02-05 | 13F | Atria Investments Llc | 16.037 | 6,36 | 541 | 11,09 | ||||
| 2026-02-17 | 13F | Cetera Investment Advisers | 9.705 | -3,73 | 328 | 0,62 | ||||
| 2025-11-14 | 13F | Raymond James Financial Inc | 0 | -100,00 | 0 | |||||
| 2026-01-20 | 13F | Harbor Capital Advisors, Inc. | 39.895 | -14,81 | 1 | 0,00 | ||||
| 2026-04-21 | 13F | Ackerman Asset Management, LLC | 7.693 | 0,00 | 267 | 3,09 | ||||
| 2026-04-21 | 13F | GHP Investment Advisors, Inc. | 800.187 | 2,54 | 27.815 | 5,61 | ||||
| 2026-01-29 | 13F | Dunhill Financial, LLC | 2 | 0,00 | 0 | |||||
| 2026-04-17 | 13F | Bell Investment Advisors, Inc | 0 | -100,00 | 0 | |||||
| 2026-01-14 | 13F | Tradewinds Capital Management, LLC | 0 | -100,00 | 0 | |||||
| 2026-02-17 | 13F | Cape Investment Advisory, Inc. | 598 | 0,00 | 20 | 5,26 | ||||
| 2026-02-17 | 13F | Fmr Llc | 5.664 | 1,07 | 191 | 5,52 | ||||
| 2026-01-29 | 13F | UBS Group AG | 307.234 | -9,72 | 10.369 | -5,69 | ||||
| 2026-01-26 | 13F | Private Trust Co Na | 1.533 | -0,45 | 52 | 4,08 | ||||
| 2026-01-26 | 13F | AE Wealth Management LLC | 1.404 | -1,47 | 47 | 2,17 | ||||
| 2026-02-11 | 13F | Franklin Resources Inc | 192 | -99,98 | 6 | -99,98 | ||||
| 2026-01-23 | 13F | Rsm Us Wealth Management Llc | 9.340 | 3,01 | 316 | 7,88 | ||||
| 2026-04-07 | 13F | Farther Finance Advisors, LLC | 1 | -99,92 | 0 | -100,00 | ||||
| 2026-01-29 | 13F | Simon Quick Advisors, Llc | 271.000 | -0,18 | 9.146 | 4,28 | ||||
| 2026-02-05 | 13F | Cambridge Investment Research Advisors, Inc. | 20.872 | 2,77 | 1 | |||||
| 2026-02-17 | 13F | D. E. Shaw & Co., Inc. | 7.084 | 0,00 | 239 | 4,82 | ||||
| 2026-01-29 | 13F | Sanctuary Advisors, LLC | 6.130 | 207 | ||||||
| 2026-02-18 | 13F | EP Wealth Advisors, Inc. | 183.825 | -3,76 | 6.204 | 6,05 | ||||
| 2026-02-05 | 13F | AlphaCore Capital LLC | 1.155 | 0,00 | 39 | 2,70 | ||||
| 2026-02-13 | 13F | National Bank Of Canada /fi/ | 6.716 | -5,32 | 226 | -0,88 | ||||
| 2026-02-13 | 13F | Gts Securities Llc | 36.814 | 1.242 | ||||||
| 2026-04-24 | 13F | Ledyard National Bank | 5.970 | 208 | ||||||
| 2026-04-06 | 13F | Versant Capital Management, Inc | 2.803 | 0,00 | 97 | 3,19 | ||||
| 2026-04-14 | 13F | Thurston, Springer, Miller, Herd & Titak, Inc. | 1.283 | 0,00 | 45 | 2,33 | ||||
| 2026-02-03 | 13F | Emerald Investment Partners, Llc | 0 | -100,00 | 0 | |||||
| 2026-01-29 | 13F | Comerica Bank | 678 | -8,13 | 23 | -4,35 | ||||
| 2026-02-17 | 13F | Royal Bank Of Canada | 60.560 | 12,25 | 2.044 | 17,27 | ||||
| 2026-02-18 | 13F | Beacon Pointe Advisors, LLC | 44.512 | 32,22 | 1.502 | 38,18 | ||||
| 2026-02-17 | 13F | SageView Advisory Group, LLC | 328 | 11 | ||||||
| 2026-04-21 | 13F | Maseco Llp | 0 | -100,00 | 0 | |||||
| 2026-02-17 | 13F | Green Harvest Asset Management LLC | 233.307 | -3,12 | 7.874 | 1,20 | ||||
| 2026-01-26 | 13F | Cwm, Llc | 42 | 44,83 | 0 | |||||
| 2026-02-17 | 13F | Bank Of America Corp /de/ | 10.769.617 | 2,39 | 363.475 | 6,96 | ||||
| 2026-02-04 | 13F | Dynamic Wealth Strategies, LLC | 11.355 | 2.022,43 | 383 | 2.152,94 | ||||
| 2026-02-17 | 13F | Russell Investments Group, Ltd. | 495 | 1,85 | 17 | 6,67 | ||||
| 2025-11-14 | 13F | Jane Street Group, Llc | 0 | -100,00 | 0 | |||||
| 2025-11-14 | 13F | Flow Traders U.s. Llc | 0 | -100,00 | 0 | |||||
| 2026-02-12 | 13F | Rossby Financial, LCC | 81 | 0,00 | 3 | 0,00 | ||||
| 2026-02-06 | 13F | Global Retirement Partners, LLC | 4.753 | -11,37 | 160 | -7,51 | ||||
| 2026-02-17 | 13F | Janus Henderson Group Plc | 1.606.862 | -1,09 | 54.232 | 3,31 | ||||
| 2026-02-17 | 13F | Quantinno Capital Management LP | 49.275 | -6,81 | 1.663 | -2,63 | ||||
| 2026-02-12 | 13F | Steward Partners Investment Advisory, Llc | 106 | -73,50 | 4 | -75,00 | ||||
| 2026-02-17 | 13F | Susquehanna International Group, Llp | 0 | -100,00 | 0 | |||||
| 2026-02-13 | 13F | Wells Fargo & Company/mn | 1 | 0,00 | 0 | |||||
| 2026-01-30 | 13F | Wealthfront Advisers Llc | 11.406 | 0,04 | 385 | 4,35 | ||||
| 2026-02-11 | 13F | O'shaughnessy Asset Management, Llc | 6.987 | 3,39 | 236 | 7,80 | ||||
| 2026-02-17 | 13F | Citadel Advisors Llc | 0 | -100,00 | 0 | |||||
| 2026-02-10 | 13F | Envestnet Asset Management Inc | 216.354 | -17,82 | 7.302 | -14,17 | ||||
| 2026-02-12 | 13F | BRYN MAWR TRUST Co | 0 | -100,00 | 0 | -100,00 | ||||
| 2026-02-13 | 13F | MAI Capital Management | 7 | 16,67 | 0 | |||||
| 2026-02-12 | 13F | Brown Brothers Harriman & Co | 827 | 0,00 | 28 | 3,85 | ||||
| 2025-11-06 | 13F | Abich Financial Wealth Management LLC | 10 | 0 | ||||||
| 2026-02-10 | 13F | Beckerman Institutional, LLC | 16.346 | 0,00 | 552 | 4,36 | ||||
| 2026-02-06 | 13F | Pnc Financial Services Group, Inc. | 3.390 | 7,52 | 114 | 12,87 | ||||
| 2026-02-13 | 13F | Resources Investment Advisors, LLC. | 7.108 | -23,81 | 240 | -20,60 | ||||
| 2026-02-17 | 13F | Advisor Group Holdings, Inc. | 891.778 | -0,40 | 30.098 | 4,07 | ||||
| 2026-02-13 | 13F | Kestra Advisory Services, LLC | 4.707 | 159 | ||||||
| 2026-02-12 | 13F | Principal Securities, Inc. | 42.491 | 0,44 | 1.434 | 4,98 |
Other Listings
| US:FLGB | 35,92 $ |