0N9S - Eni S.p.A. Aktie - Aktiekurs, institutionelt ejerskab, aktionærer (LSE)

Eni S.p.A.
GB ˙ LSE ˙ IT0003132476
23,73 € ↑0,31 (1,31%)
2026-03-27
DEL PRIS
Grundlæggende statistik
Institutionelle ejere 13 total, 13 long only, 0 short only, 0 long/short - change of -96,31% MRQ
Del pris 23,73
Gennemsnitlig porteføljeallokering 0.7324 % - change of 93,57% MRQ
Deler fremragende shares (source: Capital IQ)
Institutionelle aktier (lange) 7.579.046 - 0,27% (ex 13D/G) - change of -291,08MM shares -97,46% MRQ
Institutionel værdi (lang) $ 157.303 USD ($1000)
Institutionelt ejerskab og aktionærer

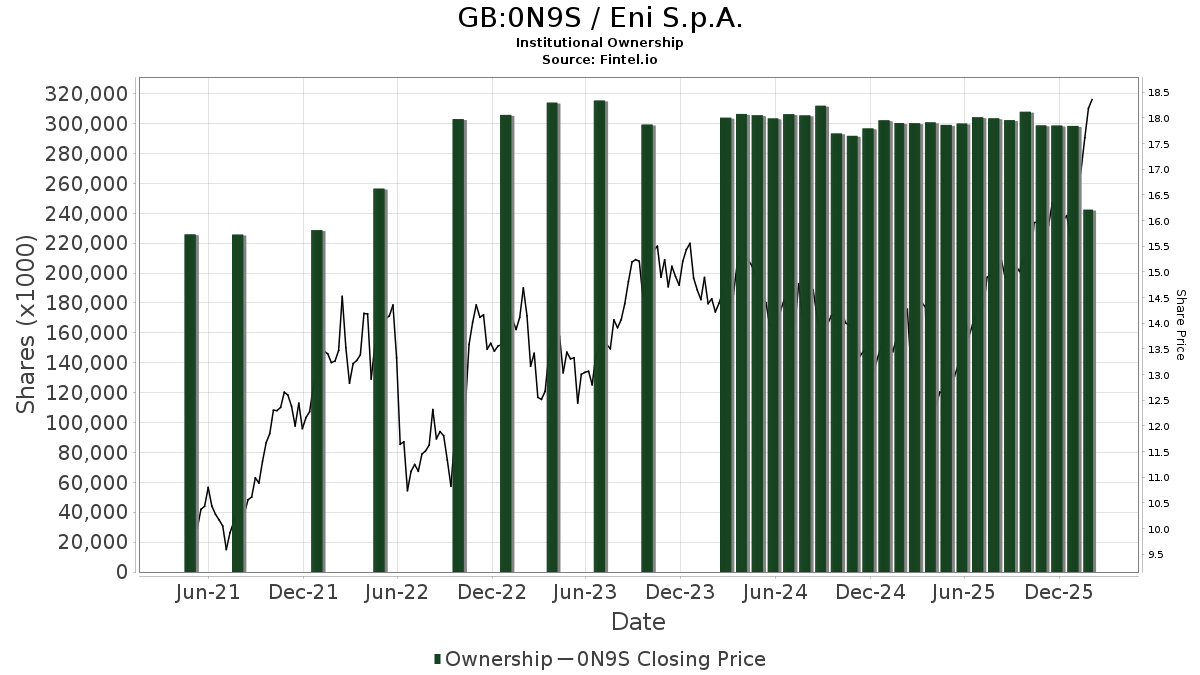
Eni S.p.A. (GB:0N9S) har 13 institutionelle ejere og aktionærer, der har indsendt 13D/G- eller 13F-formularer til Securities Exchange Commission (SEC). Disse institutioner har i alt 7,579,046 aktier. Største aktionærer omfatter GCOW - Pacer Global Cash Cows Dividend ETF, Pacer Advisors, Inc., ICOW - Pacer Developed Markets International Cash Cows 100 ETF, PXF - Invesco FTSE RAFI Developed Markets ex-U.S. ETF, MPIEX - MONDRIAN INTERNATIONAL VALUE EQUITY FUND, Generali Investments CEE, investicni spolecnost, a.s., EFAS - Global X MSCI SuperDividend EAFE ETF, PTIN - Pacer Trendpilot International ETF, PTEU - Pacer Trendpilot European Index ETF, and VWID - Virtus WMC Global Factor Opportunities ETF .

Eni S.p.A. (LSE:0N9S) institutionel ejerskabsstruktur viser aktuelle positioner i virksomheden efter institutioner og fonde, samt seneste ændringer i positionsstørrelse. Større aktionærer kan omfatte individuelle investorer, investeringsforeninger, hedgefonde eller institutioner. Skema 13D angiver, at investoren besidder (eller besidder) mere end 5 % af virksomheden og har til hensigt (eller har til hensigt at) aktivt at forfølge en ændring i forretningsstrategi. Skema 13G indikerer en passiv investering på over 5%.

The share price as of March 27, 2026 is 23,73 / share. Previously, on March 31, 2025, the share price was 14,26 / share. This represents an increase of 66,44% over that period.

GB:0N9S / Eni S.p.A. Institutional Ownership
Fondens stemningsscore

Fund Sentiment Score (fka Ownership Accumulation Score) finder de aktier, der bliver mest købt af fonde. Det er resultatet af en sofistikeret, multi-faktor kvantitativ model, der identificerer virksomheder med de højeste niveauer af institutionel akkumulering. Scoringsmodellen bruger en kombination af den samlede stigning i oplyste ejere, ændringerne i porteføljeallokeringer i disse ejere og andre målinger. Tallet går fra 0 til 100, hvor højere tal indikerer et højere niveau af akkumulering for sine jævnaldrende, og 50 er gennemsnittet.

Opdateringsfrekvens: Dagligt

Se Ownership Explorer, som giver en liste over højest rangerende virksomheder.

AI+ Ask Fintel’s AI assistant about Eni S.p.A..

Select a question to share a public post with an AI-crafted answer.

Thinking of good questions…
13F og NPORT arkivering

Detaljer om 13F-arkivering er gratis. Detaljer om NP-ansøgninger kræver et premium-medlemskab. Grønne rækker angiver nye positioner. Røde rækker angiver lukkede positioner. Klik på linket ikon for at se den fulde transaktionshistorik.

Opgrader for at låse premium-data op og eksportere til Excel .

Fil dato Kilde Investor Type Gennemsnitlig pris
(Øst)
Aktier Δ Aktier
(%)
Rapporteret
Værdi
($1000)
Δ Værdi
(%)
Port Alloc
(%)
2025-09-29 NP AIM INTERNATIONAL MUTUAL FUNDS (INVESCO INTERNATIONAL MUTUAL FUNDS) - Invesco Oppenheimer Global Multi-Asset Growth Fund Class R6 1.375 -80,47 23 -79,65
2026-01-14 13F Generali Investments CEE, investicni spolecnost, a.s. 168.400 0,00 3.191 8,61
2025-09-29 NP MPIEX - MONDRIAN INTERNATIONAL VALUE EQUITY FUND 463.553 -3,45 7.912 15,05
2025-09-29 NP VWID - Virtus WMC Global Factor Opportunities ETF 5.002 1,05 85 19,72
2026-02-04 13F Paradigm Asset Management Co Llc 3.743 0,00 71 7,69
2026-02-04 13F Pacer Advisors, Inc. 2.264.218 -45,68 66.465 -8,65
2025-09-29 NP PTEU - Pacer Trendpilot European Index ETF 10.894 9,27 185 29,37
2025-09-29 NP PTIN - Pacer Trendpilot International ETF 17.497 -8,99 298 8,79
2025-09-29 NP GCOW - Pacer Global Cash Cows Dividend ETF 2.592.126 -3,49 44.106 14,14
2025-09-29 NP CEFA - Global X S&P Catholic Values Developed ex-U.S. ETF This fund is a listed as child fund of Mirae Asset Global Investments Co., Ltd. and if that institution has disclosed ownership in this security, then these positions will not be double counted when calculating total shares and total value 2.933 -10,69 50 6,38
2025-09-29 NP ICOW - Pacer Developed Markets International Cash Cows 100 ETF 1.484.602 5,64 25.261 24,94
2025-09-29 NP EFAS - Global X MSCI SuperDividend EAFE ETF This fund is a listed as child fund of Mirae Asset Global Investments Co., Ltd. and if that institution has disclosed ownership in this security, then these positions will not be double counted when calculating total shares and total value 33.337 232,51 569 294,44
2025-09-29 NP PXF - Invesco FTSE RAFI Developed Markets ex-U.S. ETF This fund is a listed as child fund of Invesco Ltd. and if that institution has disclosed ownership in this security, then these positions will not be double counted when calculating total shares and total value 531.366 -0,05 9.096 19,04
Other Listings
AT:ENI 23,79 €
IT:ENI 23,92 €
DE:ENI 23,84 €
Fintel data has been cited in the following publications:
Daily Mail Fox Business Business Insider Wall Street Journal The Washington Post Bloomberg Financial Times Globe and Mail
NASDAQ.com Reuters The Guardian Associated Press FactCheck.org Snopes Politifact
Federal Register The Intercept Forbes Fortune Magazine TheStreet Time Magazine Canadian Broadcasting Corporation International Business Times
Cambridge University Press Investopedia MarketWatch NY Daily News Entrepreneur Newsweek Barron's El Economista