Grundlæggende statistik
| Institutionelle ejere | 119 total, 108 long only, 0 short only, 11 long/short - change of -4,03% MRQ |
| Del pris | 1,94 |
| Gennemsnitlig porteføljeallokering | 0.0582 % - change of -54,88% MRQ |
| Institutionelle aktier (lange) | 70.631.067 (ex 13D/G) - change of -7,44MM shares -9,54% MRQ |
| Institutionel værdi (lang) | $ 108.466 USD ($1000) |
Institutionelt ejerskab og aktionærer
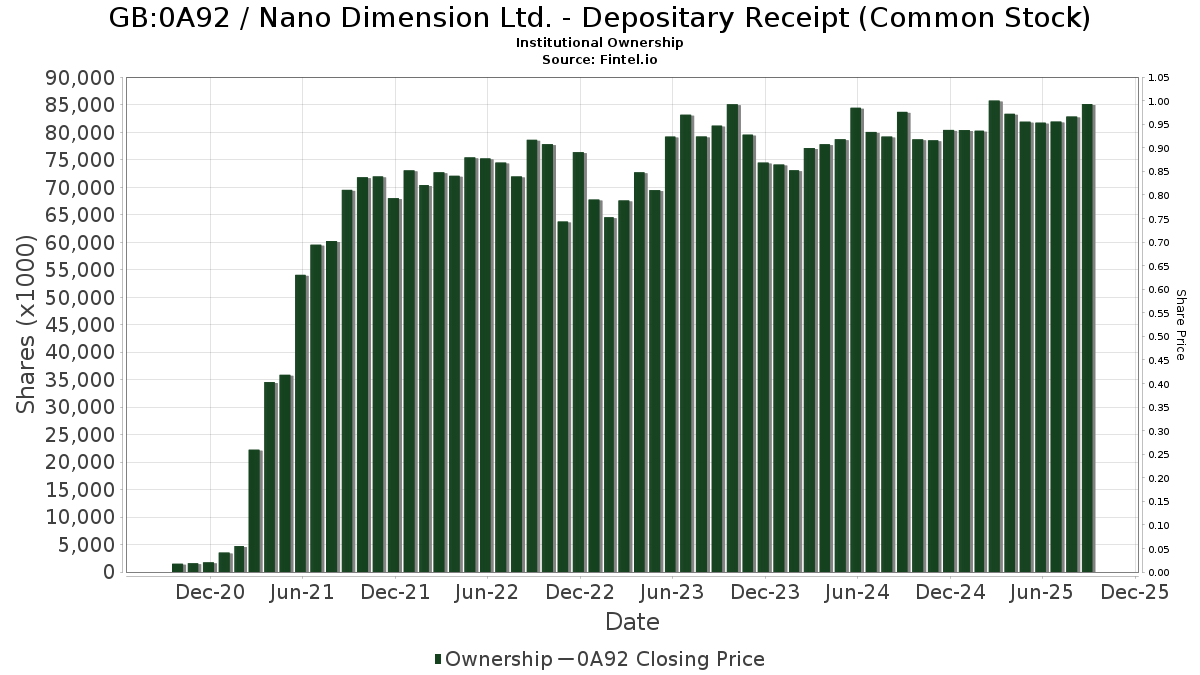
Nano Dimension Ltd. - Depositary Receipt (Common Stock) (GB:0A92) har 119 institutionelle ejere og aktionærer, der har indsendt 13D/G- eller 13F-formularer til Securities Exchange Commission (SEC). Disse institutioner har i alt 70,631,067 aktier. Største aktionærer omfatter Murchinson Ltd., State Street Corp, Boothbay Fund Management, Llc, Caption Management, LLC, Group One Trading, L.p., Ameriprise Financial Inc, Susquehanna International Group, Llp, Morgan Stanley, Group One Trading, L.p., and Caption Management, LLC .
Nano Dimension Ltd. - Depositary Receipt (Common Stock) (LSE:0A92) institutionel ejerskabsstruktur viser aktuelle positioner i virksomheden efter institutioner og fonde, samt seneste ændringer i positionsstørrelse. Større aktionærer kan omfatte individuelle investorer, investeringsforeninger, hedgefonde eller institutioner. Skema 13D angiver, at investoren besidder (eller besidder) mere end 5 % af virksomheden og har til hensigt (eller har til hensigt at) aktivt at forfølge en ændring i forretningsstrategi. Skema 13G indikerer en passiv investering på over 5%.
The share price as of May 1, 2026 is 1,94 / share. Previously, on December 2, 2025, the share price was 1,80 / share. This represents an increase of 7,89% over that period.
Fondens stemningsscore
Fund Sentiment Score (fka Ownership Accumulation Score) finder de aktier, der bliver mest købt af fonde. Det er resultatet af en sofistikeret, multi-faktor kvantitativ model, der identificerer virksomheder med de højeste niveauer af institutionel akkumulering. Scoringsmodellen bruger en kombination af den samlede stigning i oplyste ejere, ændringerne i porteføljeallokeringer i disse ejere og andre målinger. Tallet går fra 0 til 100, hvor højere tal indikerer et højere niveau af akkumulering for sine jævnaldrende, og 50 er gennemsnittet.
Opdateringsfrekvens: Dagligt
Se Ownership Explorer, som giver en liste over højest rangerende virksomheder.
AI+ Ask Fintel’s AI assistant about Nano Dimension Ltd. - Depositary Receipt (Common Stock).
Select a question to share a public post with an AI-crafted answer.
Thinking of good questions…
13F og NPORT arkivering
Detaljer om 13F-arkivering er gratis. Detaljer om NP-ansøgninger kræver et premium-medlemskab. Grønne rækker angiver nye positioner. Røde rækker angiver lukkede positioner. Klik på linket ikon for at se den fulde transaktionshistorik.
Opgrader
for at låse premium-data op og eksportere til Excel ![]() .
.
| Fil dato | Kilde | Investor | Type | Gennemsnitlig pris (Øst) |
Aktier | Δ Aktier (%) |
Rapporteret Værdi ($1000) |
Δ Værdi (%) |
Port Alloc (%) |
|
|---|---|---|---|---|---|---|---|---|---|---|
| 2026-02-12 | 13F | Principal Securities, Inc. | 0 | -100,00 | 0 | |||||
| 2026-04-17 | 13F | Ambassador Advisors, LLC | 160.000 | -1,23 | 272 | 9,24 | ||||
| 2025-11-07 | 13F | Shell Asset Management Co | 0 | -100,00 | 0 | |||||
| 2026-02-17 | 13F | Point72 Asset Management, L.P. | 26.121 | 40 | ||||||
| 2026-02-13 | 13F | Caitong International Asset Management Co., Ltd | 19.459 | 392,26 | 30 | 383,33 | ||||
| 2026-05-01 | 13F | Hohimer Wealth Management, Llc | 11.000 | 0,00 | 19 | 12,50 | ||||
| 2026-01-29 | 13F | Marathon Capital Management | 20.000 | 0,00 | 31 | -3,23 | ||||
| 2026-02-17 | 13F | Caption Management, LLC | Put | 7.247.200 | 0,00 | 11.161 | -1,92 | |||
| 2026-02-17 | 13F | Sphera Management Technology Funds Ltd | 0 | -100,00 | 0 | |||||
| 2026-02-17 | 13F | Caption Management, LLC | 2.412.674 | -19,71 | 3.716 | -21,24 | ||||
| 2026-02-11 | 13F | Jpmorgan Chase & Co | 57.547 | -83,49 | 89 | -83,91 | ||||
| 2026-02-17 | 13F | XTX Topco Ltd | 378.029 | 286,96 | 582 | 280,39 | ||||
| 2026-02-12 | 13F | Insigneo Advisory Services, Llc | 14.000 | 0,00 | 22 | 0,00 | ||||
| 2026-04-27 | 13F | Sound Income Strategies, LLC | 2.695 | 0,00 | 5 | 0,00 | ||||
| 2026-02-13 | 13F | Headlands Technologies LLC | 53.076 | 82 | ||||||
| 2026-02-17 | 13F | MIRAE ASSET GLOBAL ETFS HOLDINGS Ltd. | 46.308 | -3,56 | 71 | -5,33 | ||||
| 2026-02-17 | 13F | Boothbay Fund Management, Llc | 7.775.000 | 0,00 | 11.974 | -1,91 | ||||
| 2025-11-13 | 13F | Marshall Wace, Llp | 402.330 | -3,62 | 632 | -6,66 | ||||
| 2026-04-20 | 13F | Ronald Blue Trust, Inc. | 10.004 | -26,76 | 17 | -19,05 | ||||
| 2026-04-30 | 13F | Griffin Asset Management, Inc. | 28.500 | 0,00 | 48 | 11,63 | ||||
| 2026-02-17 | 13F | Raymond James Financial Inc | 16.802 | 19,62 | 26 | 13,64 | ||||
| 2026-02-17 | 13F | Susquehanna International Group, Llp | 2.673.453 | 35,96 | 4.117 | 33,37 | ||||
| 2026-02-13 | 13F | American Century Companies Inc | 10.733 | 17 | ||||||
| 2026-02-17 | 13F | Susquehanna International Group, Llp | Put | 66.600 | -94,50 | 103 | -94,63 | |||
| 2026-02-17 | 13F | Susquehanna International Group, Llp | Call | 694.700 | 406,34 | 1.070 | 397,21 | |||
| 2026-04-16 | 13F | SG Americas Securities, LLC | 0 | -100,00 | 0 | |||||
| 2026-02-13 | 13F | Aigen Investment Management, Lp | 0 | -100,00 | 0 | |||||
| 2026-02-12 | 13F | EntryPoint Capital, LLC | 68.863 | 0,00 | 106 | -1,85 | ||||
| 2026-02-17 | 13F | Jones Financial Companies Lllp | 6.151 | 2,86 | 9 | 0,00 | ||||
| 2025-11-06 | 13F | Ameritas Advisory Services, LLC | 0 | -100,00 | 0 | |||||
| 2025-11-13 | 13F | MYDA Advisors LLC | 0 | -100,00 | 0 | |||||
| 2026-02-03 | 13F | Mitsubishi UFJ Kokusai Asset Management Co., Ltd. | 597.896 | -4,22 | 933 | -4,90 | ||||
| 2026-01-22 | 13F | Bartlett & Co. Wealth Management Llc | 250 | 0,00 | 0 | |||||
| 2026-01-06 | 13F | Advance Capital Management, Inc. | 0 | -100,00 | 0 | |||||
| 2026-02-17 | 13F | Quadrature Capital Ltd | 0 | -100,00 | 0 | |||||
| 2026-02-17 | 13F | Royal Bank Of Canada | 0 | -100,00 | 0 | |||||
| 2026-02-12 | 13F | Steward Partners Investment Advisory, Llc | 52 | 26,83 | 0 | |||||
| 2026-04-07 | 13F | Signaturefd, Llc | 5.034 | 0,00 | 9 | 14,29 | ||||
| 2026-02-17 | 13F | Permanens Capital L.P. | 0 | -100,00 | 0 | |||||
| 2026-03-04 | 13F | SHP Wealth Management | 358 | 1 | ||||||
| 2026-04-10 | 13F | DKM Wealth Management, Inc. | 10.000 | 0,00 | 17 | 13,33 | ||||
| 2026-04-15 | 13F | Activest Wealth Management | 1.000 | 0,00 | 2 | 0,00 | ||||
| 2026-02-06 | 13F | GPS Wealth Strategies Group, LLC | 0 | -100,00 | 0 | |||||
| 2026-02-10 | 13F/A | Northwestern Mutual Wealth Management Co | 1 | 0 | ||||||
| 2026-01-28 | 13F | Peapod Lane Capital LLC | 1.760.516 | 14,69 | 2.711 | 12,49 | ||||
| 2026-02-13 | 13F | Gen-Wealth Partners Inc | 216 | 0,00 | 0 | |||||
| 2025-11-14 | 13F | Cubist Systematic Strategies, LLC | 110.567 | 30,13 | 174 | 26,28 | ||||
| 2026-01-15 | 13F | Founders Capital Management | 0 | -100,00 | 0 | -100,00 | ||||
| 2026-04-24 | 13F | Key FInancial Inc | 9 | 0,00 | 0 | |||||
| 2026-02-17 | 13F | Ameriprise Financial Inc | 4.813.662 | 0,96 | 7.413 | -0,96 | ||||
| 2026-02-17 | 13F | Immersion Corp | 0 | -100,00 | 0 | |||||
| 2026-02-09 | 13F | Clearwater Capital Advisors, LLC | 26.353 | -3,54 | 41 | -4,76 | ||||
| 2026-02-17 | 13F | Two Sigma Securities, Llc | 105.247 | 558,12 | 162 | 548,00 | ||||
| 2026-02-13 | 13F | Pingora Partners LLC | 14.000 | 0,00 | 22 | 0,00 | ||||
| 2026-02-04 | 13F | Pacer Advisors, Inc. | 0 | -100,00 | 0 | |||||
| 2026-02-12 | 13F | Jane Street Group, Llc | Call | 55.100 | 320,61 | 85 | 320,00 | |||
| 2026-02-12 | 13F | Jane Street Group, Llc | 1.848.609 | 0,66 | 2.847 | -1,28 | ||||
| 2026-01-29 | 13F | Verdence Capital Advisors LLC | 0 | -100,00 | 0 | |||||
| 2025-11-13 | 13F | Renaissance Technologies Llc | 0 | -100,00 | 0 | -100,00 | ||||
| 2026-02-12 | 13F | Jane Street Group, Llc | Put | 708.100 | 1,14 | 1.090 | -0,82 | |||
| 2026-02-17 | 13F | Jump Financial, LLC | 94.323 | 512,49 | 145 | 504,17 | ||||
| 2026-01-21 | 13F | Newbridge Financial Services Group, Inc. | 600 | 1 | ||||||
| 2026-04-16 | 13F | Tactive Advisors, LLC | 570.190 | -5,19 | 969 | 4,64 | ||||
| 2026-02-13 | 13F | State Street Corp | 10.362.517 | 2.278,54 | 15.958 | 2.236,46 | ||||
| 2026-02-17 | 13F | Quantinno Capital Management LP | 19.000 | 29 | ||||||
| 2026-04-06 | 13F | GAMMA Investing LLC | 24.545 | -6,48 | 42 | 2,50 | ||||
| 2026-02-10 | 13F | Rothschild Investment Llc | 25 | 0,00 | 0 | |||||
| 2025-11-13 | 13F | Riggs Asset Managment Co. Inc. | 0 | -100,00 | 0 | |||||
| 2026-02-10 | 13F | Daiwa Securities Group Inc. | 37.638 | 6,03 | 0 | |||||
| 2026-02-17 | 13F | Bank Of America Corp /de/ | 4.855 | -76,78 | 7 | -78,12 | ||||
| 2026-02-17 | 13F | Two Sigma Advisers, Lp | 574.200 | 25,62 | 884 | 23,29 | ||||
| 2026-02-13 | 13F | Barclays Plc | 0 | -100,00 | 0 | |||||
| 2026-02-17 | 13F | Clearline Capital LP | 1.918.977 | -70,46 | 2.955 | -71,03 | ||||
| 2026-02-17 | 13F | Captrust Financial Advisors | 15.481 | -9,53 | 24 | -11,54 | ||||
| 2025-11-12 | 13F | Us Bancorp \de\ | 0 | -100,00 | 0 | |||||
| 2026-01-27 | 13F | TD Waterhouse Canada Inc. | 2.640 | 0,00 | 4 | 0,00 | ||||
| 2026-02-11 | 13F | ARK Investment Management LLC | 1.657.901 | -14,36 | 2.553 | -15,99 | ||||
| 2025-11-13 | 13F | Public Employees Retirement Association Of Colorado | 0 | -100,00 | 0 | |||||
| 2026-02-13 | 13F | Wells Fargo & Company/mn | 19.113 | 266,15 | 29 | 262,50 | ||||
| 2026-02-17 | 13F | Advisory Services Network, LLC | 12.180 | 3,31 | 19 | 0,00 | ||||
| 2026-02-17 | 13F | Susquehanna Fundamental Investments, Llc | 27.026 | 42 | ||||||
| 2026-02-12 | 13F | Hrt Financial Lp | 0 | -100,00 | 0 | |||||
| 2026-03-12 | 13F/A | Peak6 Llc | Call | 90.000 | 139 | |||||
| 2026-02-17 | 13F | Murchinson Ltd. | 15.550.000 | 0,00 | 23.947 | -1,91 | ||||
| 2026-02-13 | 13F | Bard Associates Inc | 96.500 | 0,00 | 149 | -1,99 | ||||
| 2026-02-17 | 13F | SageView Advisory Group, LLC | 1.320 | 2 | ||||||
| 2026-04-17 | 13F | Anchyra Partners Llc | 44.935 | 0,00 | 76 | 10,14 | ||||
| 2026-04-30 | 13F | Clear Street Markets Llc | 10.000 | 0,00 | 17 | 13,33 | ||||
| 2026-02-14 | 13F | Rockefeller Capital Management L.P. | 0 | -100,00 | 0 | |||||
| 2026-02-10 | 13F | Measured Wealth Private Client Group, LLC | 1 | 0,00 | 0 | |||||
| 2026-02-06 | 13F | Nano Cap New Millennium Growth Fund L P | 225.000 | 346 | ||||||
| 2025-11-13 | 13F | Jaffetilchin Investment Partners, LLC | 0 | -100,00 | 0 | |||||
| 2026-01-21 | 13F | Modera Wealth Management, LLC | 16.500 | 0,00 | 25 | 0,00 | ||||
| 2026-02-11 | 13F | Simplex Trading, Llc | Call | 193.500 | 109,87 | 298 | ||||
| 2026-02-11 | 13F | Simplex Trading, Llc | Put | 1.118.600 | -0,08 | 1.723 | 172.100,00 | |||
| 2026-02-11 | 13F | Simplex Trading, Llc | 903.900 | -5,72 | 1.392 | 139.100,00 | ||||
| 2026-02-13 | 13F | Colony Group, LLC | 30.000 | 9,09 | 46 | 6,98 | ||||
| 2026-02-13 | 13F | Squarepoint Ops LLC | 79.418 | 18,59 | 122 | 16,19 | ||||
| 2026-02-17 | 13F | Millennium Management Llc | 2.135.600 | 59,45 | 3.289 | 56,42 | ||||
| 2026-02-17 | 13F | Fmr Llc | 2 | 0,00 | 0 | |||||
| 2026-02-13 | 13F | Squarepoint Ops LLC | Put | 60.600 | 0,00 | 93 | -2,11 | |||
| 2026-02-17 | 13F | Credit Agricole S A | 412.500 | 635 | ||||||
| 2026-02-17 | 13F | Parallax Volatility Advisers, L.P. | 83.884 | 17,87 | 129 | 16,22 | ||||
| 2026-02-06 | 13F | EverSource Wealth Advisors, LLC | 339 | 1 | ||||||
| 2026-02-12 | 13F | Commonwealth Equity Services, Llc | 0 | -100,00 | 0 | |||||
| 2026-02-17 | 13F | Parallax Volatility Advisers, L.P. | Put | 100.000 | 0,00 | 154 | -1,91 | |||
| 2025-11-18 | 13F | Kozak & Associates, Inc. | 0 | -100,00 | 0 | |||||
| 2026-02-12 | 13F | Federation des caisses Desjardins du Quebec | 3.601 | 0,00 | 6 | 0,00 | ||||
| 2025-11-07 | 13F | Gsa Capital Partners Llp | 0 | -100,00 | 0 | |||||
| 2026-02-17 | 13F | Advisor Group Holdings, Inc. | 39.848 | -38,97 | 61 | -32,22 | ||||
| 2026-02-12 | 13F | BlackRock, Inc. | 3 | 0,00 | 0 | |||||
| 2026-02-17 | 13F | Css Llc/il | 44.294 | -65,74 | 68 | -66,34 | ||||
| 2026-02-04 | 13F | Atlantic Union Bankshares Corp | 100 | 0,00 | 0 | |||||
| 2026-04-10 | 13F | Abound Wealth Management | 142 | 0 | ||||||
| 2026-02-09 | 13F | Kingsview Wealth Management, LLC | 0 | -100,00 | 0 | |||||
| 2025-11-14 | 13F | Wolverine Trading, Llc | 195.538 | 12,75 | 311 | 9,15 | ||||
| 2026-04-28 | 13F | SBI Securities Co., Ltd. | 5.803 | 3,57 | 10 | 12,50 | ||||
| 2025-11-14 | 13F | Point72 Asia (Singapore) Pte. Ltd. | 4 | -99,99 | 0 | -100,00 | ||||
| 2025-11-14 | 13F | Wolverine Trading, Llc | Call | 47.000 | 39,05 | 75 | 34,55 | |||
| 2026-02-13 | 13F | Citigroup Inc | 48.918 | 152,96 | 75 | 150,00 | ||||
| 2025-11-14 | 13F | Wolverine Trading, Llc | Put | 63.500 | 45,31 | 101 | 40,85 | |||
| 2026-04-13 | 13F | IFP Advisors, Inc | 31.312 | 0,00 | 53 | 10,42 | ||||
| 2026-04-30 | 13F | Sequoia Financial Advisors, LLC | 12.156 | 21 | ||||||
| 2026-02-06 | 13F | Larson Financial Group LLC | 117 | 91,80 | 0 | |||||
| 2026-02-17 | 13F | Two Sigma Investments, Lp | 1.853.107 | 138,27 | 2.854 | 133,66 | ||||
| 2026-02-05 | 13F | Allworth Financial LP | 1.000 | 0,00 | 2 | 0,00 | ||||
| 2026-01-29 | 13F | UBS Group AG | 841.196 | -1,19 | 1.295 | -3,07 | ||||
| 2026-02-13 | 13F | Morgan Stanley | 2.618.051 | -14,90 | 4.032 | -16,54 | ||||
| 2026-04-20 | 13F | Kestra Private Wealth Services, Llc | 13.000 | 22 | ||||||
| 2026-02-11 | 13F | Parallel Advisors, LLC | 391 | 0,00 | 1 | |||||
| 2026-02-17 | 13F | Man Group plc | 1.946.899 | 133,28 | 2.998 | 128,85 | ||||
| 2026-04-07 | 13F | Farther Finance Advisors, LLC | 450 | -4,86 | 1 | |||||
| 2026-04-15 | 13F | FNY Investment Advisers, LLC | 10.600 | -33,45 | 0 | |||||
| 2025-11-07 | 13F | Pnc Financial Services Group, Inc. | 0 | -100,00 | 0 | |||||
| 2026-02-17 | 13F | Cetera Investment Advisers | 16.958 | 3,23 | 26 | 4,00 | ||||
| 2026-02-10 | 13F | Goldman Sachs Group Inc | 134.256 | -72,54 | 207 | -73,14 | ||||
| 2026-02-13 | 13F | Arete Wealth Advisors, LLC | 39.186 | -33,26 | 0 | |||||
| 2026-02-13 | 13F | Toroso Investments, LLC | 228.899 | -19,91 | 353 | -21,43 | ||||
| 2026-02-18 | 13F | Vident Advisory, LLC | 26.006 | -49,71 | 40 | -50,62 | ||||
| 2026-02-17 | 13F | Leonteq Securities AG | 0 | -100,00 | 0 | |||||
| 2026-01-29 | 13F | IMC-Chicago, LLC | 210.181 | -45,33 | 324 | -46,43 | ||||
| 2026-01-29 | 13F | IMC-Chicago, LLC | Put | 181.300 | -51,54 | 279 | -52,47 | |||
| 2026-02-09 | 13F | Geode Capital Management, Llc | 173.788 | 0,00 | 268 | -1,84 | ||||
| 2026-02-09 | 13F | Kazazian Asset Management, LLC | 63.700 | -36,30 | 98 | -37,58 | ||||
| 2026-01-29 | 13F | IMC-Chicago, LLC | Call | 451.000 | 22,99 | 695 | 20,70 | |||
| 2026-02-17 | 13F | Engineers Gate Manager LP | 31.641 | 108,55 | 49 | 108,70 | ||||
| 2026-02-09 | 13F | Hartland & Co., LLC | 18 | 0 | ||||||
| 2025-11-14 | 13F | Anson Funds Management LP | 0 | -100,00 | 0 | -100,00 | ||||
| 2026-02-17 | 13F | Creative Planning | 21.038 | -6,22 | 32 | -8,57 | ||||
| 2026-02-17 | 13F | Tower Research Capital LLC (TRC) | 0 | -100,00 | 0 | |||||
| 2026-02-06 | 13F | Entrust Financial Llc | 300 | 0 | ||||||
| 2025-11-13 | 13F | Arrowstreet Capital, Limited Partnership | 0 | -100,00 | 0 | -100,00 | ||||
| 2026-01-29 | 13F | UBS Group AG | Put | 5.400 | 0,00 | 8 | 0,00 | |||
| 2026-02-11 | 13F | Group One Trading, L.p. | Call | 494.800 | 55,89 | 762 | 52,81 | |||
| 2026-02-23 | 13F | Beaird Harris Wealth Management, LLC | 1.115 | 0,00 | 2 | 0,00 | ||||
| 2026-02-11 | 13F | Group One Trading, L.p. | Put | 5.292.100 | -7,31 | 8.150 | -9,08 | |||
| 2026-01-27 | 13F | WealthCollab, LLC | 0 | -100,00 | 0 | |||||
| 2026-02-17 | 13F | Citadel Advisors Llc | Call | 179.400 | 74,34 | 276 | 71,43 | |||
| 2026-02-11 | 13F | Group One Trading, L.p. | 2.415.732 | -30,09 | 3.720 | -31,43 | ||||
| 2026-02-12 | 13F | Wealthspire Advisors, LLC | 0 | -100,00 | 0 | |||||
| 2026-02-23 | 13F | Virtu Financial LLC | 209.296 | 0 | ||||||
| 2026-02-03 | 13F | Koshinski Asset Management, Inc. | 0 | -100,00 | 0 | |||||
| 2026-04-27 | 13F | Qrg Capital Management, Inc. | 36.150 | 16,41 | 61 | 29,79 | ||||
| 2026-02-03 | 13F | We Are One Seven, LLC | 16.900 | -5,59 | 26 | -7,14 | ||||
| 2025-11-14 | 13F | Sphera Funds Management Ltd. | 0 | -100,00 | 0 | |||||
| 2026-02-10 | 13F | Bnp Paribas Arbitrage, Sa | 3.500 | -90,20 | 5 | -91,07 | ||||
| 2025-11-12 | 13F | Cresset Asset Management, LLC | 0 | -100,00 | 0 | |||||
| 2026-04-07 | 13F | Financially Speaking Inc | 1.000 | 0,00 | 2 | 0,00 | ||||
| 2026-04-08 | 13F | Thompson Investment Management, Inc. | 1.000 | 0,00 | 2 | 0,00 | ||||
| 2026-02-13 | 13F | Rhumbline Advisers | 49.019 | 13,03 | 75 | 10,29 | ||||
| 2026-02-11 | 13F | LPL Financial LLC | 300.306 | 59,08 | 462 | 56,08 | ||||
| 2026-04-15 | 13F | Merit Financial Group, LLC | 22.003 | 0,01 | 37 | 12,12 | ||||
| 2026-02-13 | 13F | Truvestments Capital Llc | 0 | -100,00 | 0 | |||||
| 2026-02-17 | 13F | Citadel Advisors Llc | Put | 570.500 | 1,97 | 879 | 0,00 | |||
| 2026-04-07 | 13F | CoreCap Advisors, LLC | 500 | 0,00 | 1 | |||||
| 2026-02-17 | 13F | Citadel Advisors Llc | 544.420 | -77,15 | 838 | -77,59 |