Grundlæggende statistik
| Institutionelle aktier (lange) | 1.074.315 - 2,95% (ex 13D/G) - change of 0,16MM shares 17,67% MRQ |
| Institutionel værdi (lang) | $ 6.198 USD ($1000) |
Institutionelt ejerskab og aktionærer
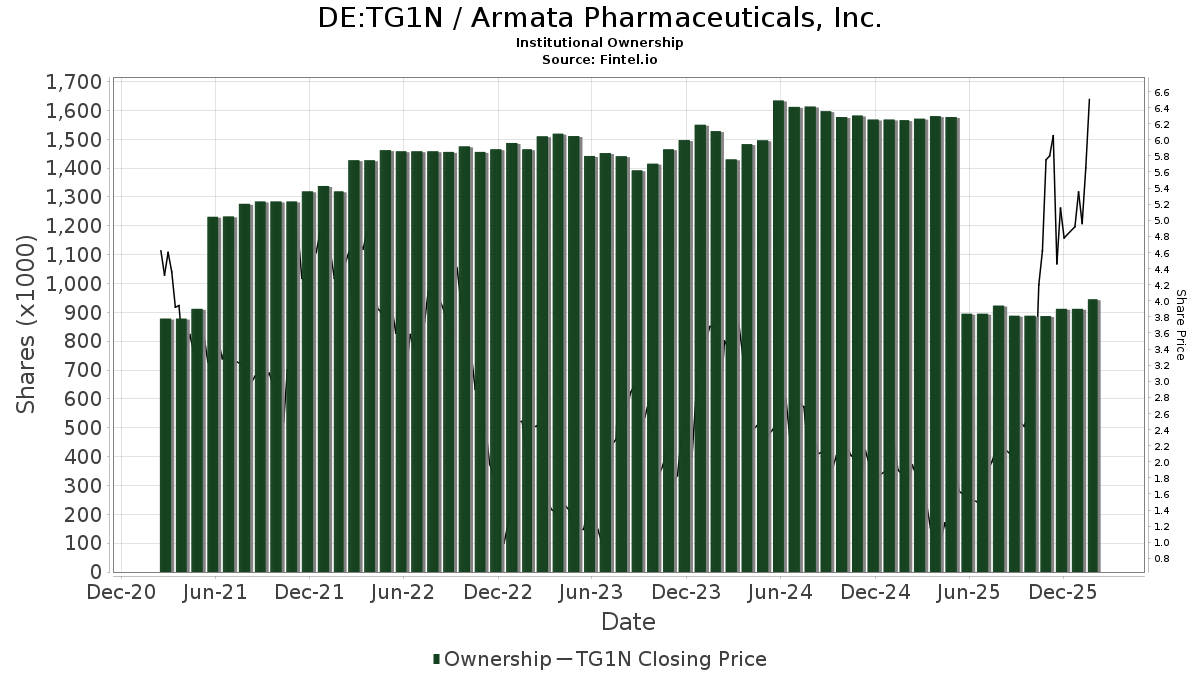
Armata Pharmaceuticals, Inc. (DE:TG1N) har 36 institutionelle ejere og aktionærer, der har indsendt 13D/G- eller 13F-formularer til Securities Exchange Commission (SEC). Disse institutioner har i alt 1,074,315 aktier. Største aktionærer omfatter Vanguard Group Inc, VTSMX - Vanguard Total Stock Market Index Fund Investor Shares, Geode Capital Management, Llc, VEXMX - Vanguard Extended Market Index Fund Investor Shares, Edgewood Management Llc, BlackRock, Inc., Renaissance Technologies Llc, State Street Corp, Goldman Sachs Group Inc, and Bridgeway Capital Management Inc .
Armata Pharmaceuticals, Inc. (DB:TG1N) institutionel ejerskabsstruktur viser aktuelle positioner i virksomheden efter institutioner og fonde, samt seneste ændringer i positionsstørrelse. Større aktionærer kan omfatte individuelle investorer, investeringsforeninger, hedgefonde eller institutioner. Skema 13D angiver, at investoren besidder (eller besidder) mere end 5 % af virksomheden og har til hensigt (eller har til hensigt at) aktivt at forfølge en ændring i forretningsstrategi. Skema 13G indikerer en passiv investering på over 5%.
The share price as of February 13, 2026 is 6,85 / share. Previously, on February 17, 2025, the share price was 1,91 / share. This represents an increase of 258,64% over that period.
Fondens stemningsscore
Fund Sentiment Score (fka Ownership Accumulation Score) finder de aktier, der bliver mest købt af fonde. Det er resultatet af en sofistikeret, multi-faktor kvantitativ model, der identificerer virksomheder med de højeste niveauer af institutionel akkumulering. Scoringsmodellen bruger en kombination af den samlede stigning i oplyste ejere, ændringerne i porteføljeallokeringer i disse ejere og andre målinger. Tallet går fra 0 til 100, hvor højere tal indikerer et højere niveau af akkumulering for sine jævnaldrende, og 50 er gennemsnittet.
Opdateringsfrekvens: Dagligt
Se Ownership Explorer, som giver en liste over højest rangerende virksomheder.
AI+ Ask Fintel’s AI assistant about Armata Pharmaceuticals, Inc..
Select a question to share a public post with an AI-crafted answer.
Thinking of good questions…
13F og NPORT arkivering
Detaljer om 13F-arkivering er gratis. Detaljer om NP-ansøgninger kræver et premium-medlemskab. Grønne rækker angiver nye positioner. Røde rækker angiver lukkede positioner. Klik på linket ikon for at se den fulde transaktionshistorik.
Opgrader
for at låse premium-data op og eksportere til Excel ![]() .
.
| Fil dato | Kilde | Investor | Type | Gennemsnitlig pris (Øst) |
Aktier | Δ Aktier (%) |
Rapporteret Værdi ($1000) |
Δ Værdi (%) |
Port Alloc (%) |
|
|---|---|---|---|---|---|---|---|---|---|---|
| 2026-01-29 | 13F | Vanguard Group Inc | 357.649 | 20,41 | 2.246 | 153,79 | ||||
| 2026-02-13 | 13F | OMERS ADMINISTRATION Corp | 28.125 | 177 | ||||||
| 2026-02-12 | 13F | Jane Street Group, Llc | 17.153 | 108 | ||||||
| 2025-11-14 | 13F | Bridgeway Capital Management Inc | 44.682 | 0,00 | 133 | 58,33 | ||||
| 2025-11-14 | 13F | Tower Research Capital LLC (TRC) | 355 | -79,18 | 1 | -66,67 | ||||
| 2025-11-14 | 13F | Northern Trust Corp | 19.273 | 0,00 | 57 | 58,33 | ||||
| 2026-02-12 | 13F | Renaissance Technologies Llc | 68.496 | 65,87 | 430 | 249,59 | ||||
| 2025-11-19 | 13F | Captrust Financial Advisors | 13.140 | 0,00 | 39 | 62,50 | ||||
| 2025-11-14 | 13F | Two Sigma Securities, Llc | 0 | -100,00 | 0 | |||||
| 2026-01-29 | 13F | UBS Group AG | 1.021 | 2.220,45 | 6 | |||||
| 2026-02-10 | 13F | Goldman Sachs Group Inc | 45.163 | 284 | ||||||
| 2025-11-14 | 13F | Raymond James Financial Inc | 0 | -100,00 | 0 | -100,00 | ||||
| 2025-08-26 | NP | EQ ADVISORS TRUST - 1290 VT Micro Cap Portfolio Class IB | 1.977 | 0,00 | 4 | 50,00 | ||||
| 2026-01-12 | 13F | Seacrest Wealth Management, Llc | 40.988 | 17,26 | 274 | 143,75 | ||||
| 2026-01-26 | 13F | Whittier Trust Co | 100 | 1 | ||||||
| 2026-02-11 | 13F | Group One Trading, L.p. | 0 | -100,00 | 0 | |||||
| 2026-01-13 | 13F | Team Financial Group, LLC | 71 | 0,00 | 0 | |||||
| 2026-02-09 | 13F | Geode Capital Management, Llc | 109.888 | 5,11 | 690 | 121,86 | ||||
| 2026-02-12 | 13F | BlackRock, Inc. | 72.764 | 172,87 | 457 | 477,22 | ||||
| 2026-02-13 | 13F | State Street Corp | 50.800 | 26,05 | 319 | 165,83 | ||||
| 2025-08-27 | NP | VTSMX - Vanguard Total Stock Market Index Fund Investor Shares | 150.088 | 0,00 | 285 | 30,14 | ||||
| 2026-01-28 | 13F | Geneos Wealth Management Inc. | 92 | 1 | ||||||
| 2026-02-13 | 13F | MAI Capital Management | 71 | 0,00 | 0 | |||||
| 2026-01-30 | 13F | Trifecta Capital Advisors, LLC | 714 | 0,00 | 4 | 100,00 | ||||
| 2025-11-26 | 13F/A | Jpmorgan Chase & Co | 24 | 0,00 | 0 | |||||
| 2025-10-15 | 13F | Cwm, Llc | 0 | -100,00 | 0 | |||||
| 2026-02-13 | 13F | Barclays Plc | 0 | -100,00 | 0 | |||||
| 2026-02-03 | 13F/A | Bank Of America Corp /de/ | 7 | -93,20 | 0 | |||||
| 2026-02-05 | 13F | GSB Wealth Management, LLC | 30.000 | 0,00 | 188 | 111,24 | ||||
| 2026-02-12 | 13F | Edgewood Management Llc | 100.000 | 0,00 | 628 | 110,74 | ||||
| 2026-02-10 | 13F/A | Northwestern Mutual Wealth Management Co | 571 | 0,00 | 4 | 200,00 | ||||
| 2025-08-26 | NP | BRSIX - Ultra-Small Company Market Fund Class N | 41.382 | 0,00 | 79 | 30,00 | ||||
| 2026-02-13 | 13F | Wells Fargo & Company/mn | 1 | 0,00 | 0 | |||||
| 2026-02-03 | 13F | SBI Securities Co., Ltd. | 3 | 0,00 | 0 | |||||
| 2025-08-28 | NP | IWC - iShares Micro-Cap ETF | 23.941 | 12,89 | 45 | 50,00 | ||||
| 2026-02-13 | 13F | Morgan Stanley | 2.269 | 113.350,00 | 14 | |||||
| 2026-01-12 | 13F | Salem Investment Counselors Inc | 0 | -100,00 | 0 | |||||
| 2026-02-10 | 13F | Measured Wealth Private Client Group, LLC | 1.000 | 0,00 | 6 | 200,00 | ||||
| 2026-02-10 | 13F | Bnp Paribas Arbitrage, Sa | 710 | 4 | ||||||
| 2025-08-27 | NP | VEXMX - Vanguard Extended Market Index Fund Investor Shares | 106.021 | 0,00 | 201 | 30,52 | ||||
| 2025-11-14 | 13F | Advisor Group Holdings, Inc. | 457 | 0,00 | 1 | |||||
| 2026-01-29 | 13F | Cornerstone National Bank & Trust Co | 1.428 | 0,00 | 9 | 100,00 |
Other Listings
| US:ARMP | 8,15 $ |