Grundlæggende statistik
| Institutionelle ejere | 62 total, 60 long only, 0 short only, 2 long/short - change of 14,81% MRQ |
| Del pris | 9,50 |
| Gennemsnitlig porteføljeallokering | 0.0628 % - change of -47,39% MRQ |
| Institutionelle aktier (lange) | 9.947.921 (ex 13D/G) - change of -2,08MM shares -17,32% MRQ |
| Institutionel værdi (lang) | $ 114.329 USD ($1000) |
Institutionelt ejerskab og aktionærer
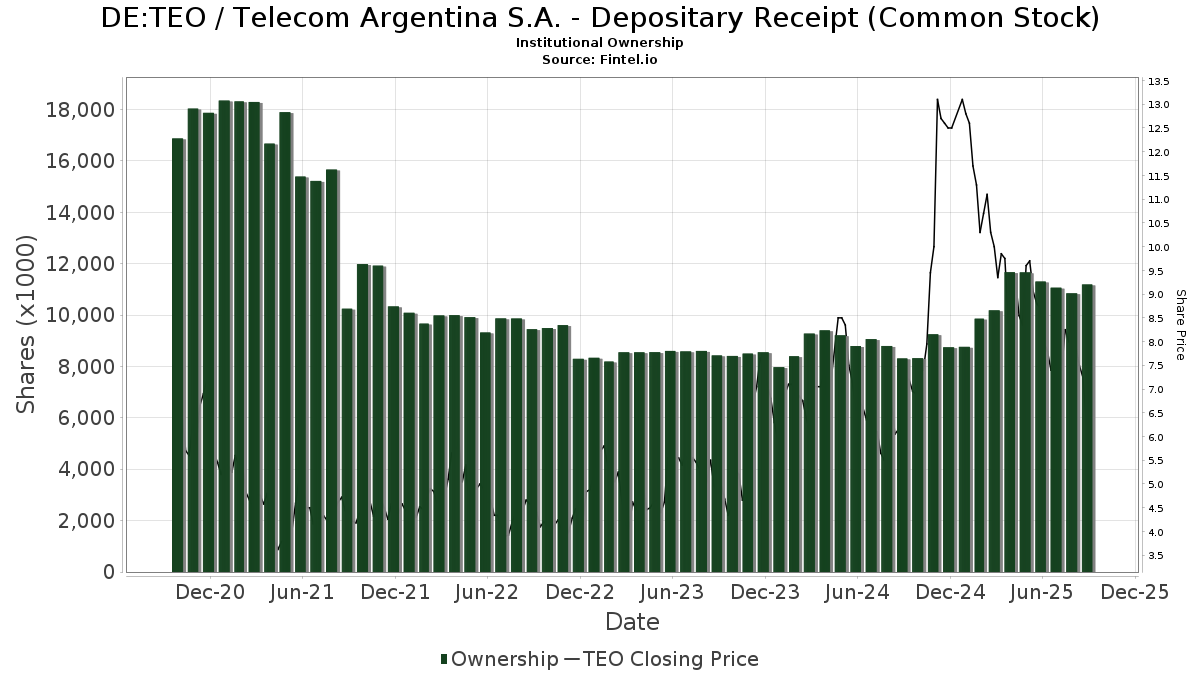
Telecom Argentina S.A. - Depositary Receipt (Common Stock) (DE:TEO) har 62 institutionelle ejere og aktionærer, der har indsendt 13D/G- eller 13F-formularer til Securities Exchange Commission (SEC). Disse institutioner har i alt 9,947,921 aktier. Største aktionærer omfatter Oaktree Capital Management Lp, MIRAE ASSET GLOBAL ETFS HOLDINGS Ltd., RWC Asset Management LLP, Sagil Capital Llp, Morgan Stanley, Discerene Group LP, Fourth Sail Capital LP, Banco BTG Pactual S.A., UBS Group AG, and Wexford Capital Lp .
Telecom Argentina S.A. - Depositary Receipt (Common Stock) (DB:TEO) institutionel ejerskabsstruktur viser aktuelle positioner i virksomheden efter institutioner og fonde, samt seneste ændringer i positionsstørrelse. Større aktionærer kan omfatte individuelle investorer, investeringsforeninger, hedgefonde eller institutioner. Skema 13D angiver, at investoren besidder (eller besidder) mere end 5 % af virksomheden og har til hensigt (eller har til hensigt at) aktivt at forfølge en ændring i forretningsstrategi. Skema 13G indikerer en passiv investering på over 5%.
The share price as of April 24, 2026 is 9,50 / share. Previously, on April 28, 2025, the share price was 8,45 / share. This represents an increase of 12,43% over that period.
Fondens stemningsscore
Fund Sentiment Score (fka Ownership Accumulation Score) finder de aktier, der bliver mest købt af fonde. Det er resultatet af en sofistikeret, multi-faktor kvantitativ model, der identificerer virksomheder med de højeste niveauer af institutionel akkumulering. Scoringsmodellen bruger en kombination af den samlede stigning i oplyste ejere, ændringerne i porteføljeallokeringer i disse ejere og andre målinger. Tallet går fra 0 til 100, hvor højere tal indikerer et højere niveau af akkumulering for sine jævnaldrende, og 50 er gennemsnittet.
Opdateringsfrekvens: Dagligt
Se Ownership Explorer, som giver en liste over højest rangerende virksomheder.
AI+ Ask Fintel’s AI assistant about Telecom Argentina S.A. - Depositary Receipt (Common Stock).
Select a question to share a public post with an AI-crafted answer.
Thinking of good questions…
13F og NPORT arkivering
Detaljer om 13F-arkivering er gratis. Detaljer om NP-ansøgninger kræver et premium-medlemskab. Grønne rækker angiver nye positioner. Røde rækker angiver lukkede positioner. Klik på linket ikon for at se den fulde transaktionshistorik.
Opgrader
for at låse premium-data op og eksportere til Excel ![]() .
.
| Fil dato | Kilde | Investor | Type | Gennemsnitlig pris (Øst) |
Aktier | Δ Aktier (%) |
Rapporteret Værdi ($1000) |
Δ Værdi (%) |
Port Alloc (%) |
|
|---|---|---|---|---|---|---|---|---|---|---|
| 2026-02-14 | 13F | Rockefeller Capital Management L.P. | 175 | 2 | ||||||
| 2026-02-10 | 13F | Bnp Paribas Arbitrage, Sa | 5.303 | -91,97 | 62 | -87,27 | ||||
| 2026-02-13 | 13F | Wexford Capital Lp | 224.078 | 2.602 | ||||||
| 2026-02-12 | 13F | Banco BTG Pactual S.A. | 327.501 | -12,62 | 3.802 | 39,57 | ||||
| 2026-02-10 | 13F | Goldman Sachs Group Inc | 151.425 | 80,34 | 1.758 | 188,20 | ||||
| 2026-02-17 | 13F | D. E. Shaw & Co., Inc. | 161.859 | -4,12 | 1.879 | 53,14 | ||||
| 2026-04-22 | 13F | Pictet Asset Management Holding SA | 48.028 | 561 | ||||||
| 2026-02-17 | 13F | Point72 Asset Management, L.P. | 83.797 | 973 | ||||||
| 2026-02-17 | 13F | State Of Wisconsin Investment Board | 26.013 | -36,57 | 302 | -57,28 | ||||
| 2026-02-11 | 13F | Jpmorgan Chase & Co | 24.245 | 281 | ||||||
| 2026-02-13 | 13F | Y-Intercept (Hong Kong) Ltd | 19.702 | 229 | ||||||
| 2026-02-17 | 13F | Prelude Capital Management, Llc | 10.000 | 116 | ||||||
| 2026-02-13 | 13F | Barclays Plc | 0 | -100,00 | 0 | |||||
| 2026-02-13 | 13F | Dynamic Technology Lab Private Ltd | 18.133 | 211 | ||||||
| 2026-02-11 | 13F | CenterBook Partners LP | 94.481 | 1.097 | ||||||
| 2026-02-19 | 13F | Invesco Ltd. | 40.745 | -0,08 | 473 | 59,80 | ||||
| 2025-11-14 | 13F | Cubist Systematic Strategies, LLC | 71.525 | -15,74 | 520 | -30,71 | ||||
| 2026-02-02 | 13F | Ping Capital Management, Inc. | 20.700 | -45,95 | 240 | -13,67 | ||||
| 2026-02-05 | 13F | Gabelli Funds Llc | 31.000 | 0,00 | 360 | 59,56 | ||||
| 2026-02-13 | 13F | Wells Fargo & Company/mn | 16.288 | 0,00 | 189 | 60,17 | ||||
| 2026-02-13 | 13F | Fourth Sail Capital LP | 453.402 | -72,22 | 5.264 | -55,65 | ||||
| 2026-02-13 | 13F | Morgan Stanley | 576.229 | 257,26 | 6.690 | 470,82 | ||||
| 2026-02-17 | 13F | EFG International AG | 5.000 | 58 | ||||||
| 2026-02-17 | 13F | Tower Research Capital LLC (TRC) | 100 | 1 | ||||||
| 2026-02-13 | 13F | Arrowstreet Capital, Limited Partnership | 0 | -100,00 | 0 | |||||
| 2026-02-17 | 13F | XTX Topco Ltd | 16.270 | 189 | ||||||
| 2025-11-14 | 13F | Royal Bank Of Canada | 0 | -100,00 | 0 | -100,00 | ||||
| 2026-02-17 | 13F | Two Sigma Advisers, Lp | 42.700 | -48,55 | 496 | -17,91 | ||||
| 2026-04-21 | 13F | PharVision Advisers, LLC | 0 | -100,00 | 0 | |||||
| 2026-02-11 | 13F | Group One Trading, L.p. | Put | 19.600 | 96,00 | 228 | 215,28 | |||
| 2026-02-13 | 13F | Discerene Group LP | 487.859 | 0,00 | 5.664 | 59,73 | ||||
| 2026-02-12 | 13F | Sagil Capital Llp | 657.097 | 7.629 | ||||||
| 2026-01-23 | 13F | Assetmark, Inc | 70 | 0,00 | 1 | |||||
| 2026-03-06 | 13F | Hsbc Holdings Plc | 14.729 | 171 | ||||||
| 2026-02-11 | 13F | Group One Trading, L.p. | 1.384 | -54,02 | 16 | -23,81 | ||||
| 2026-02-17 | 13F | Engineers Gate Manager LP | 22.839 | -8,28 | 265 | 46,41 | ||||
| 2025-11-14 | 13F | Raymond James Financial Inc | 0 | -100,00 | 0 | -100,00 | ||||
| 2026-02-13 | 13F | Citigroup Inc | 174 | 2 | ||||||
| 2026-02-17 | 13F | Aquatic Capital Management LLC | 5.282 | 61 | ||||||
| 2026-01-29 | 13F | UBS Group AG | 293.659 | 25,70 | 3.409 | 100,77 | ||||
| 2026-02-17 | 13F | Citadel Advisors Llc | Put | 0 | -100,00 | 0 | ||||
| 2026-02-17 | 13F | Citadel Advisors Llc | 136.675 | -28,38 | 1.587 | 14,35 | ||||
| 2026-02-13 | 13F | Verition Fund Management LLC | 34.520 | -43,49 | 401 | -9,91 | ||||
| 2026-02-13 | 13F | Mariner, LLC | 21.130 | 1,83 | 245 | 63,33 | ||||
| 2026-02-17 | 13F | MIRAE ASSET GLOBAL ETFS HOLDINGS Ltd. | 1.796.458 | -3,59 | 20.857 | 53,96 | ||||
| 2026-02-11 | 13F | RWC Asset Management LLP | 1.009.244 | 50,67 | 11.717 | 140,64 | ||||
| 2025-11-13 | 13F | Acadian Asset Management Llc | 0 | -100,00 | 0 | |||||
| 2026-04-15 | 13F | Activest Wealth Management | 1 | 0,00 | 0 | |||||
| 2026-02-13 | 13F | Stifel Financial Corp | 13.081 | -1,18 | 152 | 57,29 | ||||
| 2026-02-13 | 13F | Sofos Investments, Inc. | 3 | -94,34 | 0 | |||||
| 2026-04-06 | 13F | GAMMA Investing LLC | 2.326 | -12,33 | 27 | -10,00 | ||||
| 2026-02-13 | 13F | Gts Securities Llc | 10.417 | 0,00 | 121 | 60,00 | ||||
| 2026-04-17 | 13F | Verde Servicos Internacionais S.A. | 60.000 | 1 | ||||||
| 2026-02-13 | 13F | Smartleaf Asset Management LLC | 29 | 0 | ||||||
| 2026-02-17 | 13F | Qube Research & Technologies Ltd | 0 | -100,00 | 0 | |||||
| 2026-02-10 | 13F | Monaco Asset Management SAM | 0 | -100,00 | 0 | |||||
| 2026-04-15 | 13F | FNY Investment Advisers, LLC | 0 | -100,00 | 0 | |||||
| 2026-02-17 | 13F | Susquehanna International Group, Llp | Put | 0 | -100,00 | 0 | ||||
| 2026-02-05 | 13F | Allworth Financial LP | 0 | -100,00 | 0 | |||||
| 2026-02-12 | 13F | Jane Street Group, Llc | 62.456 | 725 | ||||||
| 2026-02-03 | 13F | SBI Securities Co., Ltd. | 36 | 0,00 | 0 | |||||
| 2025-11-14 | 13F | Discovery Capital Management, Llc / Ct | 0 | -100,00 | 0 | -100,00 | ||||
| 2026-02-17 | 13F | Bank Of America Corp /de/ | 13.171 | -38,29 | 153 | -1,94 | ||||
| 2026-04-22 | 13F | Stone House Investment Management, LLC | 1 | 0 | ||||||
| 2026-02-13 | 13F | Marshall Wace, Llp | 169.603 | 1.969 | ||||||
| 2026-02-17 | 13F | Oaktree Capital Management Lp | 2.347.508 | -10,72 | 27.255 | 42,57 | ||||
| 2026-02-17 | 13F | Advisor Group Holdings, Inc. | 450 | 0,00 | 5 | 66,67 | ||||
| 2026-02-17 | 13F | Jump Financial, LLC | 0 | -100,00 | 0 | |||||
| 2026-02-17 | 13F | Susquehanna International Group, Llp | Call | 19.800 | 62,30 | 230 | 160,23 | |||
| 2026-02-11 | 13F | Simplex Trading, Llc | Put | 100 | -66,67 | 1 | ||||
| 2026-02-13 | 13F | Van Eck Associates Corp | 11.982 | 102,98 | 0 | |||||
| 2026-02-17 | 13F | Mirabella Financial Services Llp | 62.201 | 722 | ||||||
| 2026-02-12 | 13F | CIBC Private Wealth Group, LLC | 1.614 | 0,00 | 19 | 63,64 | ||||
| 2026-02-17 | 13F | Two Sigma Investments, Lp | 116.495 | -42,94 | 1.353 | -8,89 | ||||
| 2026-02-17 | 13F | Millennium Management Llc | 125.593 | 160,80 | 1.458 | 316,57 | ||||
| 2026-02-11 | 13F | Simplex Trading, Llc | 152 | -52,50 | 2 | |||||
| 2026-02-11 | 13F | Simplex Trading, Llc | Call | 300 | 3 | |||||
| 2026-02-06 | 13F | EverSource Wealth Advisors, LLC | 966 | -4,92 | 11 | 57,14 | ||||
| 2026-04-20 | 13F | Ronald Blue Trust, Inc. | 17 | 0 |
Other Listings
| US:TEO | 11,33 $ |