Grundlæggende statistik
| Institutionelle aktier (lange) | 15.820.568 - 76,18% (ex 13D/G) - change of -3,66MM shares -18,80% MRQ |
| Institutionel værdi (lang) | $ 355.873 USD ($1000) |
Institutionelt ejerskab og aktionærer
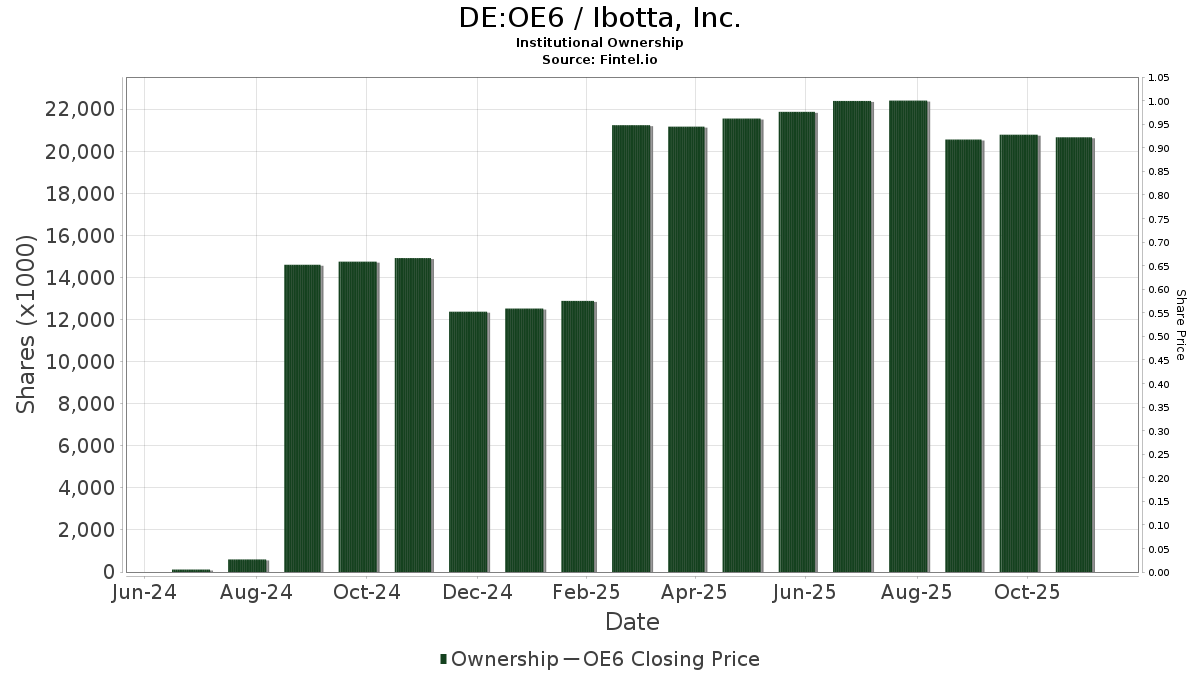
Ibotta, Inc. (DE:OE6) har 122 institutionelle ejere og aktionærer, der har indsendt 13D/G- eller 13F-formularer til Securities Exchange Commission (SEC). Disse institutioner har i alt 15,820,568 aktier. Største aktionærer omfatter Koch, Inc., D. E. Shaw & Co., Inc., Vanguard Group Inc, BlackRock, Inc., Hsbc Holdings Plc, Citigroup Inc, Sumitomo Mitsui Trust Holdings, Inc., Deutsche Bank Ag\, Notable Capital Management, L.l.c., and Nikko Asset Management Americas, Inc. .
Ibotta, Inc. (DB:OE6) institutionel ejerskabsstruktur viser aktuelle positioner i virksomheden efter institutioner og fonde, samt seneste ændringer i positionsstørrelse. Større aktionærer kan omfatte individuelle investorer, investeringsforeninger, hedgefonde eller institutioner. Skema 13D angiver, at investoren besidder (eller besidder) mere end 5 % af virksomheden og har til hensigt (eller har til hensigt at) aktivt at forfølge en ændring i forretningsstrategi. Skema 13G indikerer en passiv investering på over 5%.
The share price as of April 24, 2026 is 30,40 / share. Previously, on April 28, 2025, the share price was 41,80 / share. This represents a decline of 27,27% over that period.
Fondens stemningsscore
Fund Sentiment Score (fka Ownership Accumulation Score) finder de aktier, der bliver mest købt af fonde. Det er resultatet af en sofistikeret, multi-faktor kvantitativ model, der identificerer virksomheder med de højeste niveauer af institutionel akkumulering. Scoringsmodellen bruger en kombination af den samlede stigning i oplyste ejere, ændringerne i porteføljeallokeringer i disse ejere og andre målinger. Tallet går fra 0 til 100, hvor højere tal indikerer et højere niveau af akkumulering for sine jævnaldrende, og 50 er gennemsnittet.
Opdateringsfrekvens: Dagligt
Se Ownership Explorer, som giver en liste over højest rangerende virksomheder.
AI+ Ask Fintel’s AI assistant about Ibotta, Inc..
Select a question to share a public post with an AI-crafted answer.
Thinking of good questions…
13F og NPORT arkivering
Detaljer om 13F-arkivering er gratis. Detaljer om NP-ansøgninger kræver et premium-medlemskab. Grønne rækker angiver nye positioner. Røde rækker angiver lukkede positioner. Klik på linket ikon for at se den fulde transaktionshistorik.
Opgrader
for at låse premium-data op og eksportere til Excel ![]() .
.
| Fil dato | Kilde | Investor | Type | Gennemsnitlig pris (Øst) |
Aktier | Δ Aktier (%) |
Rapporteret Værdi ($1000) |
Δ Værdi (%) |
Port Alloc (%) |
|
|---|---|---|---|---|---|---|---|---|---|---|
| 2025-11-14 | 13F | Point72 (DIFC) Ltd | 0 | -100,00 | 0 | -100,00 | ||||
| 2026-04-08 | 13F | Fermata Advisors, LLC | 10.412 | 0,02 | 312 | 32,20 | ||||
| 2026-02-02 | 13F | Wilkins Investment Counsel Inc | 0 | -100,00 | 0 | -100,00 | ||||
| 2026-02-12 | 13F | Jane Street Group, Llc | 224.529 | 1.898,30 | 5.104 | 1.535,58 | ||||
| 2026-02-11 | 13F | Primecap Management Co/ca/ | 87.635 | -41,64 | 1.992 | -52,39 | ||||
| 2026-02-17 | 13F | Brevan Howard Capital Management LP | 0 | -100,00 | 0 | -100,00 | ||||
| 2025-11-12 | 13F | American Century Companies Inc | 0 | -100,00 | 0 | -100,00 | ||||
| 2026-01-12 | 13F | CVA Family Office, LLC | 1 | 0,00 | 0 | |||||
| 2026-02-13 | 13F | State Street Corp | 305.137 | -1,08 | 6.936 | -19,27 | ||||
| 2026-02-17 | 13F | D. E. Shaw & Co., Inc. | 1.690.546 | 30,99 | 38.426 | 6,91 | ||||
| 2026-02-26 | 13F/A | Aristides Capital LLC | 9.700 | 220 | ||||||
| 2026-02-13 | 13F | Barclays Plc | 32.028 | 60,27 | 728 | 30,76 | ||||
| 2026-02-17 | 13F | Quadrature Capital Ltd | 0 | -100,00 | 0 | -100,00 | ||||
| 2026-02-10 | 13F/A | Northwestern Mutual Wealth Management Co | 150 | 0,00 | 3 | -25,00 | ||||
| 2026-02-17 | 13F | Susquehanna International Group, Llp | Put | 0 | -100,00 | 0 | -100,00 | |||
| 2026-02-10 | 13F | Bnp Paribas Arbitrage, Sa | 325.046 | -20,32 | 7.388 | -34,97 | ||||
| 2026-02-09 | 13F | Legal & General Group Plc | 13.416 | -0,33 | 305 | -18,72 | ||||
| 2026-02-17 | 13F | XTX Topco Ltd | 84.322 | 1.917 | ||||||
| 2026-04-13 | 13F | IFP Advisors, Inc | 5 | 25,00 | 0 | |||||
| 2025-11-14 | 13F | Quarry LP | 0 | -100,00 | 0 | |||||
| 2026-02-12 | 13F | Voya Investment Management Llc | 0 | -100,00 | 0 | -100,00 | ||||
| 2026-02-06 | 13F | FourThought Financial Partners, LLC | 23.134 | 526 | ||||||
| 2026-02-13 | 13F | Police & Firemen's Retirement System of New Jersey | 3.954 | 0,00 | 90 | -19,09 | ||||
| 2026-02-11 | 13F | Winton Capital Group Ltd | 10.440 | 237 | ||||||
| 2025-11-17 | 13F | PDT Partners, LLC | 0 | -100,00 | 0 | -100,00 | ||||
| 2026-02-11 | 13F | Nikko Asset Management Americas, Inc. | 341.265 | -73,33 | 7.740 | -78,26 | ||||
| 2026-02-11 | 13F | Los Angeles Capital Management Llc | 58 | 2 | ||||||
| 2026-02-17 | 13F | Susquehanna International Group, Llp | Call | 23.100 | -43,24 | 525 | -53,66 | |||
| 2026-02-17 | 13F | Aster Capital Management (DIFC) Ltd | 0 | -100,00 | 0 | |||||
| 2026-02-17 | 13F | Price T Rowe Associates Inc /md/ | 44.967 | 3,95 | 1 | 0,00 | ||||
| 2026-01-28 | 13F | Klp Kapitalforvaltning As | 12.400 | 4,20 | 282 | -15,11 | ||||
| 2026-01-27 | 13F | Zurcher Kantonalbank (Zurich Cantonalbank) | 6.800 | 0,00 | 155 | -18,52 | ||||
| 2026-02-13 | 13F | Marshall Wace, Llp | 68.383 | 1.554 | ||||||
| 2026-02-11 | 13F | Fox Run Management, L.l.c. | 10.007 | 227 | ||||||
| 2026-02-17 | 13F | Balyasny Asset Management Llc | 48.775 | 1.109 | ||||||
| 2026-02-17 | 13F | Royal Bank Of Canada | 1.950 | -92,21 | 44 | -93,69 | ||||
| 2025-11-14 | 13F | Southpoint Capital Advisors LP | 0 | -100,00 | 0 | |||||
| 2026-04-16 | 13F | SG Americas Securities, LLC | 0 | -100,00 | 0 | |||||
| 2025-11-14 | 13F | Aigen Investment Management, Lp | 0 | -100,00 | 0 | |||||
| 2025-11-14 | 13F | Walleye Trading LLC | Call | 0 | -100,00 | 0 | ||||
| 2026-02-13 | 13F | Squarepoint Ops LLC | 0 | -100,00 | 0 | |||||
| 2025-11-14 | 13F | Walleye Trading LLC | Put | 0 | -100,00 | 0 | ||||
| 2026-04-15 | 13F | Fortitude Family Office, LLC | 0 | -100,00 | 0 | |||||
| 2026-02-17 | 13F | Voleon Capital Management Lp | 38.231 | 1,94 | 869 | -16,86 | ||||
| 2026-02-17 | 13F | Optiver Holding B.V. | 92 | 0,00 | 2 | 0,00 | ||||
| 2025-11-14 | 13F | Walleye Trading LLC | 0 | -100,00 | 0 | |||||
| 2026-02-09 | 13F | Hartland & Co., LLC | 0 | -100,00 | 0 | |||||
| 2026-02-13 | 13F | BNP Paribas Asset Management Holding S.A. | 247 | 7,39 | 0 | |||||
| 2026-04-24 | 13F | Strs Ohio | 10.600 | -51,38 | 318 | -35,96 | ||||
| 2026-01-29 | 13F | Vanguard Group Inc | 1.164.995 | -25,84 | 26.480 | -39,47 | ||||
| 2026-02-13 | 13F | Ubs Asset Management Americas Inc | 17.769 | 5,05 | 404 | -14,44 | ||||
| 2026-02-12 | 13F | Penserra Capital Management LLC | 28.118 | -15,33 | 1 | |||||
| 2025-11-14 | 13F | Twinbeech Capital Lp | 0 | -100,00 | 0 | |||||
| 2026-04-06 | 13F | GAMMA Investing LLC | 189 | 278,00 | 6 | 400,00 | ||||
| 2026-04-21 | 13F | Nemes Rush Group LLC | 8.001 | 0,00 | 240 | 32,04 | ||||
| 2026-04-20 | 13F | Ronald Blue Trust, Inc. | 336 | 0,00 | 10 | 42,86 | ||||
| 2026-02-13 | 13F | SRS Capital Advisors, Inc. | 185 | 1.750,00 | 4 | |||||
| 2025-11-13 | 13F | Norges Bank | 0 | -100,00 | 0 | -100,00 | ||||
| 2026-02-17 | 13F | Canada Pension Plan Investment Board | 10.200 | 232 | ||||||
| 2025-11-14 | 13F | Two Sigma Investments, Lp | 0 | -100,00 | 0 | -100,00 | ||||
| 2026-02-17 | 13F | Millennium Management Llc | 86.921 | 1.976 | ||||||
| 2026-02-12 | 13F | Aviva Plc | 0 | -100,00 | 0 | -100,00 | ||||
| 2026-02-10 | 13F | Acadian Asset Management Llc | 1.076 | -84,26 | 0 | |||||
| 2026-02-12 | 13F | Renaissance Technologies Llc | 203.308 | 37,56 | 4.621 | 12,27 | ||||
| 2025-11-14 | 13F | Manufacturers Life Insurance Company, The | 0 | -100,00 | 0 | |||||
| 2026-02-13 | 13F | Verition Fund Management LLC | 16.300 | -12,12 | 370 | -28,29 | ||||
| 2026-02-17 | 13F | Tower Research Capital LLC (TRC) | 786 | 4,52 | 18 | -15,00 | ||||
| 2026-02-06 | 13F | Covestor Ltd | 333 | 33.200,00 | 0 | |||||
| 2026-02-17 | 13F | Aqr Capital Management Llc | 0 | -100,00 | 0 | |||||
| 2025-11-14 | 13F | Virtu Financial LLC | 0 | -100,00 | 0 | |||||
| 2026-02-17 | 13F | Bank Of America Corp /de/ | 202.944 | 261,47 | 4.613 | 195,07 | ||||
| 2026-02-11 | 13F | Parallel Advisors, LLC | 3.861 | -0,03 | 88 | -18,69 | ||||
| 2026-02-11 | 13F | Simplex Trading, Llc | 2.109 | -8,46 | 48 | |||||
| 2025-11-03 | 13F | EFG Asset Management (North America) Corp. | 0 | -100,00 | 0 | -100,00 | ||||
| 2026-01-30 | 13F | Us Bancorp \de\ | 17 | -92,31 | 0 | -100,00 | ||||
| 2026-02-13 | 13F | Golden State Wealth Management, LLC | 51 | 0,00 | 1 | 0,00 | ||||
| 2026-01-23 | 13F | Sumitomo Mitsui Trust Holdings, Inc. | 389.463 | -69,60 | 8.852 | -75,19 | ||||
| 2026-02-09 | 13F | Quest Partners LLC | 3.723 | 85 | ||||||
| 2026-01-29 | 13F | UBS Group AG | 148.420 | -34,88 | 3.374 | -46,86 | ||||
| 2026-02-13 | 13F | Umb Bank N A/mo | 109 | 2 | ||||||
| 2026-02-17 | 13F | Advisor Group Holdings, Inc. | 1.406 | -9,81 | 32 | -27,91 | ||||
| 2026-04-14 | 13F | Nbc Securities, Inc. | 10 | 0,00 | 0 | |||||
| 2026-02-17 | 13F | Northern Trust Corp | 141.345 | -8,03 | 3.213 | -24,94 | ||||
| 2026-02-10 | 13F | Private Wealth Asset Management, LLC | 1.000 | 0,00 | 23 | -18,52 | ||||
| 2026-04-13 | 13F | True Wealth Design, LLC | 24 | 1 | ||||||
| 2026-02-09 | 13F | Geode Capital Management, Llc | 327.479 | 0,92 | 7.445 | -17,64 | ||||
| 2026-02-12 | 13F | Swiss National Bank | 29.900 | 10,74 | 680 | -9,59 | ||||
| 2025-11-14 | 13F | J. Goldman & Co LP | 0 | -100,00 | 0 | |||||
| 2026-02-12 | 13F | Dimensional Fund Advisors Lp | 9.809 | 4,77 | 223 | -14,62 | ||||
| 2025-11-13 | 13F | Dynamic Technology Lab Private Ltd | 0 | -100,00 | 0 | |||||
| 2026-02-17 | 13F | Russell Investments Group, Ltd. | 13.482 | 24,95 | 306 | 2,00 | ||||
| 2026-03-03 | 13F/A | Caitong International Asset Management Co., Ltd | 2.754 | 335,76 | 63 | 264,71 | ||||
| 2025-11-14 | 13F | Wolverine Trading, Llc | Put | 8.500 | 30,77 | 238 | -0,83 | |||
| 2026-02-05 | 13F | Amalgamated Bank | 439 | -18,85 | 0 | |||||
| 2026-02-12 | 13F | Skopos Labs, Inc. | 73.365 | 1.649 | ||||||
| 2026-02-11 | 13F | ARK Investment Management LLC | 0 | -100,00 | 0 | -100,00 | ||||
| 2026-02-19 | 13F | Invesco Ltd. | 8.892 | 21,62 | 202 | -0,49 | ||||
| 2026-02-10 | 13F | Goldman Sachs Group Inc | 175.612 | -61,55 | 3.992 | -68,62 | ||||
| 2026-02-13 | 13F | Jacobs Levy Equity Management, Inc | 189.954 | 236,99 | 4.318 | 175,14 | ||||
| 2026-02-11 | 13F | Koch, Inc. | 4.389.129 | 0,00 | 99.765 | -18,38 | ||||
| 2026-04-20 | 13F | State of Alaska, Department of Revenue | 815 | 0,00 | 0 | |||||
| 2026-02-10 | 13F | Rothschild Investment Llc | 30 | 1 | ||||||
| 2025-11-14 | 13F | Wolverine Trading, Llc | Call | 22.600 | 162,79 | 634 | 99,68 | |||
| 2026-02-03 | 13F | SBI Securities Co., Ltd. | 116 | 0,00 | 3 | -33,33 | ||||
| 2026-02-13 | 13F | Invictus Private Wealth, Llc | 0 | -100,00 | 0 | |||||
| 2025-11-13 | 13F | Magnetar Financial LLC | 0 | -100,00 | 0 | -100,00 | ||||
| 2026-04-07 | 13F | Farther Finance Advisors, LLC | 35 | -98,54 | 1 | -98,15 | ||||
| 2025-11-14 | 13F | Janus Henderson Group Plc | 0 | -100,00 | 0 | |||||
| 2025-11-14 | 13F | Man Group plc | 0 | -100,00 | 0 | |||||
| 2026-02-17 | 13F | California State Teachers Retirement System | 15.183 | 17,87 | 345 | -3,63 | ||||
| 2026-03-06 | 13F | Hsbc Holdings Plc | 993.977 | 29,43 | 22.210 | 3,66 | ||||
| 2025-11-14 | 13F | Walleye Capital LLC | 0 | -100,00 | 0 | |||||
| 2025-11-14 | 13F | Jain Global LLC | 0 | -100,00 | 0 | |||||
| 2026-02-11 | 13F | Group One Trading, L.p. | 1.088 | -35,55 | 25 | -48,94 | ||||
| 2026-02-13 | 13F | Notable Capital Management, L.l.c. | 367.032 | 0,00 | 8.343 | -18,38 | ||||
| 2026-02-17 | 13F | Susquehanna Portfolio Strategies, LLC | 22.751 | -74,33 | 517 | -79,05 | ||||
| 2025-11-14 | 13F | Walleye Capital LLC | Put | 0 | -100,00 | 0 | ||||
| 2026-02-17 | 13F | Alliancebernstein L.p. | 12.050 | 0,00 | 274 | -18,51 | ||||
| 2026-02-06 | 13F | Pnc Financial Services Group, Inc. | 0 | -100,00 | 0 | |||||
| 2026-02-06 | 13F | EverSource Wealth Advisors, LLC | 3 | -96,39 | 0 | -100,00 | ||||
| 2026-02-13 | 13F | Y-Intercept (Hong Kong) Ltd | 0 | -100,00 | 0 | |||||
| 2026-04-22 | 13F | Stone House Investment Management, LLC | 15 | 0 | ||||||
| 2026-02-13 | 13F | Morgan Stanley | 227.070 | -30,47 | 5.161 | -43,25 | ||||
| 2026-02-05 | 13F | Allworth Financial LP | 38 | 533,33 | 1 | |||||
| 2026-02-17 | 13F | Advisory Services Network, LLC | 0 | -100,00 | 0 | -100,00 | ||||
| 2026-02-13 | 13F | Victory Capital Management Inc | 0 | -100,00 | 0 | |||||
| 2025-11-14 | 13F | Susquehanna International Group, Llp | 0 | -100,00 | 0 | -100,00 | ||||
| 2026-02-12 | 13F | Federated Hermes, Inc. | 483 | -36,78 | 11 | -52,38 | ||||
| 2026-04-15 | 13F | Norden Group Llc | 7.730 | 232 | ||||||
| 2026-02-06 | 13F | Tortoise Investment Management, LLC | 0 | -100,00 | 0 | |||||
| 2026-02-12 | 13F | New York State Common Retirement Fund | 4.900 | 0,00 | 111 | -18,38 | ||||
| 2026-02-13 | 13F | Rhumbline Advisers | 16.857 | -12,46 | 383 | -28,54 | ||||
| 2026-02-17 | 13F | Citadel Advisors Llc | Put | 12.900 | -68,07 | 293 | -73,96 | |||
| 2026-02-17 | 13F | Citadel Advisors Llc | Call | 15.100 | -29,11 | 343 | -42,16 | |||
| 2026-02-12 | 13F | BlackRock, Inc. | 1.051.720 | 1,58 | 23.906 | -17,10 | ||||
| 2026-02-17 | 13F | Citadel Advisors Llc | 148.257 | -9,90 | 3.370 | -26,47 | ||||
| 2026-02-17 | 13F | Quantinno Capital Management LP | 26.448 | 601 | ||||||
| 2026-02-11 | 13F | Jpmorgan Chase & Co | 74.765 | -86,93 | 1.699 | -89,34 | ||||
| 2026-02-11 | 13F | Deutsche Bank Ag\ | 369.890 | 3.449,81 | 8.408 | 2.798,97 | ||||
| 2026-02-17 | 13F | Numerai GP LLC | 0 | -100,00 | 0 | |||||
| 2026-02-17 | 13F | VARCOV Co. | 19.305 | 439 | ||||||
| 2026-02-13 | 13F | Smartleaf Asset Management LLC | 3 | 0 | ||||||
| 2025-11-12 | 13F | Intech Investment Management Llc | 0 | -100,00 | 0 | -100,00 | ||||
| 2026-02-10 | 13F | Quantbot Technologies LP | 0 | -100,00 | 0 | |||||
| 2025-11-14 | 13F | Engineers Gate Manager LP | 0 | -100,00 | 0 | -100,00 | ||||
| 2026-02-13 | 13F | Charles Schwab Investment Management Inc | 119.625 | 14,77 | 2.719 | -6,31 | ||||
| 2026-01-29 | 13F | Saybrook Capital /nc | 60.258 | 0,00 | 1.370 | -18,41 | ||||
| 2025-11-14 | 13F | Point72 Asset Management, L.P. | 0 | -100,00 | 0 | -100,00 | ||||
| 2026-02-10 | 13F | Baker Avenue Asset Management, LP | 12.750 | 0,00 | 290 | -18,59 | ||||
| 2025-11-12 | 13F | Edgestream Partners, L.P. | 0 | -100,00 | 0 | |||||
| 2026-02-12 | 13F | Jane Street Group, Llc | Call | 0 | -100,00 | 0 | -100,00 | |||
| 2026-02-10 | 13F | Bank of New York Mellon Corp | 63.209 | 56,73 | 1.437 | 27,87 | ||||
| 2026-02-12 | 13F | EntryPoint Capital, LLC | 0 | -100,00 | 0 | -100,00 | ||||
| 2026-02-17 | 13F | United Capital Financial Advisers, Llc | 44.548 | 0,00 | 1.013 | -18,39 | ||||
| 2026-02-12 | 13F | MetLife Investment Management, LLC | 9.340 | 0,00 | 212 | -18,46 | ||||
| 2026-01-13 | 13F | ForthRight Wealth Management, LLC | 30.296 | 0,00 | 689 | -18,39 | ||||
| 2026-01-20 | 13F | Harbor Capital Advisors, Inc. | 84 | -1,18 | 0 | |||||
| 2026-02-17 | 13F | Jones Financial Companies Lllp | 61 | 0,00 | 1 | 0,00 | ||||
| 2026-04-23 | 13F | SJS Investment Consulting Inc. | 21 | 16,67 | 1 | |||||
| 2026-02-13 | 13F | Wells Fargo & Company/mn | 18.038 | 59,02 | 410 | 30,16 | ||||
| 2026-04-10 | 13F | Abound Wealth Management | 604 | 0,00 | 18 | 38,46 | ||||
| 2026-04-22 | 13F | Sterling Capital Management LLC | 72 | -20,88 | 2 | 0,00 | ||||
| 2026-01-26 | 13F | Cwm, Llc | 1.328 | -6,61 | 0 | |||||
| 2026-02-11 | 13F | Franklin Resources Inc | 22.733 | 213,47 | 517 | 156,72 | ||||
| 2026-02-10 | 13F | Axq Capital, Lp | 0 | -100,00 | 0 | |||||
| 2026-04-06 | 13F | Versant Capital Management, Inc | 472 | -40,70 | 14 | -22,22 | ||||
| 2026-02-11 | 13F | Ameritas Investment Partners, Inc. | 1.332 | 0,00 | 30 | -18,92 | ||||
| 2026-02-12 | 13F | Counterpoint Mutual Funds LLC | 25.842 | 587 | ||||||
| 2026-02-06 | 13F | Nano Cap New Millennium Growth Fund L P | 10.000 | 227 | ||||||
| 2026-02-17 | 13F | MIRAE ASSET GLOBAL ETFS HOLDINGS Ltd. | 6.460 | -0,43 | 147 | -18,89 | ||||
| 2025-11-14 | 13F | Cubist Systematic Strategies, LLC | 0 | -100,00 | 0 | -100,00 | ||||
| 2026-02-12 | 13F | Nuveen, LLC | 57.206 | 4,52 | 1.300 | -14,70 | ||||
| 2026-02-17 | 13F | Fmr Llc | 804 | 103,54 | 18 | 63,64 | ||||
| 2026-01-15 | 13F | Nisa Investment Advisors, Llc | 0 | -100,00 | 0 | |||||
| 2026-02-12 | 13F | Hrt Financial Lp | 78.065 | 2 | ||||||
| 2026-02-13 | 13F | Citigroup Inc | 644.552 | 0,50 | 14.651 | -17,98 | ||||
| 2025-11-14 | 13F | Two Sigma Advisers, Lp | 0 | -100,00 | 0 | -100,00 | ||||
| 2025-11-14 | 13F | Raymond James Financial Inc | 0 | -100,00 | 0 | |||||
| 2026-04-07 | 13F | Signaturefd, Llc | 39 | 25,81 | 1 | |||||
| 2026-02-06 | 13F | Larson Financial Group LLC | 172 | 4.200,00 | 4 | |||||
| 2026-02-17 | 13F | Ameriprise Financial Inc | 194.052 | 1,80 | 4.411 | -16,92 |
Other Listings
| US:IBTA | 34,97 $ |