Grundlæggende statistik
| Institutionelle aktier (lange) | 39.834.006 - 62,67% (ex 13D/G) - change of -7,67MM shares -16,15% MRQ |
| Institutionel værdi (lang) | $ 71.304 USD ($1000) |
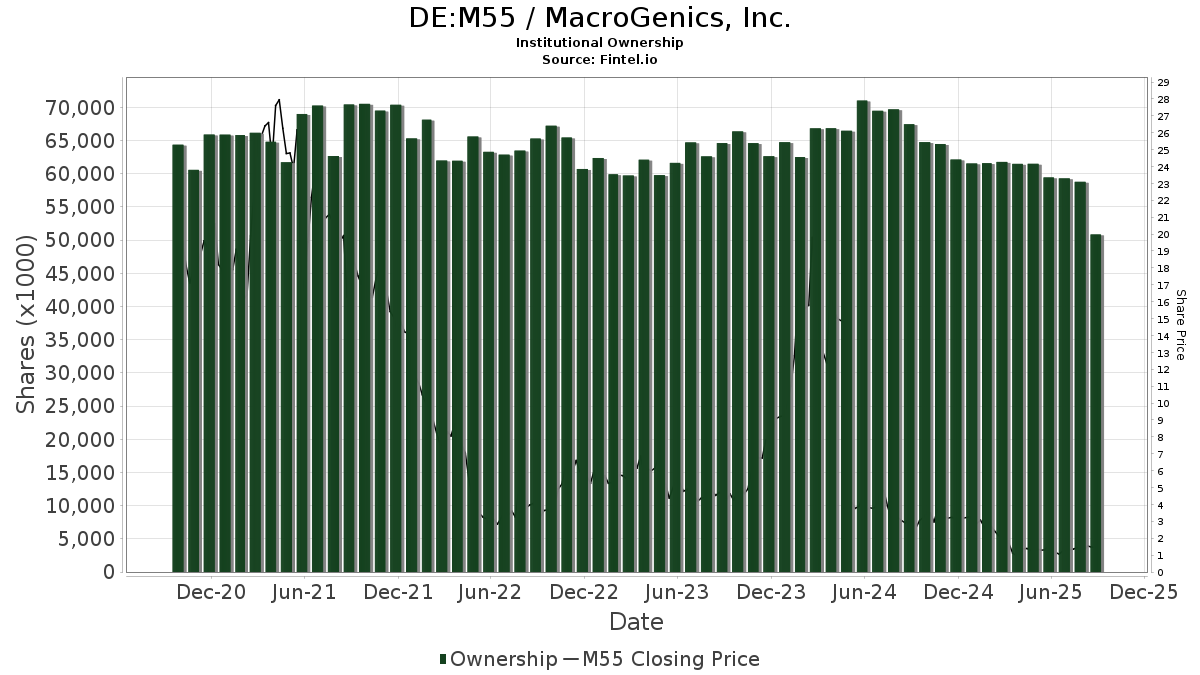
Institutionelt ejerskab og aktionærer
MacroGenics, Inc. (DE:M55) har 95 institutionelle ejere og aktionærer, der har indsendt 13D/G- eller 13F-formularer til Securities Exchange Commission (SEC). Disse institutioner har i alt 39,834,006 aktier. Største aktionærer omfatter Armistice Capital, Llc, Vanguard Group Inc, Renaissance Technologies Llc, Acadian Asset Management Llc, Millennium Management Llc, Jefferies Financial Group Inc., Bank Of America Corp /de/, Wasatch Advisors Inc, Marshall Wace, Llp, and Jane Street Group, Llc .
MacroGenics, Inc. (DB:M55) institutionel ejerskabsstruktur viser aktuelle positioner i virksomheden efter institutioner og fonde, samt seneste ændringer i positionsstørrelse. Større aktionærer kan omfatte individuelle investorer, investeringsforeninger, hedgefonde eller institutioner. Skema 13D angiver, at investoren besidder (eller besidder) mere end 5 % af virksomheden og har til hensigt (eller har til hensigt at) aktivt at forfølge en ændring i forretningsstrategi. Skema 13G indikerer en passiv investering på over 5%.
The share price as of April 30, 2026 is 2,50 / share. Previously, on May 5, 2025, the share price was 1,48 / share. This represents an increase of 68,46% over that period.
Fondens stemningsscore
Fund Sentiment Score (fka Ownership Accumulation Score) finder de aktier, der bliver mest købt af fonde. Det er resultatet af en sofistikeret, multi-faktor kvantitativ model, der identificerer virksomheder med de højeste niveauer af institutionel akkumulering. Scoringsmodellen bruger en kombination af den samlede stigning i oplyste ejere, ændringerne i porteføljeallokeringer i disse ejere og andre målinger. Tallet går fra 0 til 100, hvor højere tal indikerer et højere niveau af akkumulering for sine jævnaldrende, og 50 er gennemsnittet.
Opdateringsfrekvens: Dagligt
Se Ownership Explorer, som giver en liste over højest rangerende virksomheder.
AI+ Ask Fintel’s AI assistant about MacroGenics, Inc..
Select a question to share a public post with an AI-crafted answer.
Thinking of good questions…
13F og NPORT arkivering
Detaljer om 13F-arkivering er gratis. Detaljer om NP-ansøgninger kræver et premium-medlemskab. Grønne rækker angiver nye positioner. Røde rækker angiver lukkede positioner. Klik på linket ikon for at se den fulde transaktionshistorik.
Opgrader
for at låse premium-data op og eksportere til Excel ![]() .
.
| Fil dato | Kilde | Investor | Type | Gennemsnitlig pris (Øst) |
Aktier | Δ Aktier (%) |
Rapporteret Værdi ($1000) |
Δ Værdi (%) |
Port Alloc (%) |
|
|---|---|---|---|---|---|---|---|---|---|---|
| 2026-02-17 | 13F | Ameriprise Financial Inc | 92.853 | -2,54 | 149 | -6,87 | ||||
| 2026-02-17 | 13F | Optiver Holding B.V. | 0 | -100,00 | 0 | |||||
| 2025-11-14 | 13F | Raymond James Financial Inc | 0 | -100,00 | 0 | |||||
| 2026-02-17 | 13F | Qube Research & Technologies Ltd | 0 | -100,00 | 0 | |||||
| 2026-04-27 | 13F | Sound Income Strategies, LLC | 7.262 | 0,00 | 21 | 75,00 | ||||
| 2026-02-13 | 13F | Morgan Stanley | 161.016 | -83,72 | 259 | -84,41 | ||||
| 2026-03-31 | 13F/A | Barclays Plc | Call | 0 | -100,00 | 0 | -100,00 | |||
| 2026-02-13 | 13F | JustInvest LLC | 12.780 | 20,81 | 21 | 17,65 | ||||
| 2026-02-17 | 13F | Susquehanna International Group, Llp | Put | 13.200 | -80,18 | 21 | -81,08 | |||
| 2026-02-13 | 13F | Frazier Life Sciences Management, L.P. | 0 | -100,00 | 0 | |||||
| 2026-02-17 | 13F | Susquehanna International Group, Llp | 68.541 | -69,37 | 110 | -70,67 | ||||
| 2026-02-17 | 13F | Two Sigma Investments, Lp | 999.474 | 128,66 | 1.609 | 119,21 | ||||
| 2026-01-29 | 13F | Vanguard Group Inc | 4.226.941 | 0,06 | 6.805 | -4,10 | ||||
| 2026-02-05 | 13F | HighMark Wealth Management LLC | 400 | 0,00 | 1 | |||||
| 2026-02-13 | 13F | Panagora Asset Management Inc | 150.061 | 145,20 | 242 | 136,27 | ||||
| 2026-02-13 | 13F | Caitong International Asset Management Co., Ltd | 0 | -100,00 | 0 | |||||
| 2026-04-23 | 13F | Farmers & Merchants Investments Inc | 80 | 0,00 | 0 | |||||
| 2026-02-17 | 13F | Public Employees Retirement System Of Ohio | 42.382 | 0,00 | 68 | -4,23 | ||||
| 2026-04-23 | 13F | CWM Advisors, LLC | 18 | 28,57 | 0 | |||||
| 2026-02-05 | 13F | AlphaCore Capital LLC | 38.073 | 61 | ||||||
| 2026-02-17 | 13F | D. E. Shaw & Co., Inc. | 756.647 | 240,53 | 1.218 | 226,54 | ||||
| 2026-02-17 | 13F | Vestal Point Capital, LP | 280.000 | 0,00 | 451 | -4,26 | ||||
| 2026-02-02 | 13F | Cornerstone Planning Group LLC | 560 | 0,00 | 1 | |||||
| 2025-11-04 | 13F | State of Wyoming | 0 | -100,00 | 0 | |||||
| 2026-04-30 | 13F | Nisa Investment Advisors, Llc | 347 | 0,00 | 1 | |||||
| 2026-02-17 | 13F | Ikarian Capital, LLC | 74.893 | -6,47 | 121 | -10,45 | ||||
| 2026-02-06 | 13F | Gsa Capital Partners Llp | 511.004 | 740,45 | 1 | |||||
| 2026-02-09 | 13F | Catalyst Funds Management Pty Ltd | 0 | -100,00 | 0 | |||||
| 2026-02-13 | 13F | Jacobs Levy Equity Management, Inc | 901.057 | 10,44 | 1.451 | 5,84 | ||||
| 2026-02-17 | 13F | Evercore Wealth Management, LLC | 17.543 | 0,00 | 28 | -3,45 | ||||
| 2026-02-17 | 13F | Delaware Management Holdings, Inc. | 420.000 | 676 | ||||||
| 2026-02-10 | 13F | Daiwa Securities Group Inc. | 0 | -100,00 | 0 | |||||
| 2025-11-13 | 13F | Hudson Bay Capital Management LP | 0 | -100,00 | 0 | |||||
| 2025-11-14 | 13F | Aqr Capital Management Llc | 0 | -100,00 | 0 | -100,00 | ||||
| 2026-02-17 | 13F | Tang Capital Management Llc | 0 | -100,00 | 0 | |||||
| 2025-11-14 | 13F | Point72 (DIFC) Ltd | 190 | 0,00 | 0 | |||||
| 2026-02-12 | 13F | Dimensional Fund Advisors Lp | 187.775 | -45,66 | 302 | -47,93 | ||||
| 2026-02-10 | 13F | Acadian Asset Management Llc | 2.518.410 | 0,03 | 4 | 0,00 | ||||
| 2026-02-13 | 13F | State Street Corp | 274.587 | 0,00 | 442 | -4,12 | ||||
| 2026-02-17 | 13F | Two Sigma Securities, Llc | 0 | -100,00 | 0 | -100,00 | ||||
| 2026-01-27 | 13F | Gf Fund Management Co. Ltd. | 0 | -100,00 | 0 | |||||
| 2026-02-12 | 13F | Jane Street Group, Llc | 1.254.923 | 48,21 | 2.020 | 42,05 | ||||
| 2026-02-12 | 13F | BlackRock, Inc. | 1.152.649 | -25,09 | 1.856 | -28,24 | ||||
| 2025-11-10 | 13F | EverSource Wealth Advisors, LLC | 0 | -100,00 | 0 | |||||
| 2026-02-14 | 13F | Rockefeller Capital Management L.P. | 25 | 0,00 | 0 | |||||
| 2026-02-05 | 13F | Northwestern Mutual Wealth Management Co | 43.814 | 11.969,97 | 9.977 | |||||
| 2026-04-13 | 13F | Loring Wolcott & Coolidge Fiduciary Advisors Llp/ma | 213 | 0,00 | 1 | |||||
| 2025-11-14 | 13F | State Of Wisconsin Investment Board | 0 | -100,00 | 0 | |||||
| 2026-02-17 | 13F | Tower Research Capital LLC (TRC) | 978 | -94,17 | 2 | -96,43 | ||||
| 2026-02-17 | 13F | Rangeley Capital, LLC | 30.220 | 0,00 | 49 | -4,00 | ||||
| 2026-02-17 | 13F | Bank Of America Corp /de/ | 1.837.720 | 777,42 | 2.959 | 742,74 | ||||
| 2026-02-11 | 13F | Jpmorgan Chase & Co | 5.753 | -99,24 | 9 | -99,29 | ||||
| 2026-02-10 | 13F | Connor, Clark & Lunn Investment Management Ltd. | 818.820 | 15,23 | 1.318 | 10,48 | ||||
| 2026-02-13 | 13F | Barclays Plc | 41.350 | 5,20 | 67 | 0,00 | ||||
| 2025-11-14 | 13F | Point72 Asia (Singapore) Pte. Ltd. | 25.105 | -50,00 | 42 | -30,00 | ||||
| 2025-11-12 | 13F | Us Bancorp \de\ | 0 | -100,00 | 0 | |||||
| 2025-11-12 | 13F | Aster Capital Management (DIFC) Ltd | 0 | -100,00 | 0 | -100,00 | ||||
| 2026-04-28 | 13F | SBI Securities Co., Ltd. | 1 | -98,31 | 0 | |||||
| 2026-02-09 | 13F | Jefferies Financial Group Inc. | 1.841.172 | 2.964 | ||||||
| 2026-02-13 | 13F | Wells Fargo & Company/mn | 3.000 | 0,00 | 5 | -20,00 | ||||
| 2026-02-17 | 13F | Algert Global Llc | 0 | -100,00 | 0 | |||||
| 2026-01-26 | 13F | Mirae Asset Global Investments Co., Ltd. | 0 | -100,00 | 0 | |||||
| 2026-02-17 | 13F | Boothbay Fund Management, Llc | 18.334 | -22,02 | 30 | -25,64 | ||||
| 2026-02-11 | 13F | Simplex Trading, Llc | Put | 900 | -79,07 | 1 | ||||
| 2026-02-17 | 13F | Russell Investments Group, Ltd. | 1.277 | -97,40 | 2 | -97,65 | ||||
| 2026-02-11 | 13F | Simplex Trading, Llc | 5.097 | -28,45 | 8 | |||||
| 2026-02-17 | 13F | Fmr Llc | 62.299 | -1,63 | 100 | -5,66 | ||||
| 2026-02-11 | 13F | Manchester Capital Management LLC | 0 | -100,00 | 0 | -100,00 | ||||
| 2025-11-14 | 13F | Jain Global LLC | 0 | -100,00 | 0 | |||||
| 2026-02-11 | 13F | Simplex Trading, Llc | Call | 100 | -93,33 | 0 | ||||
| 2026-02-13 | 13F | Squarepoint Ops LLC | 312.424 | -18,98 | 503 | -22,26 | ||||
| 2026-02-17 | 13F | Northern Trust Corp | 152.672 | 1,01 | 246 | -3,16 | ||||
| 2025-11-13 | 13F | Jump Financial, LLC | 0 | -100,00 | 0 | |||||
| 2025-11-14 | 13F | Virtu Financial LLC | 0 | -100,00 | 0 | |||||
| 2026-02-17 | 13F | Citadel Advisors Llc | Put | 0 | -100,00 | 0 | -100,00 | |||
| 2025-11-14 | 13F | EcoR1 Capital, LLC | 0 | -100,00 | 0 | |||||
| 2026-02-17 | 13F | Quadrature Capital Ltd | 265.465 | 521,49 | 427 | 501,41 | ||||
| 2026-02-17 | 13F | Bridgeway Capital Management Inc | 81.200 | -8,46 | 131 | -12,75 | ||||
| 2026-02-17 | 13F | Voleon Capital Management Lp | 0 | -100,00 | 0 | |||||
| 2026-02-17 | 13F | Bellevue Group AG | 0 | -100,00 | 0 | |||||
| 2026-04-15 | 13F | Fortitude Family Office, LLC | 276 | 1 | ||||||
| 2025-11-12 | 13F | Cresset Asset Management, LLC | 25.828 | -3,34 | 43 | 34,38 | ||||
| 2026-02-13 | 13F | Sei Investments Co | 31.318 | 0,00 | 50 | -3,85 | ||||
| 2026-04-09 | 13F | Sanders Morris Harris Llc | 12.345 | 36 | ||||||
| 2026-02-13 | 13F | SRS Capital Advisors, Inc. | 55 | 511,11 | 0 | |||||
| 2026-02-11 | 13F | Group One Trading, L.p. | Call | 5.300 | 253,33 | 9 | 300,00 | |||
| 2026-04-22 | 13F | Spire Wealth Management | 664 | 0,00 | 2 | 0,00 | ||||
| 2026-02-11 | 13F | Group One Trading, L.p. | Put | 1.000 | 900,00 | 2 | ||||
| 2026-04-29 | 13F | R Squared Ltd | 15.117 | -4,87 | 44 | 72,00 | ||||
| 2026-02-13 | 13F | Marshall Wace, Llp | 1.284.563 | 2.068 | ||||||
| 2025-11-14 | 13F | Ubs Asset Management Americas Inc | 0 | -100,00 | 0 | |||||
| 2026-02-17 | 13F | Susquehanna International Group, Llp | Call | 0 | -100,00 | 0 | ||||
| 2026-02-19 | 13F | Invesco Ltd. | 111.121 | 31,58 | 179 | 26,24 | ||||
| 2026-04-21 | 13F | Pinnacle Associates Ltd | 279.121 | -4,64 | 807 | 71,13 | ||||
| 2026-02-13 | 13F | Truvestments Capital Llc | 1.008 | 0,00 | 2 | 0,00 | ||||
| 2026-02-13 | 13F | Prudential Financial Inc | 22.600 | 3,67 | 36 | 0,00 | ||||
| 2026-01-29 | 13F | UBS Group AG | 119.447 | 149,96 | 192 | 140,00 | ||||
| 2026-02-11 | 13F | LPL Financial LLC | 65.125 | 181,22 | 105 | 173,68 | ||||
| 2025-11-14 | 13F | Engineers Gate Manager LP | 0 | -100,00 | 0 | |||||
| 2026-01-29 | 13F | China Universal Asset Management Co., Ltd. | 0 | -100,00 | 0 | |||||
| 2026-02-13 | 13F | Stifel Financial Corp | 0 | -100,00 | 0 | |||||
| 2026-02-17 | 13F | Millennium Management Llc | 1.974.480 | -6,73 | 3.179 | -10,63 | ||||
| 2026-02-19 | 13F | CI Private Wealth, LLC | 11.822 | -19,16 | 19 | -20,83 | ||||
| 2026-02-12 | 13F | Hrt Financial Lp | 190.095 | 0 | ||||||
| 2026-02-17 | 13F | XTX Topco Ltd | 240.327 | 38,15 | 387 | 32,19 | ||||
| 2026-02-17 | 13F | Royal Bank Of Canada | 879 | 85,05 | 1 | 0,00 | ||||
| 2026-04-27 | 13F | Leonteq Securities AG | 50.000 | -50,00 | 144 | -10,56 | ||||
| 2026-01-09 | 13F | SG Americas Securities, LLC | 0 | -100,00 | 0 | |||||
| 2026-02-17 | 13F | Point72 Asset Management, L.P. | 249.157 | 401 | ||||||
| 2025-12-18 | 13F | Danske Bank A/s | 0 | -100,00 | 0 | |||||
| 2026-01-28 | 13F | Universal- Beteiligungs- und Servicegesellschaft mbH | 300.000 | 42,86 | 468 | 32,95 | ||||
| 2026-02-13 | 13F | Dynamic Technology Lab Private Ltd | 0 | -100,00 | 0 | |||||
| 2025-11-14 | 13F | Woodline Partners LP | 0 | -100,00 | 0 | |||||
| 2026-02-12 | 13F | Renaissance Technologies Llc | 2.908.631 | 70,97 | 4.683 | 63,82 | ||||
| 2026-02-17 | 13F | Jones Financial Companies Lllp | 30 | 0,00 | 0 | |||||
| 2026-02-17 | 13F | Armistice Capital, Llc | 6.324.000 | 6,11 | 10.182 | 1,69 | ||||
| 2025-11-13 | 13F | Hsbc Holdings Plc | 0 | -100,00 | 0 | -100,00 | ||||
| 2026-02-17 | 13F | Advisory Services Network, LLC | 0 | -100,00 | 0 | |||||
| 2026-02-17 | 13F | Cantor Fitzgerald, L. P. | 0 | -100,00 | 0 | -100,00 | ||||
| 2026-02-18 | 13F | Mackenzie Financial Corp | 207.879 | 324 | ||||||
| 2026-02-17 | 13F | Canada Pension Plan Investment Board | 155.200 | 250 | ||||||
| 2026-02-17 | 13F | Amundi | 214.278 | 345 | ||||||
| 2026-02-10 | 13F | Goldman Sachs Group Inc | 181.706 | -29,75 | 293 | -32,72 | ||||
| 2025-11-14 | 13F | DRW Securities, LLC | 0 | -100,00 | 0 | -100,00 | ||||
| 2026-02-06 | 13F | Covestor Ltd | 55 | -1,79 | 0 | |||||
| 2026-02-17 | 13F | Citadel Advisors Llc | 1.035.153 | 109,74 | 1.667 | 100,97 | ||||
| 2026-02-17 | 13F | Citadel Advisors Llc | Call | 86.300 | 189,60 | 139 | 176,00 | |||
| 2026-02-13 | 13F | Charles Schwab Investment Management Inc | 0 | -100,00 | 0 | |||||
| 2026-04-16 | 13F | XML Financial, LLC | 24.836 | -1,97 | 72 | 77,50 | ||||
| 2026-02-13 | 13F | Citigroup Inc | 0 | -100,00 | 0 | -100,00 | ||||
| 2025-11-12 | 13F | Group One Trading, L.p. | 0 | -100,00 | 0 | -100,00 | ||||
| 2026-02-13 | 13F | Walleye Capital LLC | 33.180 | 31,77 | 53 | 26,19 | ||||
| 2026-02-09 | 13F | Geode Capital Management, Llc | 655.300 | -0,34 | 1.055 | -4,52 | ||||
| 2026-04-21 | 13F | Wasatch Advisors Inc | 1.559.701 | -12,69 | 4.508 | 56,71 | ||||
| 2026-02-13 | 13F | Macquarie Group Ltd | 0 | -100,00 | 0 | |||||
| 2025-11-14 | 13F | Cubist Systematic Strategies, LLC | 109.226 | -68,98 | 184 | -57,04 | ||||
| 2026-01-29 | 13F | Comerica Bank | 44 | 0,00 | 0 | |||||
| 2025-11-05 | 13F | SPC Financial, Inc. | 37.750 | 0,00 | 63 | 40,00 | ||||
| 2026-01-26 | 13F | Cwm, Llc | 243 | -75,50 | 0 | |||||
| 2026-02-10 | 13F | Bnp Paribas Arbitrage, Sa | 694 | -99,20 | 1 | -99,31 | ||||
| 2026-04-30 | 13F | Clear Street Markets Llc | 0 | -100,00 | 0 | |||||
| 2026-02-05 | 13F | IMG Wealth Management, Inc. | 1.150 | 0,00 | 2 | 0,00 | ||||
| 2026-02-17 | 13F | Tudor Investment Corp Et Al | 16.429 | 26 | ||||||
| 2026-02-13 | 13F | Affinity Asset Advisors, LLC | 484.308 | 780 | ||||||
| 2026-02-17 | 13F | Two Sigma Advisers, Lp | 1.195.000 | 59,63 | 1.924 | 52,98 | ||||
| 2026-02-17 | 13F | Advisor Group Holdings, Inc. | 6.460 | -0,23 | 10 | -9,09 |
Other Listings
| US:MGNX | 3,13 $ |