Grundlæggende statistik
| Institutionelle aktier (lange) | 59.969.387 - 23,60% (ex 13D/G) - change of -10,26MM shares -14,61% MRQ |
| Institutionel værdi (lang) | $ 572.896 USD ($1000) |
Institutionelt ejerskab og aktionærer
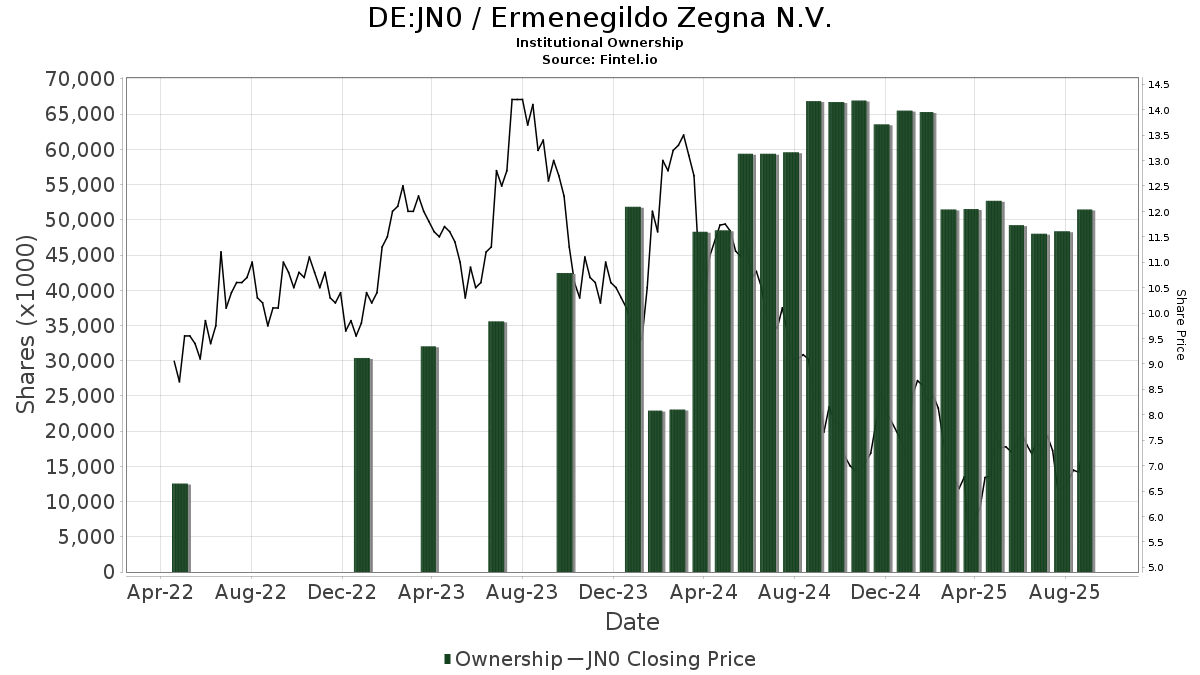
Ermenegildo Zegna N.V. (DE:JN0) har 140 institutionelle ejere og aktionærer, der har indsendt 13D/G- eller 13F-formularer til Securities Exchange Commission (SEC). Disse institutioner har i alt 59,969,387 aktier. Største aktionærer omfatter Temasek Holdings (Private) Ltd, Barrow Hanley Mewhinney & Strauss Llc, Price T Rowe Associates Inc /md/, BlackRock, Inc., Harris Associates L P, PRIDX - T. Rowe Price International Discovery Fund, Artisan Partners Limited Partnership, FIL Ltd, Millennium Management Llc, and Tabor Asset Management, LP .
Ermenegildo Zegna N.V. (DB:JN0) institutionel ejerskabsstruktur viser aktuelle positioner i virksomheden efter institutioner og fonde, samt seneste ændringer i positionsstørrelse. Større aktionærer kan omfatte individuelle investorer, investeringsforeninger, hedgefonde eller institutioner. Skema 13D angiver, at investoren besidder (eller besidder) mere end 5 % af virksomheden og har til hensigt (eller har til hensigt at) aktivt at forfølge en ændring i forretningsstrategi. Skema 13G indikerer en passiv investering på over 5%.
The share price as of March 13, 2026 is 8,53 / share. Previously, on March 20, 2025, the share price was 6,66 / share. This represents an increase of 28,08% over that period.
Fondens stemningsscore
Fund Sentiment Score (fka Ownership Accumulation Score) finder de aktier, der bliver mest købt af fonde. Det er resultatet af en sofistikeret, multi-faktor kvantitativ model, der identificerer virksomheder med de højeste niveauer af institutionel akkumulering. Scoringsmodellen bruger en kombination af den samlede stigning i oplyste ejere, ændringerne i porteføljeallokeringer i disse ejere og andre målinger. Tallet går fra 0 til 100, hvor højere tal indikerer et højere niveau af akkumulering for sine jævnaldrende, og 50 er gennemsnittet.
Opdateringsfrekvens: Dagligt
Se Ownership Explorer, som giver en liste over højest rangerende virksomheder.
AI+ Ask Fintel’s AI assistant about Ermenegildo Zegna N.V..
Select a question to share a public post with an AI-crafted answer.
Thinking of good questions…
13F og NPORT arkivering
Detaljer om 13F-arkivering er gratis. Detaljer om NP-ansøgninger kræver et premium-medlemskab. Grønne rækker angiver nye positioner. Røde rækker angiver lukkede positioner. Klik på linket ikon for at se den fulde transaktionshistorik.
Opgrader
for at låse premium-data op og eksportere til Excel ![]() .
.
| Fil dato | Kilde | Investor | Type | Gennemsnitlig pris (Øst) |
Aktier | Δ Aktier (%) |
Rapporteret Værdi ($1000) |
Δ Værdi (%) |
Port Alloc (%) |
|
|---|---|---|---|---|---|---|---|---|---|---|
| 2026-02-13 | 13F | Polymer Capital Management (HK) LTD | 0 | -100,00 | 0 | |||||
| 2026-02-17 | 13F | Two Sigma Investments, Lp | 261.276 | -48,26 | 2.678 | -43,87 | ||||
| 2026-02-13 | 13F | MAI Capital Management | 15 | 0 | ||||||
| 2025-11-13 | 13F | Ceredex Value Advisors LLC | 0 | -100,00 | 0 | |||||
| 2026-02-17 | 13F | Millennium Management Llc | 1.188.887 | 73,73 | 12.186 | 88,43 | ||||
| 2026-02-17 | 13F | Fmr Llc | 3.698 | 119,99 | 38 | 146,67 | ||||
| 2025-09-26 | NP | FSSNX - Fidelity Small Cap Index Fund This fund is a listed as child fund of Fmr Llc and if that institution has disclosed ownership in this security, then these positions will not be double counted when calculating total shares and total value | 618.819 | 4.975 | ||||||
| 2026-02-17 | 13F | Moore Capital Management, Lp | 50.000 | 0,00 | 512 | 8,47 | ||||
| 2026-02-13 | 13F | Wells Fargo & Company/mn | 67.591 | 78,07 | 693 | 93,30 | ||||
| 2026-02-17 | 13F | Tabor Asset Management, LP | 1.068.259 | 66,86 | 10.950 | 81,01 | ||||
| 2025-09-24 | NP | BLACKROCK FUNDS - iShares Total U.S. Stock Market Index Fund Investor A | 4.497 | -0,66 | 36 | -37,93 | ||||
| 2026-01-15 | 13F | Nisa Investment Advisors, Llc | 888 | 548,18 | 9 | 800,00 | ||||
| 2026-02-06 | 13F | Gsa Capital Partners Llp | 0 | -100,00 | 0 | |||||
| 2026-02-17 | 13F | QVIDTVM Management LLC | 475.893 | 33.892,36 | 4.878 | 344,98 | ||||
| 2026-02-10 | 13F | Bank of New York Mellon Corp | 128.288 | -1,29 | 1.315 | 7,00 | ||||
| 2026-02-17 | 13F | Two Sigma Advisers, Lp | 234.200 | -47,13 | 2.401 | -42,67 | ||||
| 2026-02-17 | 13F | California State Teachers Retirement System | 3.804 | -1,40 | 39 | 5,56 | ||||
| 2026-01-07 | 13F | Central Pacific Bank - Trust Division | 31.654 | 86,67 | 324 | 102,50 | ||||
| 2026-02-11 | 13F | Next Capital Management LLC | 18.275 | 0,00 | 187 | 8,72 | ||||
| 2026-01-23 | 13F | Farther Finance Advisors, LLC | 24 | 0 | ||||||
| 2026-02-11 | 13F | Gordian Capital Singapore Pte Ltd | 29.000 | 297 | ||||||
| 2026-02-10 | 13F | State of Wyoming | 0 | -100,00 | 0 | |||||
| 2026-02-13 | 13F | Sei Investments Co | 452.237 | -8,81 | 4.635 | -1,09 | ||||
| 2025-09-24 | NP | PPNMX - SmallCap Growth Fund I R-3 | 3.287 | 26 | ||||||
| 2026-02-12 | 13F | Marex Group plc | 14.001 | 144 | ||||||
| 2026-02-10 | 13F | Bnp Paribas Arbitrage, Sa | 17.292 | 45,92 | 177 | 59,46 | ||||
| 2026-02-12 | 13F | MetLife Investment Management, LLC | 37.948 | 0,00 | 389 | 8,38 | ||||
| 2026-02-11 | 13F | Ameritas Investment Partners, Inc. | 5.162 | 53 | ||||||
| 2026-02-10 | 13F | Goldman Sachs Group Inc | 166.356 | -45,09 | 1.705 | -40,43 | ||||
| 2026-02-17 | 13F | CastleKnight Management LP | 158.700 | 0,00 | 1.627 | 8,47 | ||||
| 2025-11-13 | 13F | Quadrature Capital Ltd | 0 | -100,00 | 0 | |||||
| 2026-02-17 | 13F | Man Group plc | 0 | -100,00 | 0 | |||||
| 2026-02-13 | 13F | Verition Fund Management LLC | 56.914 | -34,80 | 583 | -29,25 | ||||
| 2026-02-19 | 13F | Invesco Ltd. | 41.811 | -12,04 | 429 | -4,68 | ||||
| 2025-09-26 | NP | SLPIX - Small-cap Profund Investor Class | 56 | -1,75 | 0 | |||||
| 2026-02-17 | 13F | Occudo Quantitative Strategies Lp | 88.433 | 72,86 | 906 | 87,58 | ||||
| 2026-02-11 | 13F | Los Angeles Capital Management Llc | 49.445 | 151,56 | 509 | 174,59 | ||||
| 2025-11-14 | 13F | CI Private Wealth, LLC | 0 | -100,00 | 0 | |||||
| 2025-11-14 | 13F | National Bank Of Canada /fi/ | 0 | -100,00 | 0 | |||||
| 2026-02-17 | 13F | Creative Planning | 84.364 | 31,54 | 865 | 42,57 | ||||
| 2026-02-17 | 13F | Aster Capital Management (DIFC) Ltd | 2.380 | 24 | ||||||
| 2025-11-13 | 13F | Tocqueville Asset Management L.p. | 0 | -100,00 | 0 | |||||
| 2026-02-06 | 13F | Global Retirement Partners, LLC | 12 | 0 | ||||||
| 2026-02-13 | 13F | Squarepoint Ops LLC | 0 | -100,00 | 0 | |||||
| 2025-09-29 | NP | PRFZ - Invesco FTSE RAFI US 1500 Small-Mid ETF This fund is a listed as child fund of Invesco Ltd. and if that institution has disclosed ownership in this security, then these positions will not be double counted when calculating total shares and total value | 23.105 | -33,86 | 186 | -33,21 | ||||
| 2026-02-03 | 13F | SBI Securities Co., Ltd. | 3.691 | 0,00 | 38 | 8,82 | ||||
| 2026-02-17 | 13F | Alliancebernstein L.p. | 53.700 | 0,00 | 550 | 8,48 | ||||
| 2026-03-06 | 13F | Hsbc Holdings Plc | 0 | -100,00 | 0 | |||||
| 2026-02-17 | 13F | Jones Financial Companies Lllp | 10.987 | -3,29 | 113 | 8,74 | ||||
| 2026-02-06 | 13F | Handelsbanken Fonder AB | 31.000 | 0,00 | 0 | |||||
| 2026-02-10 | 13F | Intech Investment Management Llc | 36.851 | 10,01 | 378 | 19,30 | ||||
| 2025-09-29 | NP | SUNAMERICA SERIES TRUST - SA Small Cap Index Portfolio Class 1 | 7.025 | 56 | ||||||
| 2026-02-13 | 13F | SRS Capital Advisors, Inc. | 0 | -100,00 | 0 | |||||
| 2025-11-14 | 13F | Point72 Europe (London) LLP | 285 | 3 | ||||||
| 2026-02-06 | 13F | Bare Financial Services, Inc | 713 | 0,00 | 7 | 16,67 | ||||
| 2026-02-17 | 13F | Advisor Group Holdings, Inc. | 1.828 | 37,24 | 19 | 50,00 | ||||
| 2026-02-13 | 13F | Police & Firemen's Retirement System of New Jersey | 17.323 | 0,00 | 178 | 8,59 | ||||
| 2026-02-05 | 13F | Allworth Financial LP | 171 | 24,82 | 2 | 0,00 | ||||
| 2026-02-12 | 13F | Voya Investment Management Llc | 12.851 | 7,97 | 132 | 16,96 | ||||
| 2026-02-17 | 13F | Harris Associates L P | 3.213.300 | -9,64 | 32.936 | -1,99 | ||||
| 2025-09-26 | NP | TISBX - TIAA-CREF Small-Cap Blend Index Fund Institutional Class | 80.137 | -0,98 | 644 | -38,43 | ||||
| 2026-01-27 | 13F | WealthCollab, LLC | 138 | 0,00 | 1 | 0,00 | ||||
| 2026-02-13 | 13F | State Street Corp | 878.867 | 3,21 | 9.014 | 11,93 | ||||
| 2026-02-12 | 13F | Quadrant Capital Group Llc | 1.391 | 463,16 | 14 | 600,00 | ||||
| 2026-02-11 | 13F | Simplex Trading, Llc | 989 | 10 | ||||||
| 2026-02-17 | 13F | Portolan Capital Management, LLC | 710.534 | -48,10 | 7.283 | -43,72 | ||||
| 2026-01-27 | 13F | Zurcher Kantonalbank (Zurich Cantonalbank) | 932 | 0,00 | 10 | 12,50 | ||||
| 2026-02-13 | 13F | Neo Ivy Capital Management | 16 | 0 | ||||||
| 2026-02-17 | 13F | Temasek Holdings (Private) Ltd | 27.242.276 | 0,00 | 279.233 | 8,47 | ||||
| 2026-02-11 | 13F | Renaissance Group Llc | 95.209 | -15,84 | 976 | -8,79 | ||||
| 2026-02-11 | 13F | Parallel Advisors, LLC | 6.735 | 69 | ||||||
| 2026-02-10 | 13F | Rothschild Investment Llc | 10 | 0 | ||||||
| 2026-01-09 | 13F | SG Americas Securities, LLC | 37.145 | -13,97 | 0 | |||||
| 2026-01-16 | 13F | Matauro, Llc | 204.757 | 2.099 | ||||||
| 2026-02-13 | 13F | Morgan Stanley | 212.858 | -21,37 | 2.182 | -14,74 | ||||
| 2026-02-17 | 13F | Royal Bank Of Canada | 2.997 | -96,33 | 31 | -95,98 | ||||
| 2026-02-17 | 13F | Artisan Partners Limited Partnership | 1.930.348 | -9,10 | 19.786 | -1,40 | ||||
| 2026-02-17 | 13F | Schonfeld Strategic Advisors LLC | 86.439 | 527,83 | 886 | 580,77 | ||||
| 2026-02-17 | 13F | PharVision Advisers, LLC | 0 | -100,00 | 0 | |||||
| 2026-02-11 | 13F | Barrow Hanley Mewhinney & Strauss Llc | 4.177.804 | 74,62 | 42.822 | 89,40 | ||||
| 2026-02-12 | 13F | Polen Capital Management Llc | 42.768 | 438 | ||||||
| 2026-02-17 | 13F | GAM Holding AG | 706.936 | 0,00 | 7.246 | 8,47 | ||||
| 2026-02-13 | 13F | Dynamic Technology Lab Private Ltd | 19.655 | 201 | ||||||
| 2026-02-13 | 13F | Quarry LP | 647 | -73,05 | 7 | -72,73 | ||||
| 2026-02-05 | 13F | Spectrum Strategic Capital Management, LLC | 111.572 | 903,35 | 1.144 | 988,57 | ||||
| 2026-02-17 | 13F | Northern Trust Corp | 313.570 | -10,91 | 3.214 | -3,37 | ||||
| 2026-01-26 | 13F | Dupont Capital Management Corp | 1 | 0,00 | 0 | |||||
| 2026-02-10 | 13F/A | Northwestern Mutual Wealth Management Co | 98 | 1 | ||||||
| 2026-02-17 | 13F | Price T Rowe Associates Inc /md/ | 3.961.744 | -0,91 | 41 | 8,11 | ||||
| 2026-01-08 | 13F | True Wealth Design, LLC | 23 | 0 | ||||||
| 2026-02-13 | 13F | OMERS ADMINISTRATION Corp | 0 | -100,00 | 0 | |||||
| 2026-02-12 | 13F | CIBC Private Wealth Group, LLC | 1.020 | 10 | ||||||
| 2026-02-17 | 13F | Point72 Asset Management, L.P. | 186.639 | -76,62 | 1.913 | -74,64 | ||||
| 2026-02-06 | 13F | IFP Advisors, Inc | 19 | -24,00 | 0 | |||||
| 2026-02-06 | 13F | ProShare Advisors LLC | 11.294 | 6,89 | 116 | 16,16 | ||||
| 2026-02-06 | 13F | Pnc Financial Services Group, Inc. | 36 | 0 | ||||||
| 2026-02-13 | 13F | American Century Companies Inc | 980.405 | 79,32 | 10.049 | 94,52 | ||||
| 2026-02-12 | 13F | BlackRock, Inc. | 3.280.186 | 2,74 | 33.622 | 11,43 | ||||
| 2025-11-14 | 13F | Trexquant Investment LP | 0 | -100,00 | 0 | -100,00 | ||||
| 2026-02-06 | 13F | EverSource Wealth Advisors, LLC | 1.880 | -9,05 | 19 | 0,00 | ||||
| 2026-02-17 | 13F | Voloridge Investment Management, Llc | 0 | -100,00 | 0 | |||||
| 2026-02-17 | 13F | Balyasny Asset Management Llc | 136.158 | 1.396 | ||||||
| 2026-02-17 | 13F | FIL Ltd | 1.241.329 | -17,52 | 12.724 | -10,53 | ||||
| 2026-02-17 | 13F | MIRAE ASSET GLOBAL ETFS HOLDINGS Ltd. | 28.656 | -1,17 | 294 | 6,93 | ||||
| 2026-02-17 | 13F | Engineers Gate Manager LP | 0 | -100,00 | 0 | -100,00 | ||||
| 2026-02-06 | 13F | Covestor Ltd | 0 | 0 | ||||||
| 2026-02-17 | 13F | Jain Global LLC | 0 | -100,00 | 0 | |||||
| 2026-01-23 | 13F | State of Alaska, Department of Revenue | 13.578 | 3,60 | 0 | |||||
| 2025-09-25 | NP | RPGAX - T. Rowe Price Global Allocation Fund, Inc. This fund is a listed as child fund of Price T Rowe Associates Inc /md/ and if that institution has disclosed ownership in this security, then these positions will not be double counted when calculating total shares and total value | 12.851 | 0,00 | 103 | 0,98 | ||||
| 2026-02-17 | 13F | Edmond De Rothschild Holding S.a. | 360.000 | 0,00 | 3.690 | 8,47 | ||||
| 2026-01-27 | 13F | Osborne Partners Capital Management, Llc | 699.321 | -2,55 | 7.168 | 5,71 | ||||
| 2026-02-12 | 13F | Nuveen, LLC | 86.679 | 0,00 | 888 | 8,42 | ||||
| 2025-11-14 | 13F | Lazard Asset Management Llc | 0 | -100,00 | 0 | |||||
| 2026-02-13 | 13F | Charles Schwab Investment Management Inc | 154.091 | 0,00 | 1.579 | 8,45 | ||||
| 2026-02-06 | 13F | Larson Financial Group LLC | 1.607 | 105,50 | 16 | 128,57 | ||||
| 2025-09-29 | NP | CFSLX - Column Small Cap Fund | 3.593 | 30 | ||||||
| 2026-01-29 | 13F | UBS Group AG | 835.467 | 8,02 | 8.564 | 17,16 | ||||
| 2026-01-29 | 13F | Nbc Securities, Inc. | 9.137 | 94 | ||||||
| 2026-02-10 | 13F | Envestnet Asset Management Inc | 12.427 | -84,59 | 127 | -83,31 | ||||
| 2025-09-24 | NP | SWSSX - Schwab Small-Cap Index Fund This fund is a listed as child fund of Charles Schwab Investment Management Inc and if that institution has disclosed ownership in this security, then these positions will not be double counted when calculating total shares and total value | 158.230 | 15,65 | 1.272 | -28,09 | ||||
| 2026-01-26 | 13F | Cwm, Llc | 3.191 | 22,45 | 0 | |||||
| 2026-02-12 | 13F | New York State Common Retirement Fund | 155.299 | 0,00 | 1.592 | 8,45 | ||||
| 2026-02-05 | 13F | Amalgamated Bank | 1.941 | -8,01 | 0 | |||||
| 2025-09-29 | NP | RSSL - Global X Russell 2000 ETF | 31.413 | 253 | ||||||
| 2026-01-20 | 13F | Signaturefd, Llc | 676 | 745,00 | 7 | |||||
| 2025-11-13 | 13F | Alpine Investment Management Ltd | 0 | -100,00 | 0 | |||||
| 2026-02-17 | 13F | Aqr Capital Management Llc | 71.226 | 22,85 | 730 | 33,46 | ||||
| 2026-02-18 | 13F | Vident Advisory, LLC | 18.001 | 6,49 | 185 | 15,72 | ||||
| 2026-02-13 | 13F | Sterling Capital Management LLC | 422 | 181,33 | 4 | 300,00 | ||||
| 2025-11-17 | 13F | GWM Advisors LLC | 0 | -100,00 | 0 | |||||
| 2026-02-05 | 13F | Bank Julius Baer & Co. Ltd, Zurich | 35.000 | 0,00 | 359 | 8,48 | ||||
| 2026-02-17 | 13F | Bank Of America Corp /de/ | 100.028 | -15,93 | 1.025 | -8,81 | ||||
| 2026-02-17 | 13F | PDT Partners, LLC | 172.543 | -0,38 | 1.769 | 8,07 | ||||
| 2026-02-17 | 13F | Mirabella Financial Services Llp | 46.635 | 478 | ||||||
| 2026-02-09 | 13F | Geode Capital Management, Llc | 714.708 | -1,68 | 7.326 | 6,64 | ||||
| 2026-02-13 | 13F | Walleye Capital LLC | 32.660 | 335 | ||||||
| 2026-02-13 | 13F | Barclays Plc | 96.285 | -23,96 | 987 | -17,56 | ||||
| 2026-02-11 | 13F | Jpmorgan Chase & Co | 24.690 | -1,32 | 253 | 7,20 | ||||
| 2026-02-13 | 13F | Smartleaf Asset Management LLC | 344 | 4 | ||||||
| 2026-02-09 | 13F | Legal & General Group Plc | 6.336 | -6,29 | 65 | 1,59 | ||||
| 2026-02-17 | 13F | Atom Investors LP | 0 | -100,00 | 0 | |||||
| 2026-02-09 | 13F/A | Fideuram - Intesa Sanpaolo Private Banking S.p.a. | 194.530 | 1.994 | ||||||
| 2026-02-17 | 13F | Citadel Advisors Llc | Call | 17.100 | 175 | |||||
| 2026-02-17 | 13F | Citadel Advisors Llc | 94.431 | -86,13 | 968 | -84,96 | ||||
| 2026-02-06 | 13F | Leonteq Securities AG | 751 | 8 | ||||||
| 2026-02-09 | 13F | Hartland & Co., LLC | 0 | -100,00 | 0 | |||||
| 2026-02-13 | 13F | Manufacturers Life Insurance Company, The | 0 | -100,00 | 0 | |||||
| 2026-02-10 | 13F | Savant Capital, LLC | 16.133 | 8,01 | 165 | 17,02 | ||||
| 2026-02-12 | 13F | Jane Street Group, Llc | 58.732 | 43,55 | 602 | 55,96 | ||||
| 2026-03-03 | 13F/A | Caitong International Asset Management Co., Ltd | 2.120 | 6.135,29 | 22 | |||||
| 2026-01-29 | 13F | Vanguard Group Inc | 417.317 | 1,93 | 4.277 | 10,55 | ||||
| 2025-09-24 | NP | BLACKROCK FUNDS - iShares Russell Small/Mid-Cap Index Fund Investor A | 9.440 | 90,25 | 76 | 17,19 | ||||
| 2026-02-13 | 13F | Citigroup Inc | 6.684 | -13,68 | 69 | -6,85 | ||||
| 2026-02-13 | 13F | Ubs Asset Management Americas Inc | 94 | 1 | ||||||
| 2026-02-11 | 13F | Deutsche Bank Ag\ | 57.477 | 3,27 | 589 | 12,19 | ||||
| 2026-02-17 | 13F | Tower Research Capital LLC (TRC) | 2.685 | 9,86 | 28 | 17,39 | ||||
| 2026-02-12 | 13F | Brinker Capital Investments, LLC | 25.223 | 117,76 | 259 | 136,70 | ||||
| 2026-02-17 | 13F | Russell Investments Group, Ltd. | 8.340 | 5,50 | 85 | 14,86 | ||||
| 2026-02-12 | 13F | Federated Hermes, Inc. | 302.424 | -0,59 | 3.100 | 7,83 | ||||
| 2026-02-13 | 13F | Rhumbline Advisers | 67.547 | -2,90 | 692 | 5,33 | ||||
| 2026-02-17 | 13F | Susquehanna International Group, Llp | 26.159 | 268 | ||||||
| 2026-02-03 | 13F | RFG Advisory, LLC | 113.647 | 1.165 | ||||||
| 2026-02-10 | 13F | Quantbot Technologies LP | 35.207 | -69,07 | 361 | -66,51 | ||||
| 2026-02-13 | 13F | Mariner, LLC | 27.811 | 67,53 | 285 | 82,69 | ||||
| 2025-10-16 | 13F | Ronald Blue Trust, Inc. | 0 | -100,00 | 0 | -100,00 | ||||
| 2025-09-26 | NP | UAPIX - Ultrasmall-cap Profund Investor Class | 684 | 5 | ||||||
| 2025-09-25 | NP | PRIDX - T. Rowe Price International Discovery Fund This fund is a listed as child fund of Price T Rowe Associates Inc /md/ and if that institution has disclosed ownership in this security, then these positions will not be double counted when calculating total shares and total value | 3.123.470 | 7,12 | 25.113 | 8,33 |
Other Listings
| US:ZGN | 9,25 $ |