Grundlæggende statistik
| Institutionelle aktier (lange) | 9.625.510 - 23,19% (ex 13D/G) - change of 0,78MM shares 8,85% MRQ |
| Institutionel værdi (lang) | $ 29.272 USD ($1000) |
Institutionelt ejerskab og aktionærer
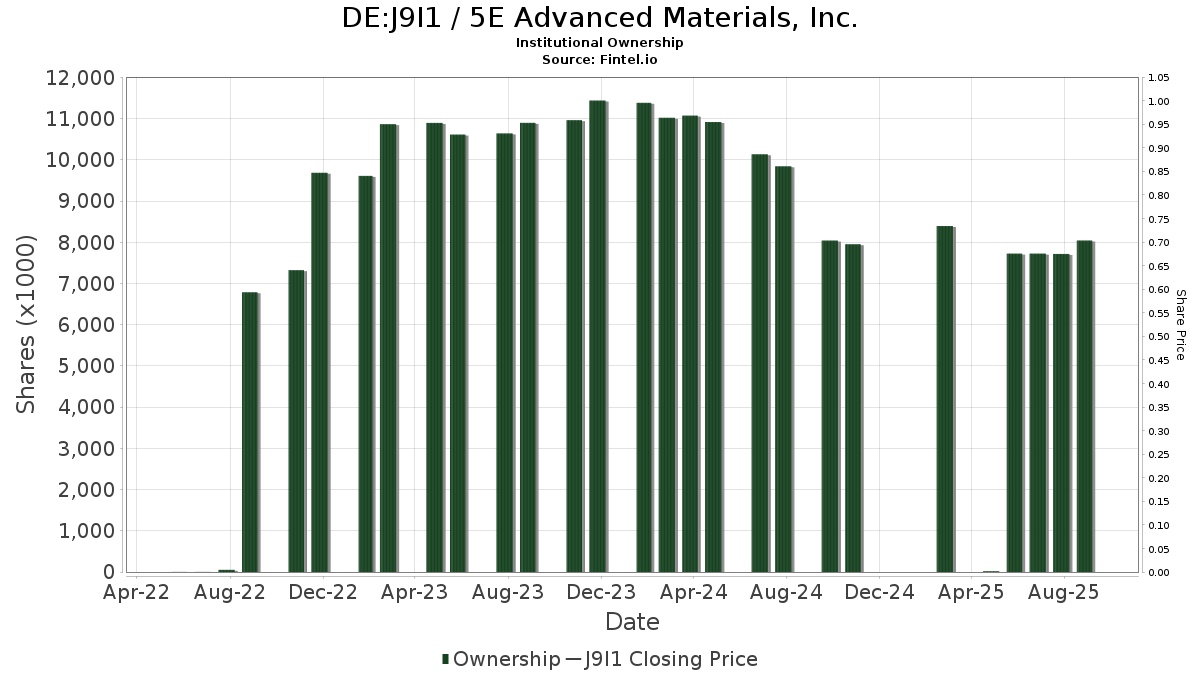
5E Advanced Materials, Inc. (DE:J9I1) har 31 institutionelle ejere og aktionærer, der har indsendt 13D/G- eller 13F-formularer til Securities Exchange Commission (SEC). Disse institutioner har i alt 9,625,510 aktier. Største aktionærer omfatter Bluescape Energy Partners LLC, Vanguard Group Inc, Hohimer Wealth Management, Llc, Mercer Global Advisors Inc /adv, Marex Group plc, Marshall Wace, Llp, Geode Capital Management, Llc, Wiley Bros.-aintree Capital, Llc, Potomac Capital Management, Inc., and XTX Topco Ltd .
5E Advanced Materials, Inc. (DB:J9I1) institutionel ejerskabsstruktur viser aktuelle positioner i virksomheden efter institutioner og fonde, samt seneste ændringer i positionsstørrelse. Større aktionærer kan omfatte individuelle investorer, investeringsforeninger, hedgefonde eller institutioner. Skema 13D angiver, at investoren besidder (eller besidder) mere end 5 % af virksomheden og har til hensigt (eller har til hensigt at) aktivt at forfølge en ændring i forretningsstrategi. Skema 13G indikerer en passiv investering på over 5%.
The share price as of April 20, 2026 is 1,28 / share. Previously, on April 29, 2025, the share price was 6,12 / share. This represents a decline of 79,08% over that period.
Fondens stemningsscore
Fund Sentiment Score (fka Ownership Accumulation Score) finder de aktier, der bliver mest købt af fonde. Det er resultatet af en sofistikeret, multi-faktor kvantitativ model, der identificerer virksomheder med de højeste niveauer af institutionel akkumulering. Scoringsmodellen bruger en kombination af den samlede stigning i oplyste ejere, ændringerne i porteføljeallokeringer i disse ejere og andre målinger. Tallet går fra 0 til 100, hvor højere tal indikerer et højere niveau af akkumulering for sine jævnaldrende, og 50 er gennemsnittet.
Opdateringsfrekvens: Dagligt
Se Ownership Explorer, som giver en liste over højest rangerende virksomheder.
AI+ Ask Fintel’s AI assistant about 5E Advanced Materials, Inc..
Select a question to share a public post with an AI-crafted answer.
Thinking of good questions…
13F og NPORT arkivering
Detaljer om 13F-arkivering er gratis. Detaljer om NP-ansøgninger kræver et premium-medlemskab. Grønne rækker angiver nye positioner. Røde rækker angiver lukkede positioner. Klik på linket ikon for at se den fulde transaktionshistorik.
Opgrader
for at låse premium-data op og eksportere til Excel ![]() .
.
| Fil dato | Kilde | Investor | Type | Gennemsnitlig pris (Øst) |
Aktier | Δ Aktier (%) |
Rapporteret Værdi ($1000) |
Δ Værdi (%) |
Port Alloc (%) |
|
|---|---|---|---|---|---|---|---|---|---|---|
| 2026-04-28 | 13F | SBI Securities Co., Ltd. | 91 | 0,00 | 0 | |||||
| 2026-02-17 | 13F | Wiley Bros.-aintree Capital, Llc | 62.700 | 191 | ||||||
| 2026-02-11 | 13F | LeClair Wealth Partners LLC | 30.000 | 19,95 | 92 | 4,60 | ||||
| 2026-01-27 | 13F | Summit Financial Strategies, Inc. | 12.286 | 37 | ||||||
| 2026-02-09 | 13F | Geode Capital Management, Llc | 77.780 | 112,85 | 237 | 86,61 | ||||
| 2026-02-13 | 13F | Wells Fargo & Company/mn | 28.169 | -69,00 | 86 | -73,19 | ||||
| 2026-02-17 | 13F | Mercer Global Advisors Inc /adv | 220.910 | 674 | ||||||
| 2026-02-13 | 13F | Marshall Wace, Llp | 92.375 | 282 | ||||||
| 2026-02-13 | 13F | Bleichroeder LP | 0 | -100,00 | 0 | -100,00 | ||||
| 2026-02-12 | 13F | Marex Group plc | 104.935 | -33,40 | 320 | -44,64 | ||||
| 2026-02-17 | 13F | Royal Bank Of Canada | 2.000 | 660,46 | 6 | 500,00 | ||||
| 2026-02-12 | 13F | Jane Street Group, Llc | 36.409 | 111 | ||||||
| 2026-04-15 | 13F | Fortitude Family Office, LLC | 0 | -100,00 | 0 | |||||
| 2026-02-13 | 13F | Macquarie Group Ltd | 9.595 | -11,07 | 29 | -21,62 | ||||
| 2026-02-17 | 13F | Advisor Group Holdings, Inc. | 53 | -13,11 | 0 | |||||
| 2026-02-17 | 13F | Bluescape Energy Partners LLC | 8.130.997 | 7,02 | 24.800 | -6,47 | ||||
| 2026-02-12 | 13F | BlackRock, Inc. | 33.161 | 29,42 | 101 | 13,48 | ||||
| 2026-02-17 | 13F | XTX Topco Ltd | 40.682 | 124 | ||||||
| 2026-01-23 | 13F | Avion Wealth | 103 | 0 | ||||||
| 2026-04-23 | 13F | Woodward Diversified Capital, Llc | 17.150 | 13,20 | 27 | -43,48 | ||||
| 2026-01-29 | 13F | Vanguard Group Inc | 300.524 | 132,43 | 917 | 103,10 | ||||
| 2025-11-14 | 13F | Sassicaia Capital Advisers Llc | 0 | -100,00 | 0 | -100,00 | ||||
| 2026-01-29 | 13F | UBS Group AG | 36.770 | -76,14 | 112 | -79,14 | ||||
| 2026-04-17 | 13F | Andina Capital Management, LLC | 29.669 | 5,33 | 42 | -51,76 | ||||
| 2026-02-13 | 13F | State Street Corp | 12.234 | 37 | ||||||
| 2026-02-12 | 13F | Hohimer Wealth Management, Llc | 225.000 | 0,00 | 686 | -12,61 | ||||
| 2026-02-17 | 13F | Tower Research Capital LLC (TRC) | 0 | -100,00 | 0 | |||||
| 2026-02-17 | 13F | Corsair Capital Management, L.p. | 0 | -100,00 | 0 | -100,00 | ||||
| 2025-11-14 | 13F | Millennium Management Llc | 0 | -100,00 | 0 | -100,00 | ||||
| 2026-02-17 | 13F | Bank Of America Corp /de/ | 97 | 470,59 | 0 | |||||
| 2026-02-11 | 13F | Potomac Capital Management, Inc. | 61.115 | 186 | ||||||
| 2026-02-10 | 13F | Bnp Paribas Arbitrage, Sa | 41 | -70,29 | 0 | |||||
| 2026-02-13 | 13F | Citigroup Inc | 0 | -100,00 | 0 | |||||
| 2026-02-17 | 13F | Northern Trust Corp | 10.972 | 33 | ||||||
| 2026-04-13 | 13F | Nvest Wealth Strategies, Inc. | 0 | -100,00 | 0 | -100,00 | ||||
| 2026-02-10 | 13F | Goldman Sachs Group Inc | 22.714 | 69 | ||||||
| 2026-02-11 | 13F | Jpmorgan Chase & Co | 42 | 0,00 | 0 | |||||
| 2026-02-17 | 13F | Advisory Services Network, LLC | 0 | -100,00 | 0 | -100,00 | ||||
| 2026-02-13 | 13F | Morgan Stanley | 7.203 | -16,80 | 22 | -30,00 | ||||
| 2026-02-17 | 13F | Point72 Asset Management, L.P. | 19.733 | 60 |
Other Listings
| US:FEAM | 1,76 $ |