Grundlæggende statistik
| Institutionelle aktier (lange) | 8.655.832 - 44,21% (ex 13D/G) - change of -2,18MM shares -20,10% MRQ |
| Institutionel værdi (lang) | $ 31.201 USD ($1000) |
Institutionelt ejerskab og aktionærer
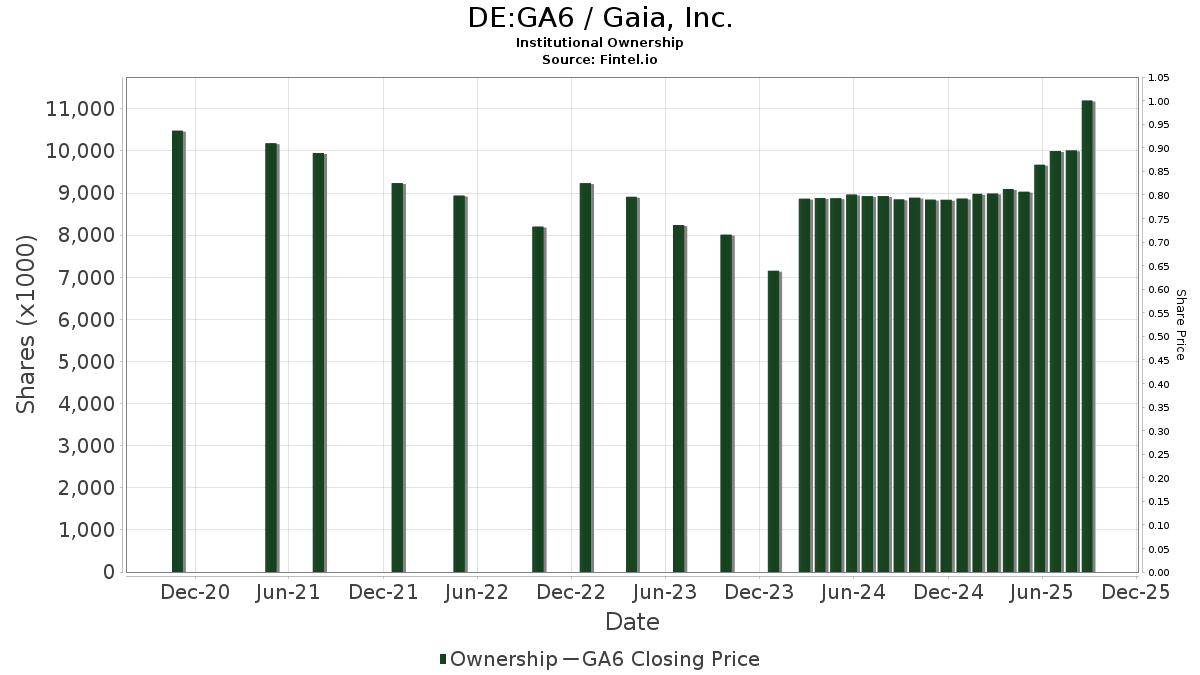
Gaia, Inc. (DE:GA6) har 65 institutionelle ejere og aktionærer, der har indsendt 13D/G- eller 13F-formularer til Securities Exchange Commission (SEC). Disse institutioner har i alt 8,655,832 aktier. Største aktionærer omfatter AWM Investment Company, Inc., BlackRock, Inc., Ameriprise Financial Inc, Nantahala Capital Management, LLC, Vanguard Group Inc, S Squared Technology, LLC, Peapod Lane Capital LLC, Dimensional Fund Advisors Lp, Geode Capital Management, Llc, and State Street Corp .
Gaia, Inc. (DB:GA6) institutionel ejerskabsstruktur viser aktuelle positioner i virksomheden efter institutioner og fonde, samt seneste ændringer i positionsstørrelse. Større aktionærer kan omfatte individuelle investorer, investeringsforeninger, hedgefonde eller institutioner. Skema 13D angiver, at investoren besidder (eller besidder) mere end 5 % af virksomheden og har til hensigt (eller har til hensigt at) aktivt at forfølge en ændring i forretningsstrategi. Skema 13G indikerer en passiv investering på over 5%.
The share price as of April 30, 2026 is 2,56 / share. Previously, on May 5, 2025, the share price was 4,90 / share. This represents a decline of 47,76% over that period.
Fondens stemningsscore
Fund Sentiment Score (fka Ownership Accumulation Score) finder de aktier, der bliver mest købt af fonde. Det er resultatet af en sofistikeret, multi-faktor kvantitativ model, der identificerer virksomheder med de højeste niveauer af institutionel akkumulering. Scoringsmodellen bruger en kombination af den samlede stigning i oplyste ejere, ændringerne i porteføljeallokeringer i disse ejere og andre målinger. Tallet går fra 0 til 100, hvor højere tal indikerer et højere niveau af akkumulering for sine jævnaldrende, og 50 er gennemsnittet.
Opdateringsfrekvens: Dagligt
Se Ownership Explorer, som giver en liste over højest rangerende virksomheder.
AI+ Ask Fintel’s AI assistant about Gaia, Inc..
Select a question to share a public post with an AI-crafted answer.
Thinking of good questions…
13F og NPORT arkivering
Detaljer om 13F-arkivering er gratis. Detaljer om NP-ansøgninger kræver et premium-medlemskab. Grønne rækker angiver nye positioner. Røde rækker angiver lukkede positioner. Klik på linket ikon for at se den fulde transaktionshistorik.
Opgrader
for at låse premium-data op og eksportere til Excel ![]() .
.
| Fil dato | Kilde | Investor | Type | Gennemsnitlig pris (Øst) |
Aktier | Δ Aktier (%) |
Rapporteret Værdi ($1000) |
Δ Værdi (%) |
Port Alloc (%) |
|
|---|---|---|---|---|---|---|---|---|---|---|
| 2026-02-17 | 13F | Advisor Group Holdings, Inc. | 50 | 0,00 | 0 | |||||
| 2026-02-17 | 13F | Tower Research Capital LLC (TRC) | 2.796 | 53,71 | 10 | 0,00 | ||||
| 2026-02-09 | 13F | Legal & General Group Plc | 1.537 | 0,00 | 6 | -44,44 | ||||
| 2026-04-29 | 13F | Police & Firemen's Retirement System of New Jersey | 5.285 | 0,00 | 15 | -26,32 | ||||
| 2026-02-13 | 13F | AWM Investment Company, Inc. | 1.252.090 | -34,54 | 4.545 | -59,86 | ||||
| 2026-02-11 | 13F | O'shaughnessy Asset Management, Llc | 23.147 | 84 | ||||||
| 2026-02-13 | 13F | Rhumbline Advisers | 13.477 | -18,85 | 49 | -51,02 | ||||
| 2026-02-10 | 13F | Bnp Paribas Arbitrage, Sa | 3.759 | -5,91 | 14 | -43,48 | ||||
| 2026-02-11 | 13F | Ameritas Investment Partners, Inc. | 1.740 | 0,00 | 6 | -40,00 | ||||
| 2026-02-17 | 13F | Royal Bank Of Canada | 3.766 | 116,19 | 13 | 18,18 | ||||
| 2026-04-23 | 13F | SJS Investment Consulting Inc. | 1 | 0 | ||||||
| 2026-02-12 | 13F | Dimensional Fund Advisors Lp | 439.076 | -0,86 | 1.594 | -39,24 | ||||
| 2026-02-17 | 13F | Bank Of America Corp /de/ | 15.948 | 79,43 | 58 | 9,62 | ||||
| 2026-02-17 | 13F | Susquehanna International Group, Llp | 15.673 | 57 | ||||||
| 2026-02-17 | 13F | Manatuck Hill Partners, LLC | 80.000 | 290 | ||||||
| 2026-04-07 | 13F | Farther Finance Advisors, LLC | 6 | 0 | ||||||
| 2026-02-12 | 13F | Front Row Advisors LLC | 40 | 0,00 | 0 | |||||
| 2026-04-08 | 13F | Sapient Capital Llc | 32.650 | 0,00 | 90 | -23,73 | ||||
| 2026-02-05 | 13F | Amalgamated Bank | 524 | -9,97 | 0 | |||||
| 2026-02-17 | 13F | Russell Investments Group, Ltd. | 1.411 | 0,00 | 5 | -37,50 | ||||
| 2026-04-13 | 13F | IFP Advisors, Inc | 9 | 0 | ||||||
| 2026-02-17 | 13F | Northern Trust Corp | 126.527 | -6,04 | 459 | -42,41 | ||||
| 2026-02-13 | 13F | Morgan Stanley | 73.790 | 342,55 | 268 | 172,45 | ||||
| 2025-11-12 | 13F | Simplex Trading, Llc | Put | 0 | -100,00 | 0 | ||||
| 2026-02-13 | 13F | S Squared Technology, LLC | 723.305 | 0,00 | 2.626 | -38,68 | ||||
| 2026-02-10 | 13F | Bank of New York Mellon Corp | 38.387 | -9,19 | 139 | -44,40 | ||||
| 2026-02-13 | 13F | Charles Schwab Investment Management Inc | 52.810 | 0,00 | 192 | -38,78 | ||||
| 2026-04-13 | 13F | True Wealth Design, LLC | 2 | 0 | ||||||
| 2026-01-26 | 13F | Cwm, Llc | 33 | 57,14 | 0 | |||||
| 2026-01-28 | 13F | Peapod Lane Capital LLC | 630.840 | 0,74 | 2.290 | -38,24 | ||||
| 2026-02-17 | 13F | Advisory Services Network, LLC | 0 | -100,00 | 0 | |||||
| 2026-02-12 | 13F | Steward Partners Investment Advisory, Llc | 4.000 | 15 | ||||||
| 2026-02-17 | 13F | MIRAE ASSET GLOBAL ETFS HOLDINGS Ltd. | 7.723 | -3,21 | 28 | -40,43 | ||||
| 2026-02-10 | 13F | Rothschild Investment Llc | 1 | 0 | ||||||
| 2026-04-14 | 13F | Nbc Securities, Inc. | 300 | 1 | ||||||
| 2026-01-29 | 13F | Huntleigh Advisors, Inc. | 0 | -100,00 | 0 | |||||
| 2026-02-05 | 13F | Allworth Financial LP | 2 | 0 | ||||||
| 2026-02-09 | 13F | Geode Capital Management, Llc | 409.081 | 1,25 | 1.485 | -37,92 | ||||
| 2026-04-22 | 13F | Sterling Capital Management LLC | 553 | -54,15 | 2 | -75,00 | ||||
| 2026-02-13 | 13F | Citigroup Inc | 1.073 | 415,87 | 4 | 200,00 | ||||
| 2026-02-06 | 13F | Pnc Financial Services Group, Inc. | 0 | -100,00 | 0 | |||||
| 2026-02-13 | 13F | State Street Corp | 180.288 | -0,35 | 654 | -38,94 | ||||
| 2026-04-28 | 13F | SBI Securities Co., Ltd. | 2 | 0,00 | 0 | |||||
| 2026-02-17 | 13F | Ancora Advisors, LLC | 200 | -48,98 | 1 | -100,00 | ||||
| 2026-02-13 | 13F | Nantahala Capital Management, LLC | 914.618 | 0,00 | 3.320 | -38,68 | ||||
| 2026-02-17 | 13F | XTX Topco Ltd | 10.522 | 38 | ||||||
| 2026-01-29 | 13F | UBS Group AG | 14.099 | 41,20 | 51 | -13,56 | ||||
| 2026-01-29 | 13F | Vanguard Group Inc | 847.010 | 1,32 | 3.075 | -37,87 | ||||
| 2026-02-11 | 13F | Deutsche Bank Ag\ | 0 | -100,00 | 0 | -100,00 | ||||
| 2025-11-14 | 13F | Millennium Management Llc | 0 | -100,00 | 0 | -100,00 | ||||
| 2026-02-13 | 13F | Wells Fargo & Company/mn | 18.820 | 39,42 | 68 | -13,92 | ||||
| 2026-02-13 | 13F | Marshall Wace, Llp | 27.289 | 99 | ||||||
| 2026-04-24 | 13F | James Investment Research Inc | 10.600 | 0,00 | 29 | -23,68 | ||||
| 2026-02-11 | 13F | Jpmorgan Chase & Co | 19.156 | -6,41 | 70 | -42,98 | ||||
| 2026-02-10 | 13F/A | Northwestern Mutual Wealth Management Co | 202 | 0,00 | 1 | -100,00 | ||||
| 2026-02-13 | 13F | Barclays Plc | 29.198 | 5,06 | 106 | -35,98 | ||||
| 2026-04-21 | 13F | P.a.w. Capital Corp | 150.000 | 0,00 | 416 | -23,71 | ||||
| 2025-11-14 | 13F | Raymond James Financial Inc | 0 | -100,00 | 0 | -100,00 | ||||
| 2026-02-17 | 13F | Fmr Llc | 2.296 | 3,24 | 8 | -38,46 | ||||
| 2026-02-17 | 13F | California State Teachers Retirement System | 1.027 | -3,48 | 4 | -50,00 | ||||
| 2026-02-12 | 13F | Renaissance Technologies Llc | 128.261 | -6,85 | 466 | -42,94 | ||||
| 2026-02-10 | 13F | Connor, Clark & Lunn Investment Management Ltd. | 23.932 | -12,58 | 87 | -46,91 | ||||
| 2026-02-12 | 13F | New York State Common Retirement Fund | 13.694 | 0,00 | 50 | -39,51 | ||||
| 2026-02-17 | 13F | Citadel Advisors Llc | 43.295 | 157 | ||||||
| 2026-02-17 | 13F | Bridgeway Capital Management Inc | 123.000 | 0,00 | 446 | -38,74 | ||||
| 2026-02-13 | 13F | Mariner, LLC | 48.028 | -61,18 | 174 | -76,23 | ||||
| 2026-02-18 | 13F | GWM Advisors LLC | 11.601 | 0,01 | 42 | -38,24 | ||||
| 2026-02-11 | 13F | Simplex Trading, Llc | Call | 3.000 | 0,00 | 11 | ||||
| 2026-02-10 | 13F | Goldman Sachs Group Inc | 44.970 | 8,76 | 163 | -33,20 | ||||
| 2026-02-17 | 13F | Ameriprise Financial Inc | 916.802 | 1,16 | 3.328 | -37,99 | ||||
| 2026-04-30 | 13F | Nuveen, LLC | 21.927 | 0,00 | 61 | -24,05 | ||||
| 2026-04-20 | 13F | Ritholtz Wealth Management | 0 | -100,00 | 0 | |||||
| 2026-01-14 | 13F | Spire Wealth Management | 0 | -100,00 | 0 | |||||
| 2026-02-12 | 13F | BlackRock, Inc. | 1.093.583 | 0,33 | 3.970 | -38,48 |
Other Listings
| US:GAIA | 3,26 $ |